Written by Jeff Miller, A Dash of Insight
— this post authored by Mark D. Hines
An “anomaly” is something that deviates from what is standard, normal, or expected. And in trading and/or investing, a market anomaly (or market inefficiency) is a price and/or rate of return distortion that seems to contradict the efficient-market hypothesis. “Beating the market” is something many traders try to do, but few actually succeed. Throughout history, many market anomalies have been touted. Here are three such anomalies that beat the market.
Please share this article – Go to very top of page, right hand side, for social media buttons.
1. Momentum, Per Gene Fama
Momentum is the market anomaly whereby rising stock prices tend to rise further, and falling stock prices tend to keep falling. And Eugene Fama is the Nobel Prize winner who came up with the Efficient Market Hypothesis (i.e. the theory that says stock prices fully reflect all available information, thereby making it impossible for anyone to consistently beat the market). Fama is not well-known or liked in popular media, but he is absolute royalty is the world of academia.
In an interview last week, Fama had some interesting things to say about the momentum anomaly in this interview:
Specifically, he said momentum is the one example of a market anomaly where the data is actually robust enough to make it difficult to deny momentum is a valid anomaly. We use momentum in our trading models, and we’ll give some specific examples later in this report.
2. Sell in May (or is it Buy?), and then Go Away!
Another longstanding trading mantra/anomaly is the idea that traders should “sell in May and go away” in order to avoid seasonal declines. However, popular author and founder of StockTwits, Howard Lindzon, has a different take on this well-known adage in his timely article:
3. Niche Strategies
One of the few advantages small traders and investors have over “the big guys” is the ability to participate in niche markets. For instance, this can include low-volume options markets and thinly trade bond markets. For example, Blue Harbinger’s favorite hedge fund is often able to move in and out of thinly traded bond issuances at attractive prices because of the fund’s relatively small size. This is an attractive niche space that a $10 billion PIMCO fund is simply too big to participate in with any significant degree of success.
Further still, even when data “proves” that anomalies exist, exploiting them in real life is often more challenging than meets the eye.
Model Performance:
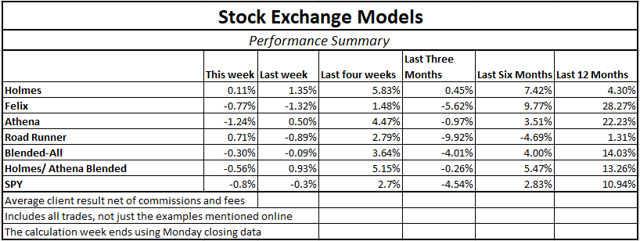
Per reader feedback, we’re continuing to share the performance of our trading models.
We find that blending a trend-following / momentum model (Athena) with a mean reversion / dip-buying model (Holmes) provides two strategies, effective in their own right, that are not correlated with each other or with the overall market. By combining the two, we can get more diversity, lower risk, and a smoother string of returns.
And for these reasons, I am changing the “Trade with Jeff” offer at Seeking Alpha to include a 50-50 split between Holmes and Athena. Current participants have already agreed to this. Since our costs on Athena are lower, we have also lowered the fees for the combination.
If you have been thinking about giving it a try, click through at the bottom of this post for more information. Also, readers are invited to write to main at newarc dot com for our free, brief description of how we created the Stock Exchange models.
Expert Picks From The Models:
This week’s Stock Exchange is being edited by Blue Harbinger; (Blue Harbinger is a source for independent investment ideas).
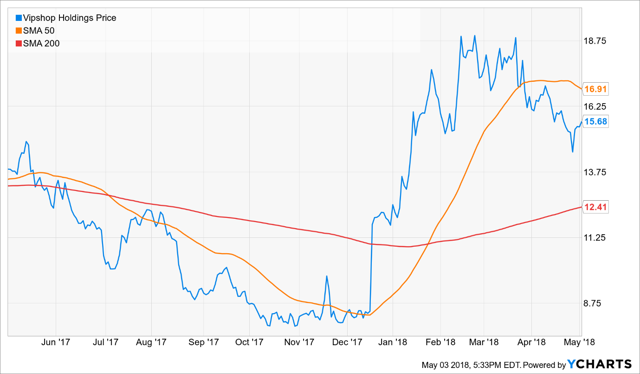
Holmes: I sold Vipshop (VIPS) on May 1st for around $15.30 per share. Are you familiar with this stock, Blue Harbinger?
Blue Harbinger: Yes, we discussed VIPS when you purchased these shares for around $8.35 back in October. VIPS is a Chinese company, and it trades as an ADR. It’s basically an online discount retailer for brand names. They have flash sales where they have a limited amount of brand name products to sell. Did you sell because it’s May, and you believe in the mantra “sell in May, and go away” that was covered earlier.
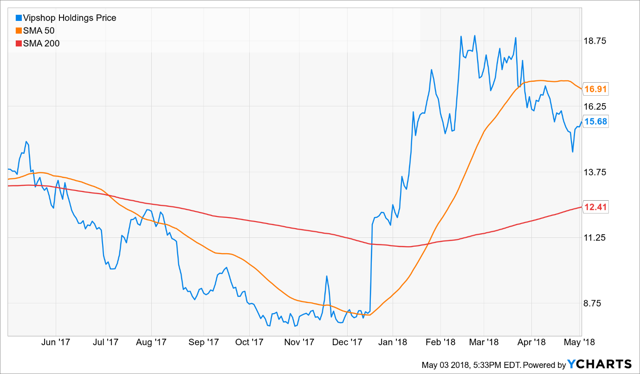
Holmes: No, that’s not the reason. As you know, I am a “dip-buyer.” And as you can see in the chart below, the shares have recovered nicely since they dipped back in October.
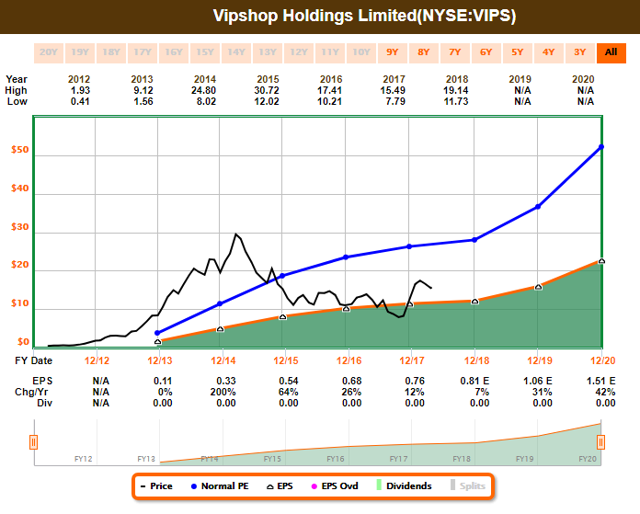
BH: Not a bad trade, Holmes. Looks like you made some money. Was there something in the fundamentals you saw that caused you to sell? Here is the Fast Graph.
Holmes: Thanks for asking and sharing, but you know I am a model, and all of my trades are generated systematically and based on the technicals.
BH: True. And again, nice trade. How about you Road Runner – any trades this week?
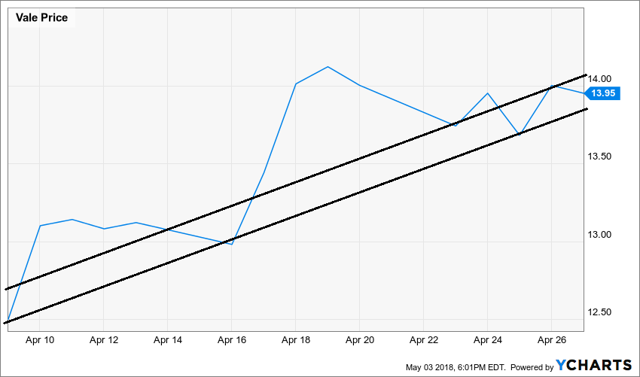
Road Runner: Yes. This week I purchased Brazilian company, VALE (VALE). The company engages in the production and exportation of iron ore, pellets, manganese, and iron alloys, which are raw materials needed for steelmaking.
BH: Interesting. I know you like to buy stocks in the lower end of a rising channel. And based on the following chart, I can see why you purchased VALE.
Road Runner: That’s exactly right. And you also know that my typical holding period is only around 4-weeks, right.
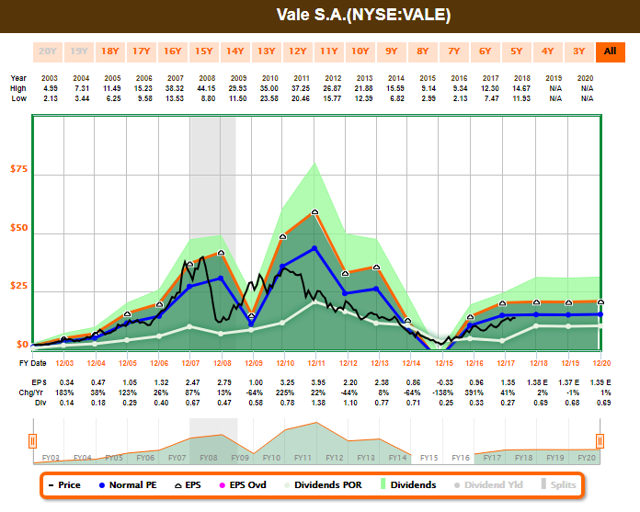
BH: Yes, I did know that too. VALE announced earnings near the end of April, and results were slightly below expectations, which caused the dip. Here is a look at the Fast Graph.
Road Runner: Thanks for that background, it’s always interesting to hear you make up a story to fit the chart.
BH: It’s not a made up story – that’s what happened. Q1 EPS was $0.31, $0.05 below expectations, and revenue was $8.6B (+0.9% Y/Y), $150M below expectations. Anyway, how about you, Athena – any trades?
Athena: Yes. Like Holmes, this week I sold my shares of Vipshop (VIPS). However, unlike Holmes, I bought my shares in early January.
BH: Looks like you didn’t do as well as Holmes on your trade. Why’d you sell, Athena?
Athena: I sold according to my trading program. It was a combination of time (I usually hold about 17-weeks), price, and some additional propriety factors. I didn’t make money on this trade, but I didn’t lose much either. Losing less on your losers than you make on your winners is better than the other way around.
BH: True. And thank you. How about you Felix – any trades?
Felix: No trades to share this week, but I do have a ranking for you. Specifically, I ran the Nasdaq 100 through my model, and I’ve listed the top 20 below.

BH: Interesting ranking. What is the criteria?
Felix: I am a momentum trader. However, my typical holding period is around 66 weeks, on average – much longer than the other traders.
BH: I like your top 3 picks this week. They’ve certainly had momentum over the last year, and they’ve also got the fundamentals to keep running, in my view. How about you, Oscar – anything to share this week?
Oscar: Yes, this week I ranked our “diverse and comprehensive ETF universe.” Here are the top 20.

BH: I see Oil (USO) ranked at the top. This makes sense considering you are a momentum/trend-follower trader, and oil prices continue to rally, even though they’re still far below where they were in early 2014.
Oscar: Yes. Our version of momentum is more complicated than simply securities that have been rallying, but you have the general idea right.
Conclusion:
Many market anomalies are discussed by traders, but only some of them are supported by data, and they’re often challenging to implement in real life. However, as shown in our earlier performance table, we’ve been having success with our trades. Further, our various trading programs have the ability to operate in certain niche market spaces, thereby giving us more opportunities to beat the market in terms or risk versus reward, and because our strategies can often add highly valuable diversification benefits because of their lower correlations with the overall market.
Background On The Stock Exchange:
Each week, Felix and Oscar host a poker game for some of their friends. Since they are all traders, they love to discuss their best current ideas before the game starts. They like to call this their “Stock Exchange.” (Check out Background on the Stock Exchange for more background). Their methods are excellent, as you know if you have been following the series. Since the time frames and risk profiles differ, so do the stock ideas. You get to be a fly on the wall from my report. I am usually the only human present and the only one using any fundamental analysis.
The result? Several expert ideas each week from traders, and a brief comment on the fundamentals from the human investor. The models are named to make it easy to remember their trading personalities.
Getting Updates:
Readers are welcome to suggest individual stocks and/or ETFs to be added to our model lists. We keep a running list of all securities our readers recommend, and we share the results within this weekly “Stock Exchange” series when feasible. Send your ideas to “etf at newarc dot com.” Also, we will share additional information about the models, including test data, with those interested in investing. Suggestions and comments about this weekly “Stock Exchange” report are welcome.
Trade Alongside Jeff Miller: Learn More.


