Written by Sig Silber
This article provides up to date information on the U.S. Southwest Monsoon. I have tried to limit the commentary so that the graphics which auto-update are current at all times. When there are special situations I probably will add commentary to address them. We are publishing this article because the general description of the NOAA monthly and seasonal forecasts is general and the Monsoon plays out in a pattern that varies a lot from place to place. This shows the Season to Date performance of the Southwest Monsoon plus a lot of other information.
![]()
This article provides continuous updates for the Southwest Monsoon
Please share this article – Go to the very top of the page, right-hand side for social media buttons. Also, feel free to send this email to anyone you feel will benefit from it
Status of the Monsoon
Let’s go back to our discussion of the typical configurations of the Monsoon especially with regards to severe weather.
I prefer to use the graphics provided by Arizona (as they are the experts on the Monsoon) but you can extrapolate the interpretation to beyond Arizona. I show the four maps and the discussion of each map can be found here.
 |  |
 |
|

I prepared a little table to provide some information on when the different types might occur during the Monsoon. The full information is in the Summer Severe Thunderstorm Patterns in Arizona. The patterns apply to the entire area. The arrows on the graphic provide additional information.
| Type | When to Expect |
| I | Most Common |
| II | As the Monsoon Matures |
| III | Late |
| IV | Very Late and May Signal the End |
Notice that during the Monsoon the location of the Four Corners High Migrates not always in a predictable way but there is a pattern to it and you can see that in the graphics above. Only a selection of patterns is shown. Other references may refer to other important patterns.
So which type of positioning is this?
Let’s look at the MId-Atmosphere pattern.

Performance of the Monsoon this Year.
Arizona and New Mexico Monsoon Maps.
I usually leave it to readers to go to this link and look at the graphics but tonight I am going to take a look briefly at both Arizona and New Mexico season to date. The season starts on June 15, 2020. These graphics should update and I am letting them do that i.e.. not freezing them.
First let us look at them side by side and then I will show them individually and larger.
 |  |
 |  |
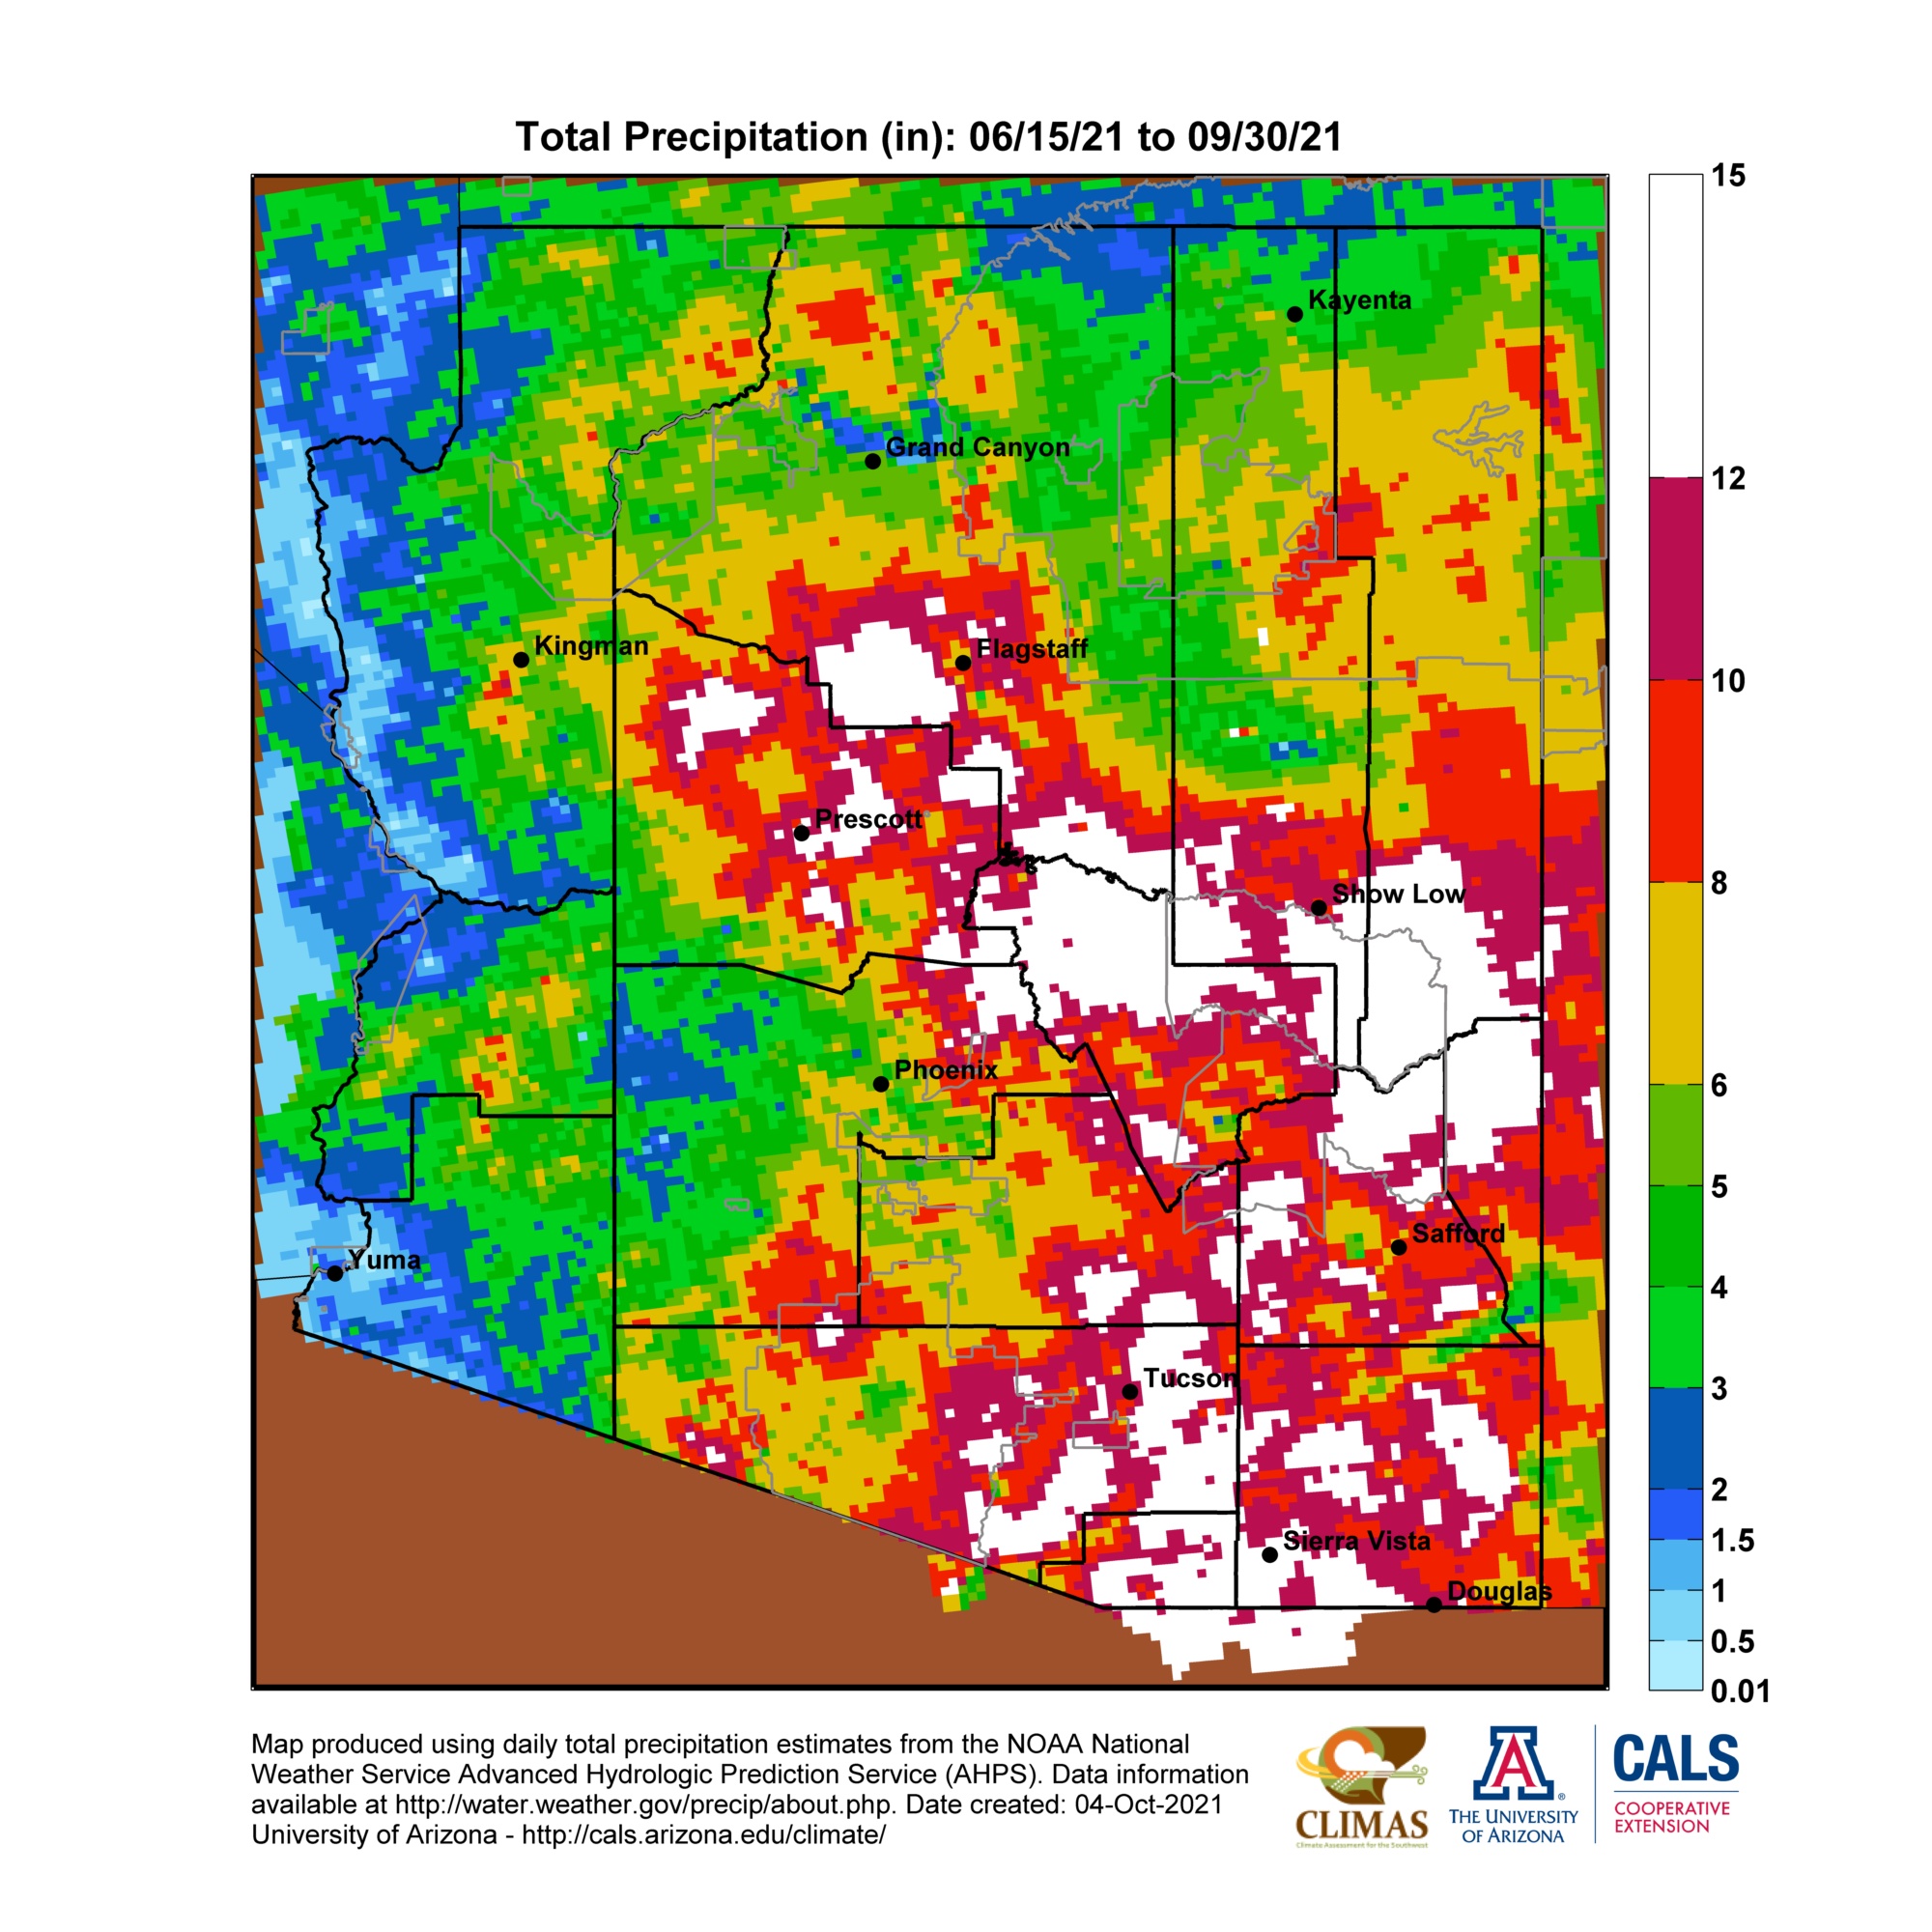
First looking at Arizona.
Actual precipitation
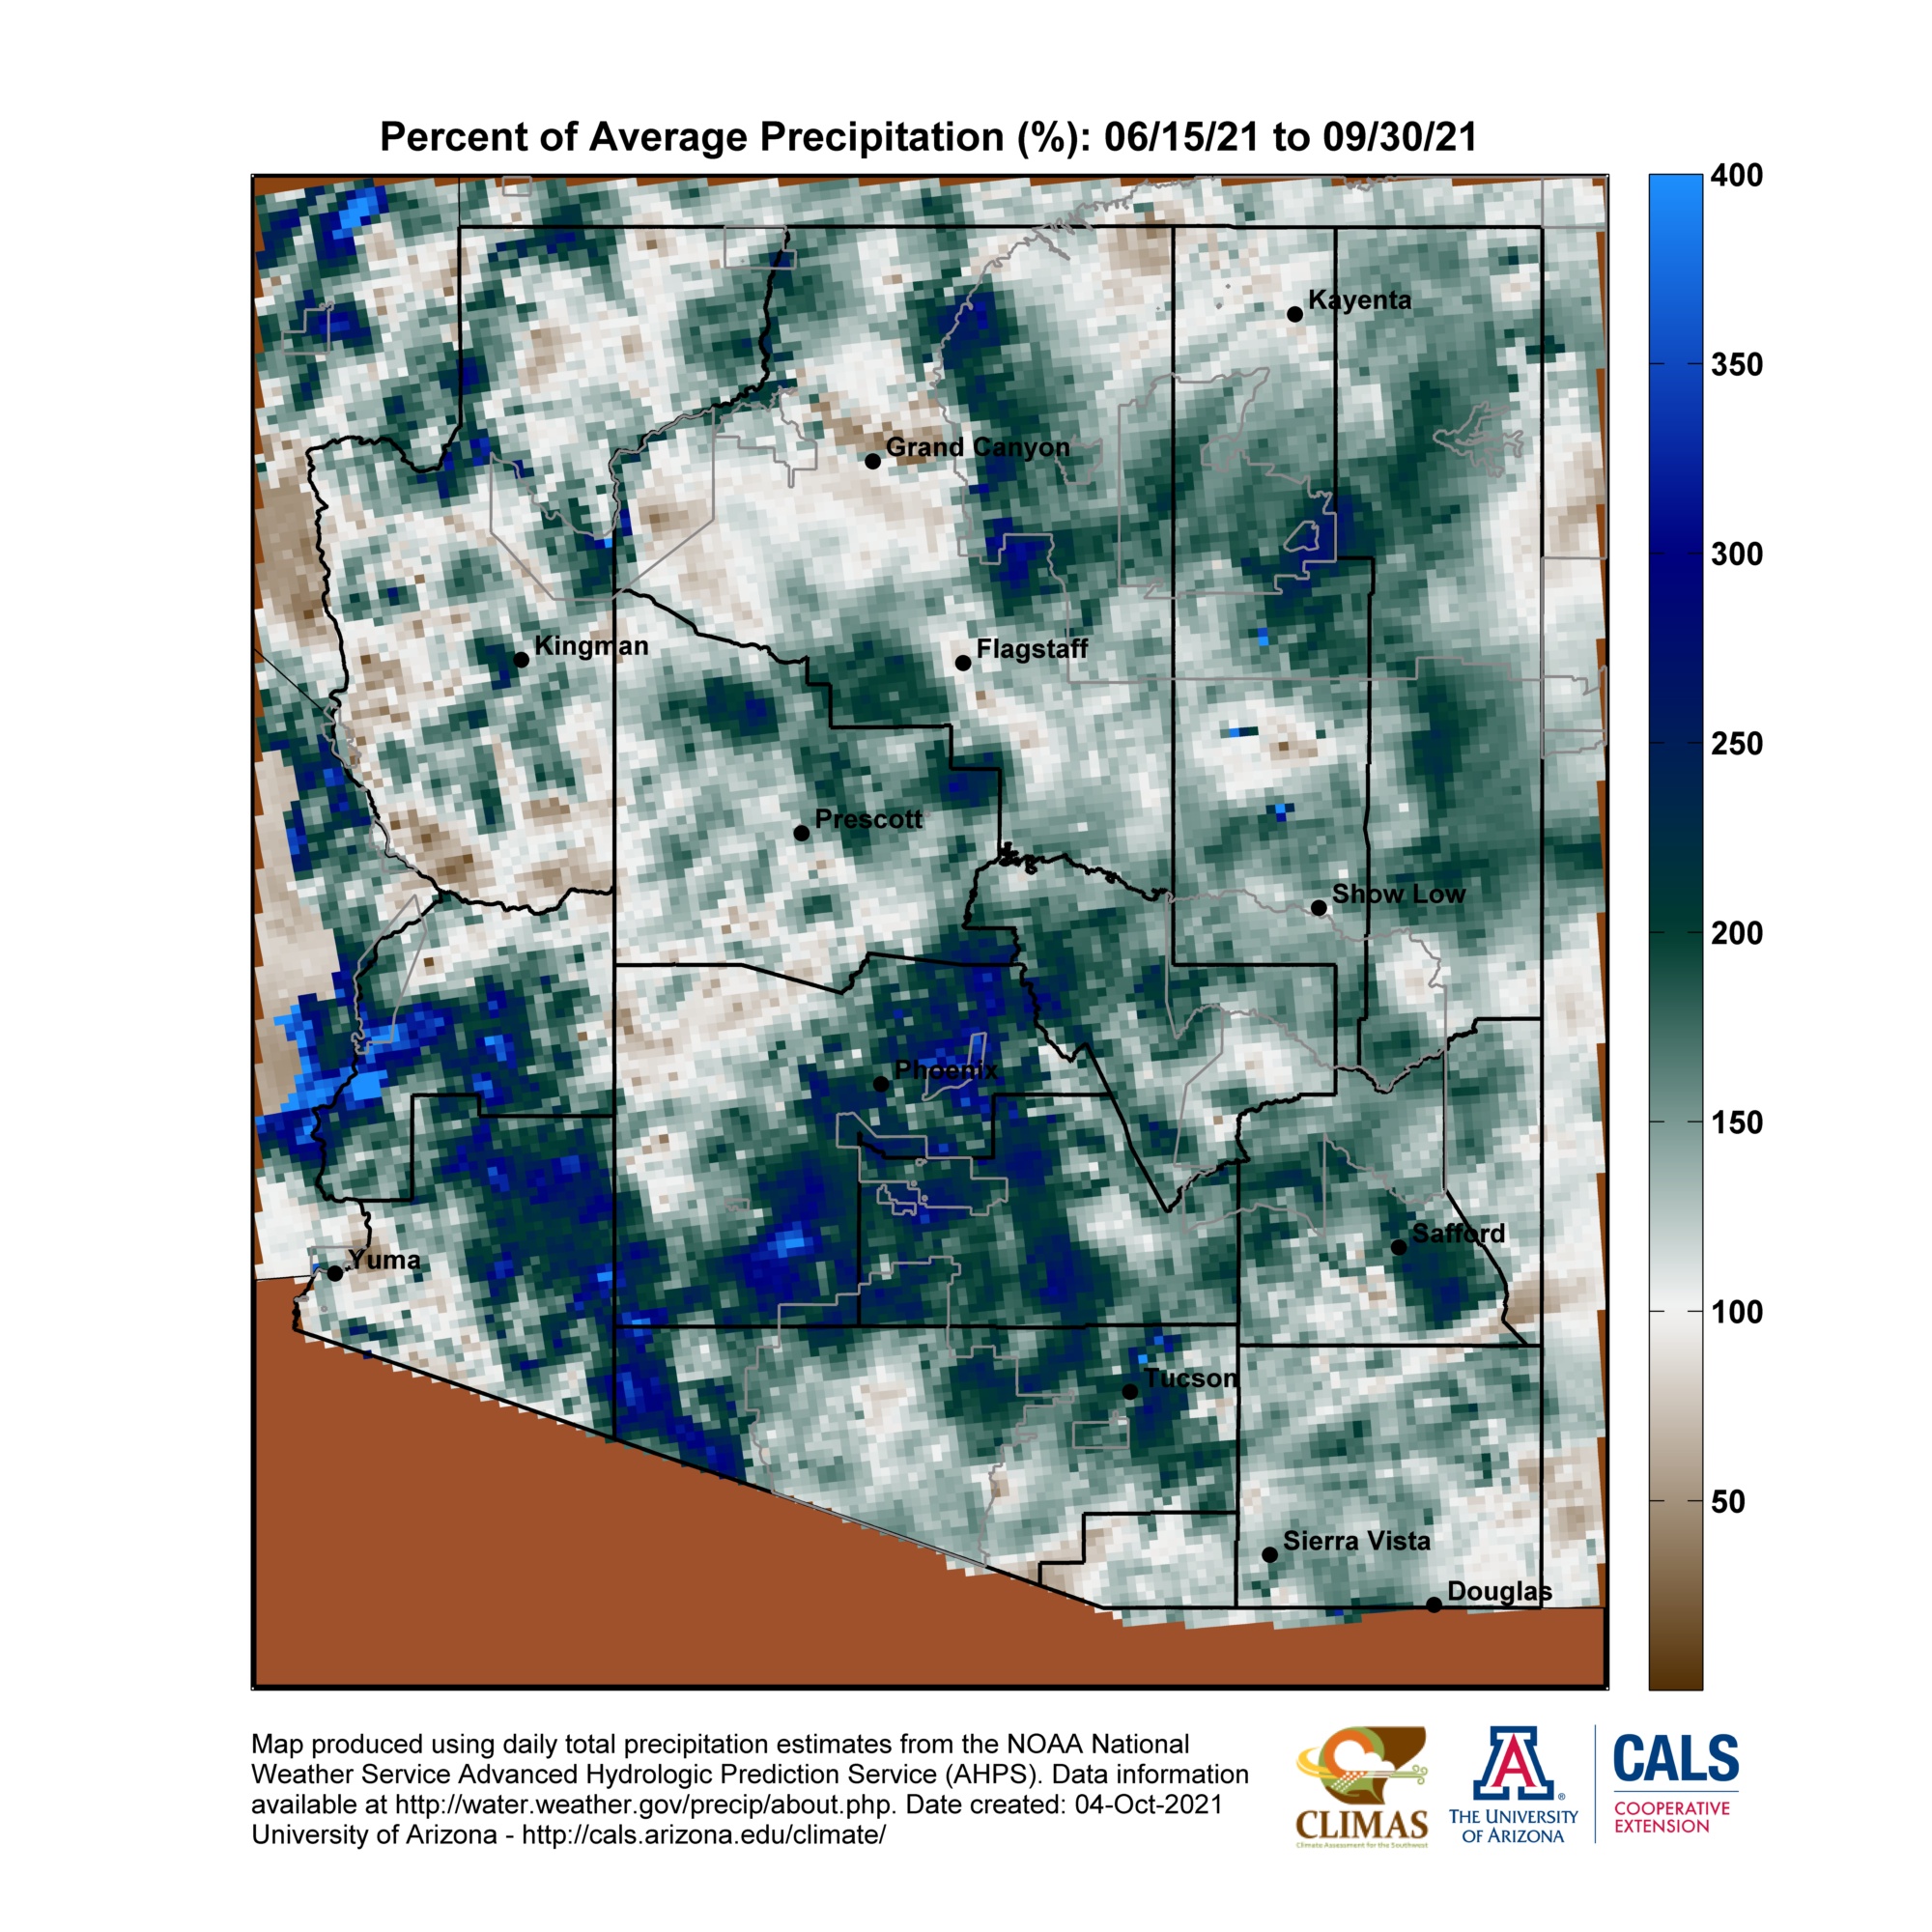
Then we look at percent of normal.
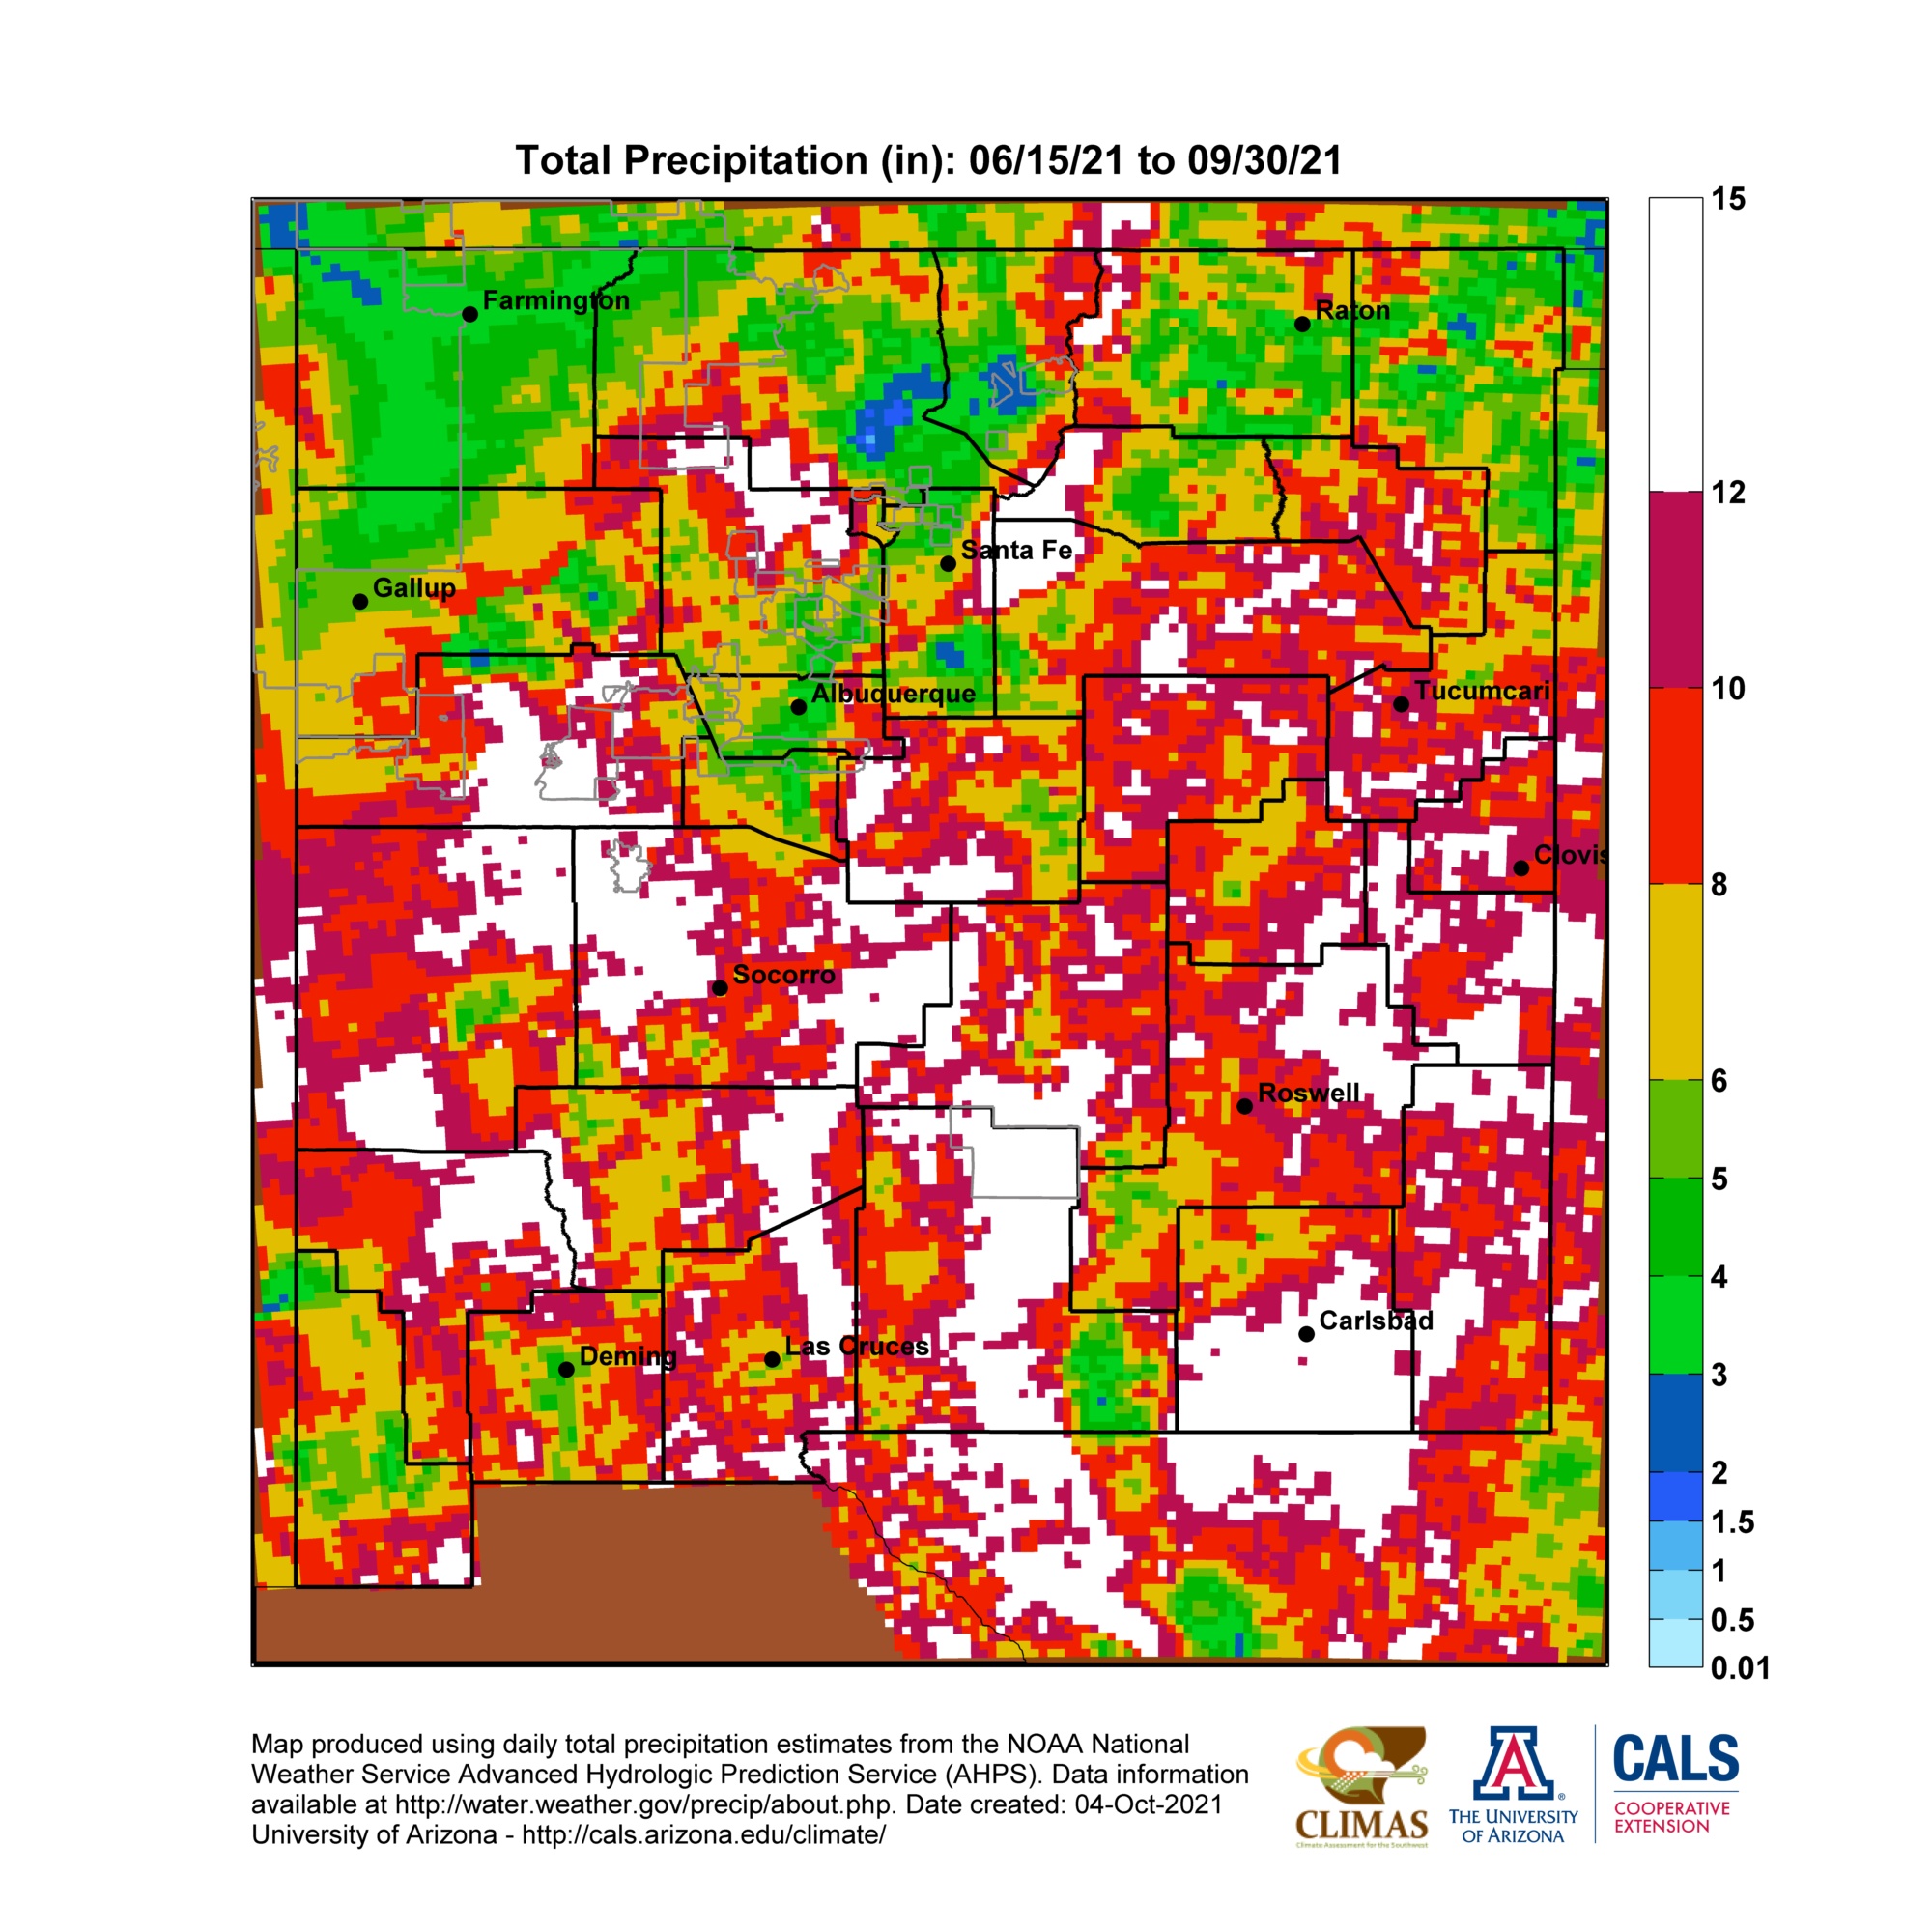
Now we look at New Mexico
First Actual Precipitation
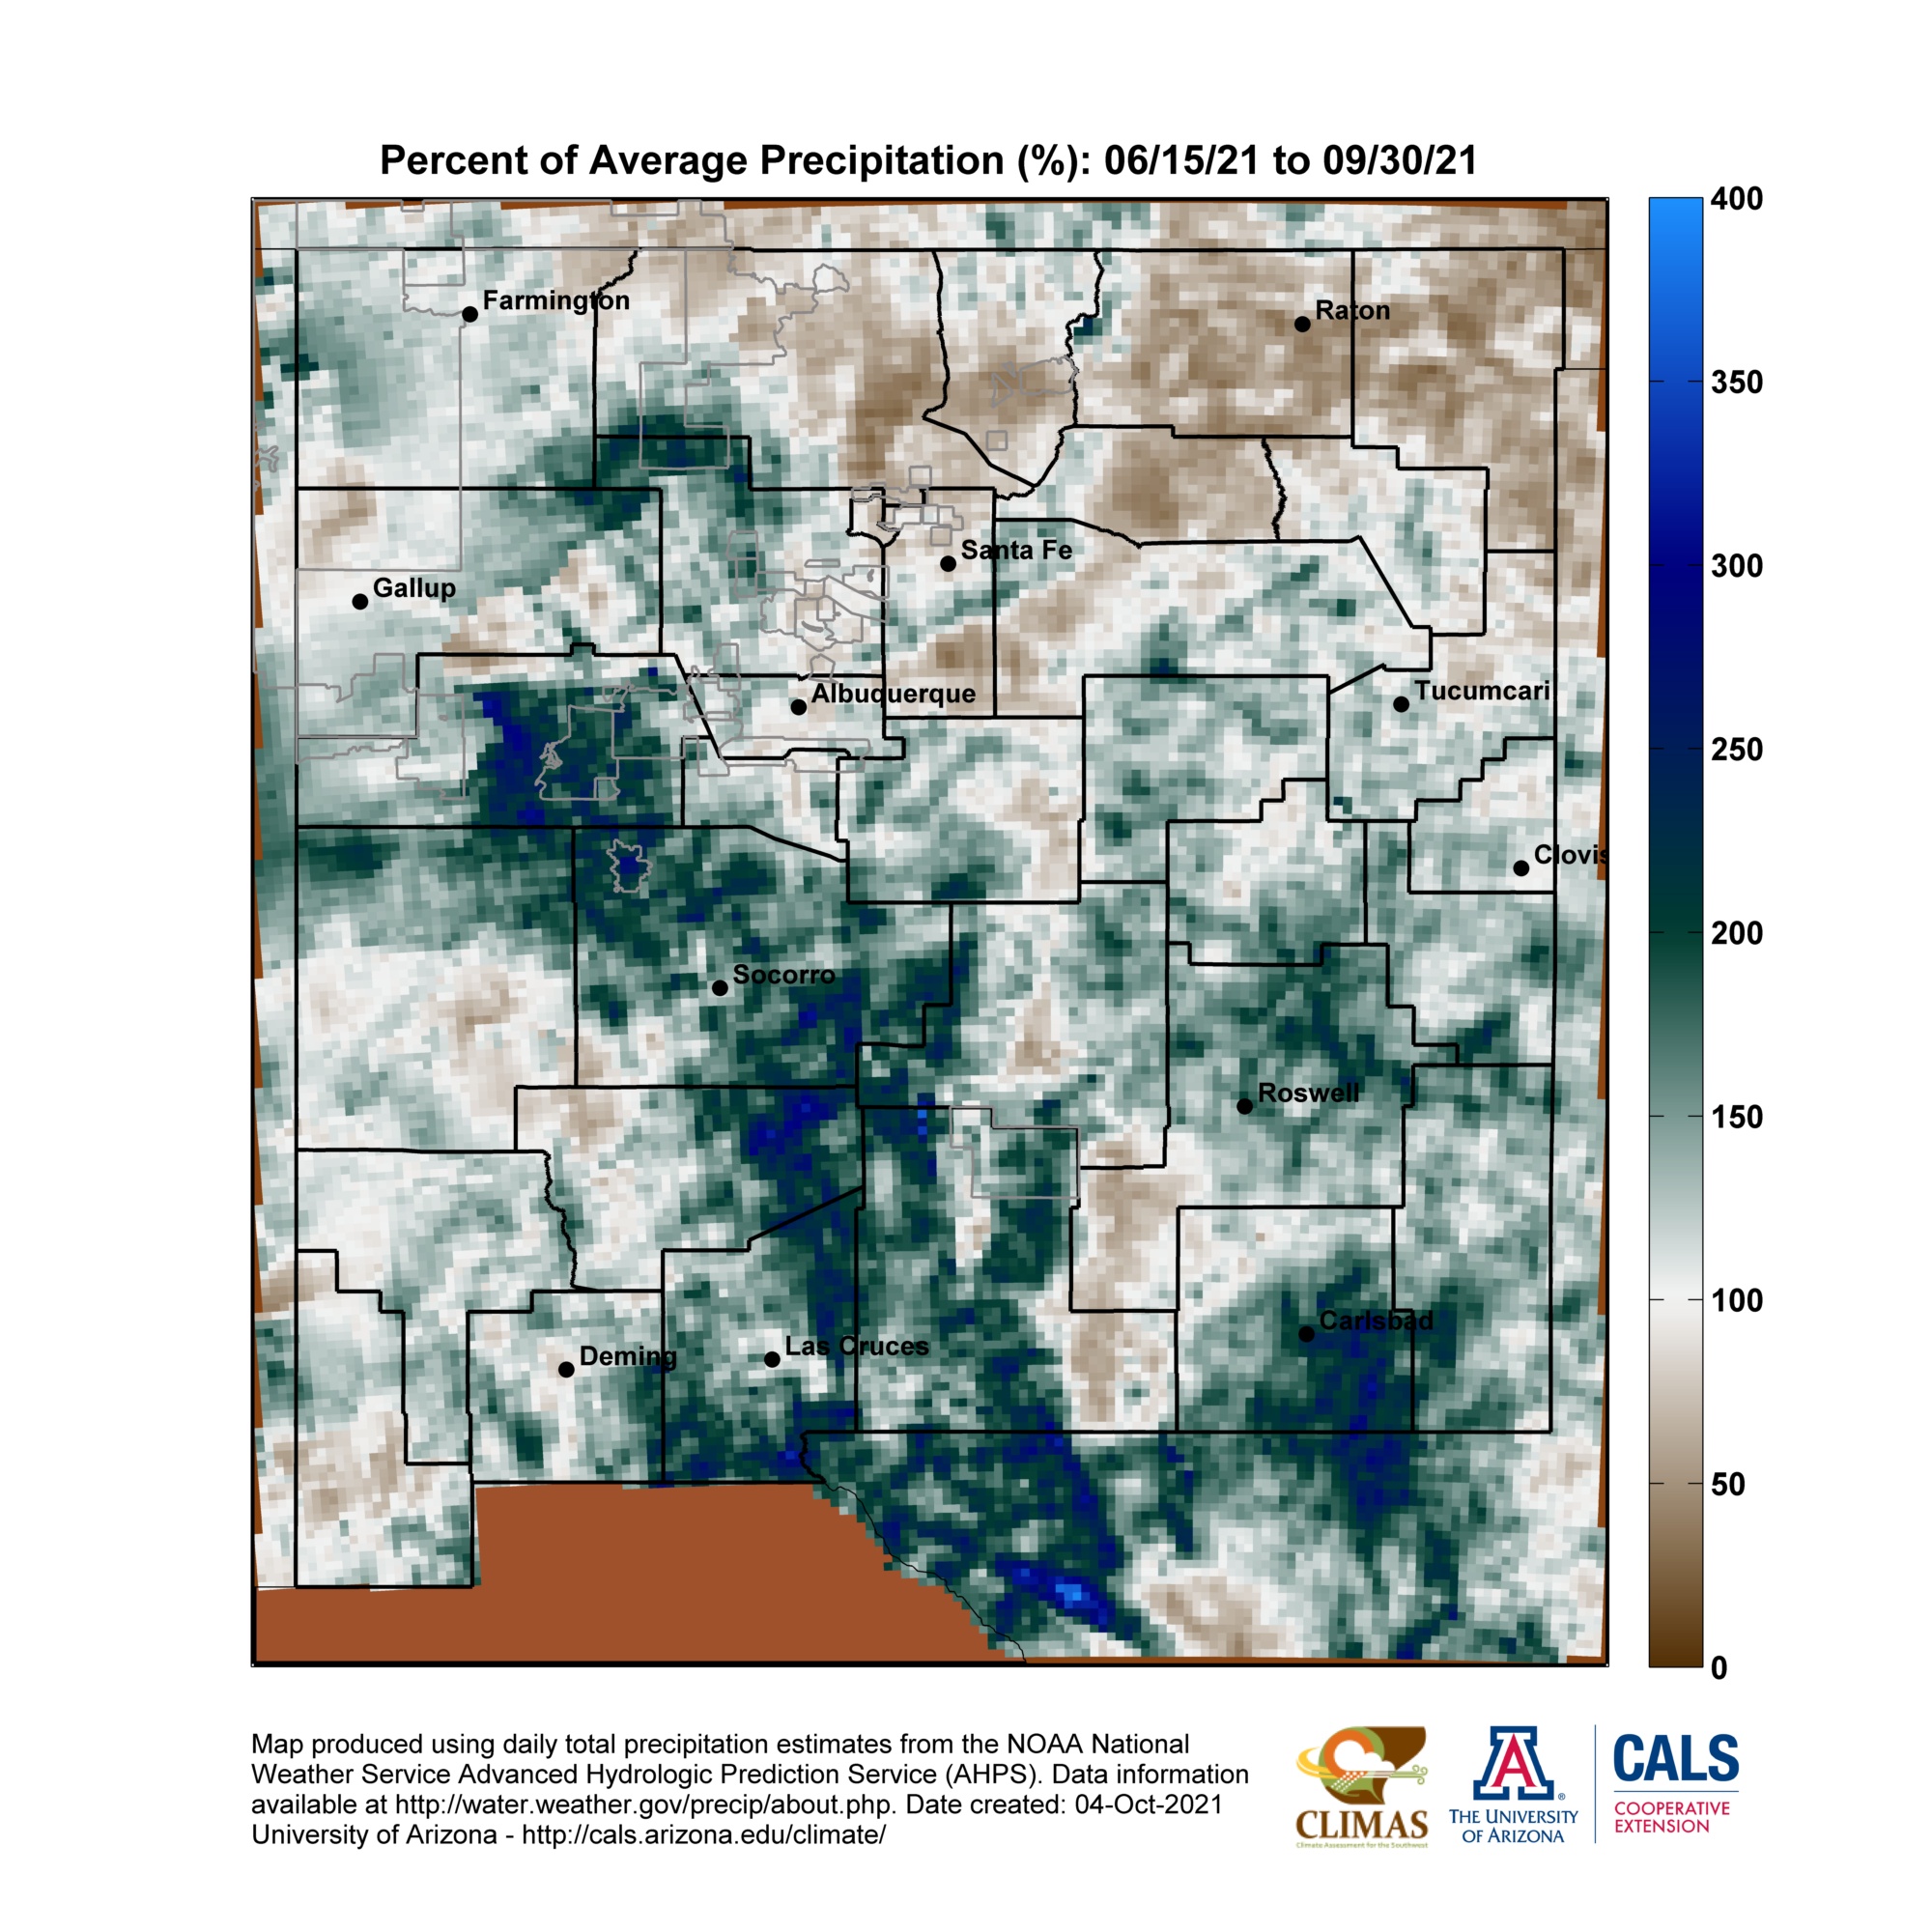
Then Percent of Normal
Looking at individual Cities.
You can get this information from the link used to access the above graphics namely Here You can drill down and find the data by city in both New Mexico and Arizona. Too make it easier you can go right to A companion site of station level plots can be found here. The information you find may be complicated to interpret but for those who live near those places, it may be very valuable. In many cases, you have historical data.
.


