by Doug Short / Jill Mislinski, Advisor Perspectives/dshort.com
The University of Michigan Preliminary Consumer Sentiment for December came in at 98.0, up from the November Final reading and its highest since January 2015. Investing.com had forecast 94.5.

Surveys of Consumers chief economist, Richard Curtin makes the following comments:
Consumer confidence surged in early December to just one-tenth of an Index point below the 2015 peak—which was the highest level since the start of 2004. The surge was largely due to consumers’ initial reactions to Trump’s surprise victory. When asked what news they had heard of recent economic developments, more consumers spontaneously mentioned the expected positive impact of new economic policies than ever before recorded in the long history of the surveys. To be sure, an equal number volunteered negative judgments about prospective economic policies, but the frequency of those negative references was less than half its prior peak levels whereas positive references were about twice its prior peak. There were a few exceptions to the early December surge in optimism, mainly among those with a college degree and among residents of the Northeast, although no group has adopted a pessimistic outlook for the economy. The most important implication of the increase in optimism is that it has raised expectations for the performance of the economy. President-elect Trump must provide early evidence of positive economic growth as well as act to keep positive consumer expectations aligned with performance. Either too slow growth or too high expectations represent barriers to maintaining high levels of consumer confidence. Until specific policies are proposed, there is no reason to alter the 2017 forecast of 2.5% for real consumption.
See the chart below for a long-term perspective on this widely watched indicator. Recessions and real GDP are included to help us evaluate the correlation between the Michigan Consumer Sentiment Index and the broader economy.

To put today’s report into the larger historical context since its beginning in 1978, consumer sentiment is 14.6 percent above the average reading (arithmetic mean) and 16.0 percent above the geometric mean. The current index level is at the 88th percentile of the 468 monthly data points in this series.
The Michigan average since its inception is 85.5. During non-recessionary years the average is 87.6. The average during the five recessions is 69.3. So the latest sentiment number puts us 28.7 points above the average recession mindset and 10.4 points below the non-recession average.
Note that this indicator is somewhat volatile, with a 3.0 point absolute average monthly change. The latest data point saw a 4.2 point change from the previous month. For a visual sense of the volatility, here is a chart with the monthly data and a three-month moving average.

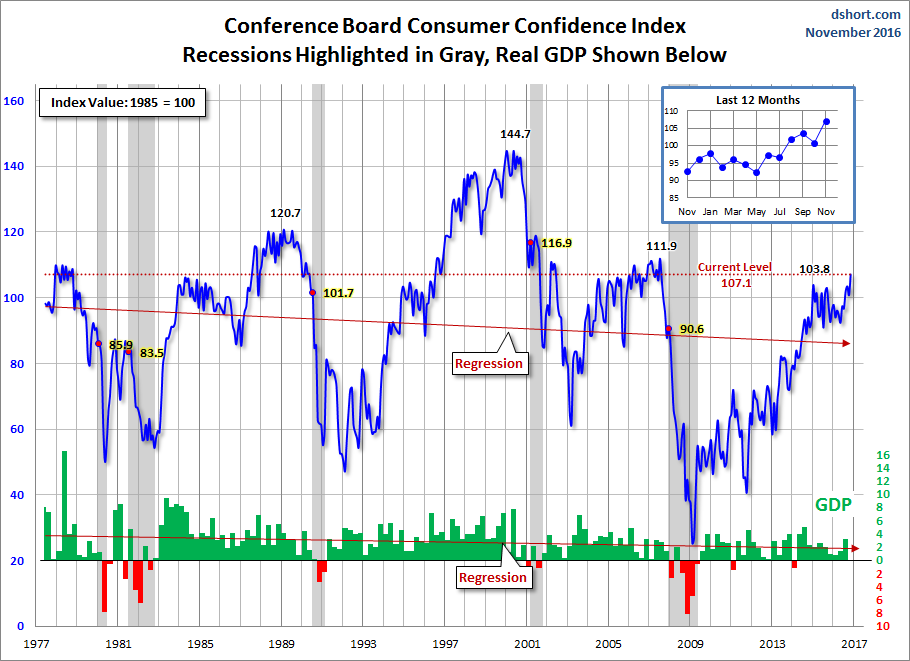
For the sake of comparison, here is a chart of the Conference Board’s Consumer Confidence Index (monthly update here). The Conference Board Index is the more volatile of the two, but the broad pattern and general trends have been remarkably similar to the Michigan Index.
And finally, the prevailing mood of the Michigan survey is also similar to the mood of small business owners, as captured by the NFIB Business Optimism Index (monthly update here).

The general trend in the Michigan Sentiment Index since the Financial Crisis lows has been one of slow improvement.The survey findings since December 2015 saw gradual decline followed by a bounceback later in the year, with January 2015 remaining the interim peak.
Caveats on the Use of University of Michigan Consumer Sentiment
This survey is quantitatively derived from a fairly complex questionnaire (sample here) via a monthly telephone survey. According to Bloomberg:
This release is frequently released early. It can come out as early as 9:55am EST. The official release time is 10:00. Base year 1966=100. A survey of consumer attitudes concerning both the present situation as well as expectations regarding economic conditions conducted by the University of Michigan. For the preliminary release approximately three hundred consumers are surveyed while five hundred are interviewed for the final figure. The level of consumer sentiment is related to the strength of consumer spending. Please note that this report is released twice per month. The first is a preliminary figure while the second is the final (revised) figure.
This is a survey, a quantification of opinion rather than facts and data. The question – does sentiment lead or truly correlate to any economic activity? Since 1990, there seems to be a loose general correlation to real household income growth.

include(“/home/aleta/public_html/files/ad_openx.htm”); ?>


