Written by Steven Hansen
This post is a review of all major leading indicators follows – and no leading index is particularily strong.
Analyst Opinion of the Leading Indicator Forecasts
Most of the leading indicators are based on factors which are known to have significant backward revisions – and one cannot take any of their trends to the bank. I continue to pose the question – “what good is a leading indicator where the data is continued to change after it is issued?”. Throughout my career, I have been faced with “experts” who want to measure at a certain place – where for a variety of reasons that place is not reliable in real time. It is always best to measure at a place where accurate real time information is already available.
And true to form, the Philly Fed Leading Index which indicated that in their original August release that the six month forecast was going to decline to a 1.3% growth six months from now, and this month August was revised to decline to 1.1%. The current forecast is for economic growth to rise from 1.1% to 1.2%.
The only indicators with minimal backward revision are ECRI, RecessionALERT, and the Chemical Activity Barometer. Unfortunately, the Chemical Activity Barometer is targeted to the industrial sector of the economy – and at best seems to be a coincident indicator, not a leading indicator. Both ECRI and RecessionALERT were forecasting economic improvement beginning at mid-2016 – and is now forecasting flat (but relatively better) growth beginning 5 months from now.
Econintersect sees NO dynamic which will deliver better growth anyone will feel in the foreseeable future. All economic growth will only be seen when one uses a calculator.
The leading indicators are to a large extent monetary based. Econintersect does not use any portion of the leading indicators in its economic index. Most leading indices in this post look ahead six months – and are all subject to backward revision.
Philly Fed Leading Index
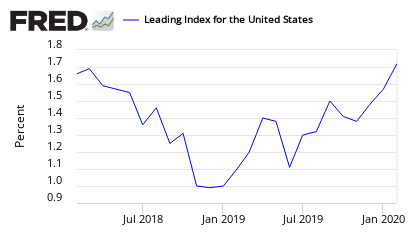
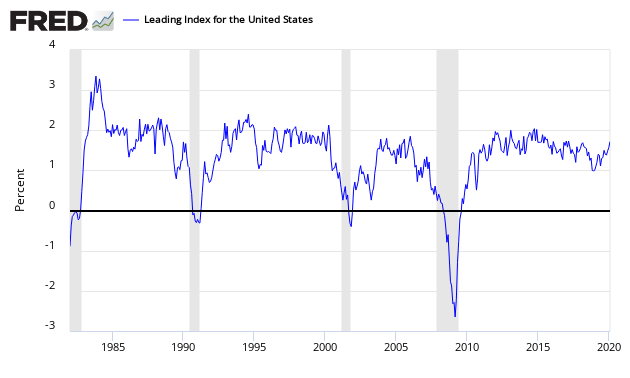
The Philly Fed Leading Index for the United States is continuously recalculated (what good is a leading index whose history continues to be recalculated?). Note that this index is not accurate in real time as it is subject to backward revision, Per the Philly Fed:
The Federal Reserve Bank of Philadelphia has released the leading indexes for the 50 states for September 2016. The indexes are a six-month forecast of the state coincident indexes (also released by the Bank). Forty state coincident indexes are projected to grow over the next six months, and 10 are projected to decrease. For comparison purposes, the Philadelphia Fed has also developed a similar leading index for its U.S. coincident index, which is projected to grow 1.2 percent over the next six months.

z philly fed leading.PNG
Index Values Over the Last 12 Months
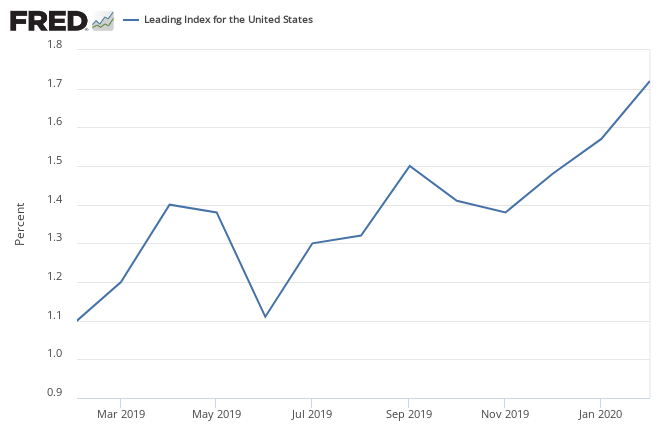
This index has been noisy, but remains above 1%, and is about mid-range of the values seen since the end of the Great Recession.
Chemical Activity Barometer (CAB)
– The CAB is an exception to the other leading indices as it leads the economy by two to fourteen months, with an average lead of eight months. The CAB is a composite index which comprises indicators drawn from a range of chemicals and sectors. Its relatively new index has been remarkably accurate when the data has been back-fitted, however – its real time performance is unknown – you can read more here. A value above zero is suggesting the economy is expanding. Note that the authors of this index want to be measured against industrial production. Econintersect‘s analysis of this index is [here].

z chemical_activity_barometer.png
ECRI WLI Index
ECRI’s Weekly Leading Index – the methodology used in created this index is not released but is widely believed to be monetary based. Econintersect‘s review of this index is [here].

The Conference Board’s Leading Economic Indicator (LEI)
Econintersect’s review of this index is [here]. The LEI has historically dropped below zero in its six-month moving average anywhere between 2 to 15 months before a recession.

Econintersect Economic Index
Unlike the other leading indices, Econintersect Leading Index (LEI) only forecasts one month in advance.
The EEI is a non-monetary based economic index which counts “things” that have shown to be indicative of direction of the Main Street economy at least 30 days in the future. Note that the Econintersect Economic Index is not constructed to mimic GDP (although there are correlations, but the turning points may be different), and tries to model the economic rate of change seen by business and Main Street. The vast majority of this index uses data not subject to backward revision.
Econintersect Economic Index (EEI) with a 3 Month Moving Average (red line)

z forecast1.PNG
RecessionAlert.com
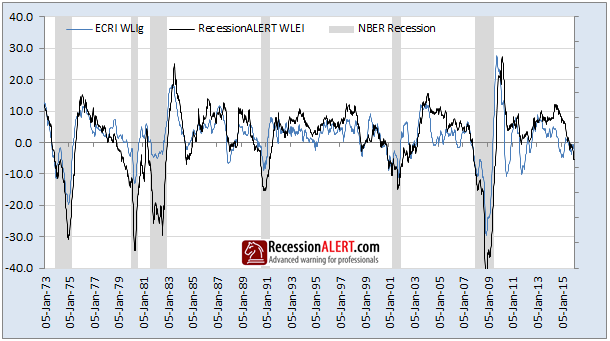
RecessionALERT.com has constructed a Weekly Leading Economic Index (WLEI) for the U.S Economy that draws from over 50 time-series from the following broad categories – Corporate Bond Market Composite, Treasury Bond Market Composite, Stock Market Composite, Labor Market Composite, and Credit Market Composite. From the authors of the index:
Leading Indicators Conclusion: mixed but not indicating a recession over the next six months.
- Chemical Activity Barometer (CAB) growth rate is average for times of economic expansion and its rate of growth is accelerating.
- ECRI’s WLI is forecasting weak growth in the business cycle six months from today and is currently plateaued.
- The Conference Board (LEI) 6 month rolling average is indicating an slowing rate of growth over the next 6 months and is near recession warning zone.
- The Philly Fed’s Leading Index continues to forecast growth but remains in a long term downtrend even though it marginally turned up this month.
- The Econintersect Economic Index is showing weakening growth.
- RecessionAlert’s Weekly Leading Economic Index is currently plateaued.
include(“/home/aleta/public_html/files/ad_openx.htm”); ?>


![[click on graphic to enlarge]](https://econintersect.com/images/z%20philly%20fed%20leading.PNG)