
by Doug Short / Jill Mislinski, Advisor Perspectives/dshort.com
The University of Michigan Final Consumer Sentiment for September came in at 91.2, up slightly from the Preliminary reading. Investing.com had forecast 90.0.

Surveys of Consumers chief economist, Richard Curtin makes the following comments:
Confidence edged upward in September due to gains among higher income households, while the Sentiment Index among households with incomes under $75,000 has remained at exactly the same level for the third consecutive month. Importantly, the data provide no evidence of an upward trend as the average level of the Sentiment Index since the start of 2016 is nearly identical with the September level (91.4 versus 91.2). All of the September gains were concentrated in the Expectations Index, while assessments of current economic conditions were slightly less favorable. Fewer reports of recent income gains were counterbalanced by an uptick in income gains expected during the year ahead. The larger recent gains among upper income households was partly due to continued declines in their inflation expectations. Buying plans edged downward mainly due to the declining availability of price discounts. Real personal consumption expenditures can be expected to increase by 2.7% through mid 2017.
See the chart below for a long-term perspective on this widely watched indicator. Recessions and real GDP are included to help us evaluate the correlation between the Michigan Consumer Sentiment Index and the broader economy.
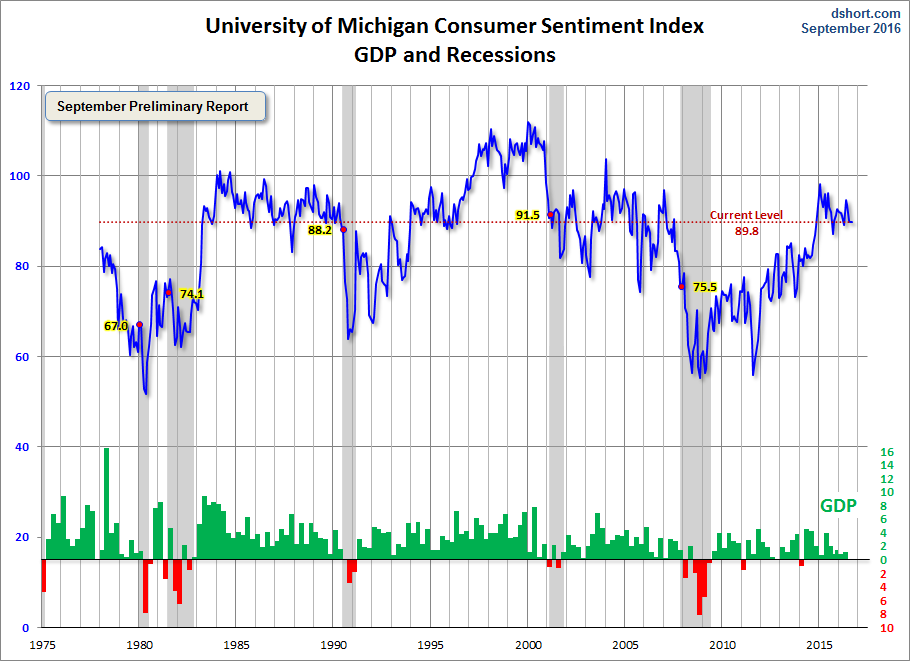
To put today’s report into the larger historical context since its beginning in 1978, consumer sentiment is 5.1 percent above the average reading (arithmetic mean) and 6.4 percent above the geometric mean. The current index level is at the 53rd percentile of the 465 monthly data points in this series.
The Michigan average since its inception is 85.4. During non-recessionary years the average is 87.6. The average during the five recessions is 69.3. So the latest sentiment number puts us 21.9 points above the average recession mindset and 3.6 points above the non-recession average.
Note that this indicator is somewhat volatile, with a 3.0 point absolute average monthly change. The latest data point saw a 1.4 change from the previous month. For a visual sense of the volatility, here is a chart with the monthly data and a three-month moving average.

For the sake of comparison, here is a chart of the Conference Board’s Consumer Confidence Index (monthly update here). The Conference Board Index is the more volatile of the two, but the broad pattern and general trends have been remarkably similar to the Michigan Index.

And finally, the prevailing mood of the Michigan survey is also similar to the mood of small business owners, as captured by the NFIB Business Optimism Index (monthly update here).

The general trend in the Michigan Sentiment Index since the Financial Crisis lows has been one of slow improvement.The survey findings since December 2015 saw gradual decline followed by a bounceback later in the year, with January 2015 remaining the interim peak.
Caveats on the Use of University of Michigan Consumer Sentiment
This survey is quantitatively derived from a fairly complex questionnaire (sample here) via a monthly telephone survey. According to Bloomberg:
This release is frequently released early. It can come out as early as 9:55am EST. The official release time is 10:00. Base year 1966=100. A survey of consumer attitudes concerning both the present situation as well as expectations regarding economic conditions conducted by the University of Michigan. For the preliminary release approximately three hundred consumers are surveyed while five hundred are interviewed for the final figure. The level of consumer sentiment is related to the strength of consumer spending. Please note that this report is released twice per month. The first is a preliminary figure while the second is the final (revised) figure.
This is a survey, a quantification of opinion rather than facts and data. The question – does sentiment lead or truly correlate to any economic activity? Since 1990, there seems to be a loose general correlation to real household income growth.

include(“/home/aleta/public_html/files/ad_openx.htm”); ?>


