 The Chicago Business Barometer which recently has spent more time in contraction than expansion, strengthened and remained in expansion. This survey came in above expectations.
Analyst Opinion of Chicago PMI
The results of this survey continue to mirror the district Federal Reserve surveys – all came with some better values (even those still in contraction). The surprise was that the Chicago PMI employment component came in weak after coming in strong last month. Still, employment survey results seem never to match the employment data.
From Bloomberg, the market expected the index between 50.9 to 53.5 (consensus 52.0) versus the actual at 54.2. A number below 50 indicates contraction. Lorena Castellanos, senior economist at MNI Indicators stated,
Economic growth in the US appears to have picked up a little at the end of the third quarter and although the Employment component fell, this was on the back of a relatively strong showing in the previous month. Note Employment usually lags changes in orders and output, so it was not that surprising to see this component weakening in September
The MNI Chicago Business Barometer increased 2.7 points to 54.2 in September from 51.5 in August, recovering most of lost ground experienced in the previous month.
On a trend basis, the MNI Chicago Report paints a slightly better picture than earlier in the year with the Barometer averaging 53.8 in Q3, up from 52.2 in Q2 and the highest quarterly level since Q4 2014.
The latest increase was driven by a sharp gain in Production, which rose 7.3 points to 59.8, the highest since January 2016. New Orders and Order Backlogs, which led the Barometer’s decline last month, were little changed in September, with the latter failing to bounce back above the 50 breakeven level. Employment was the only Barometer component that fell, having rallied to a 16-month high in August.

z chicago pmi.png
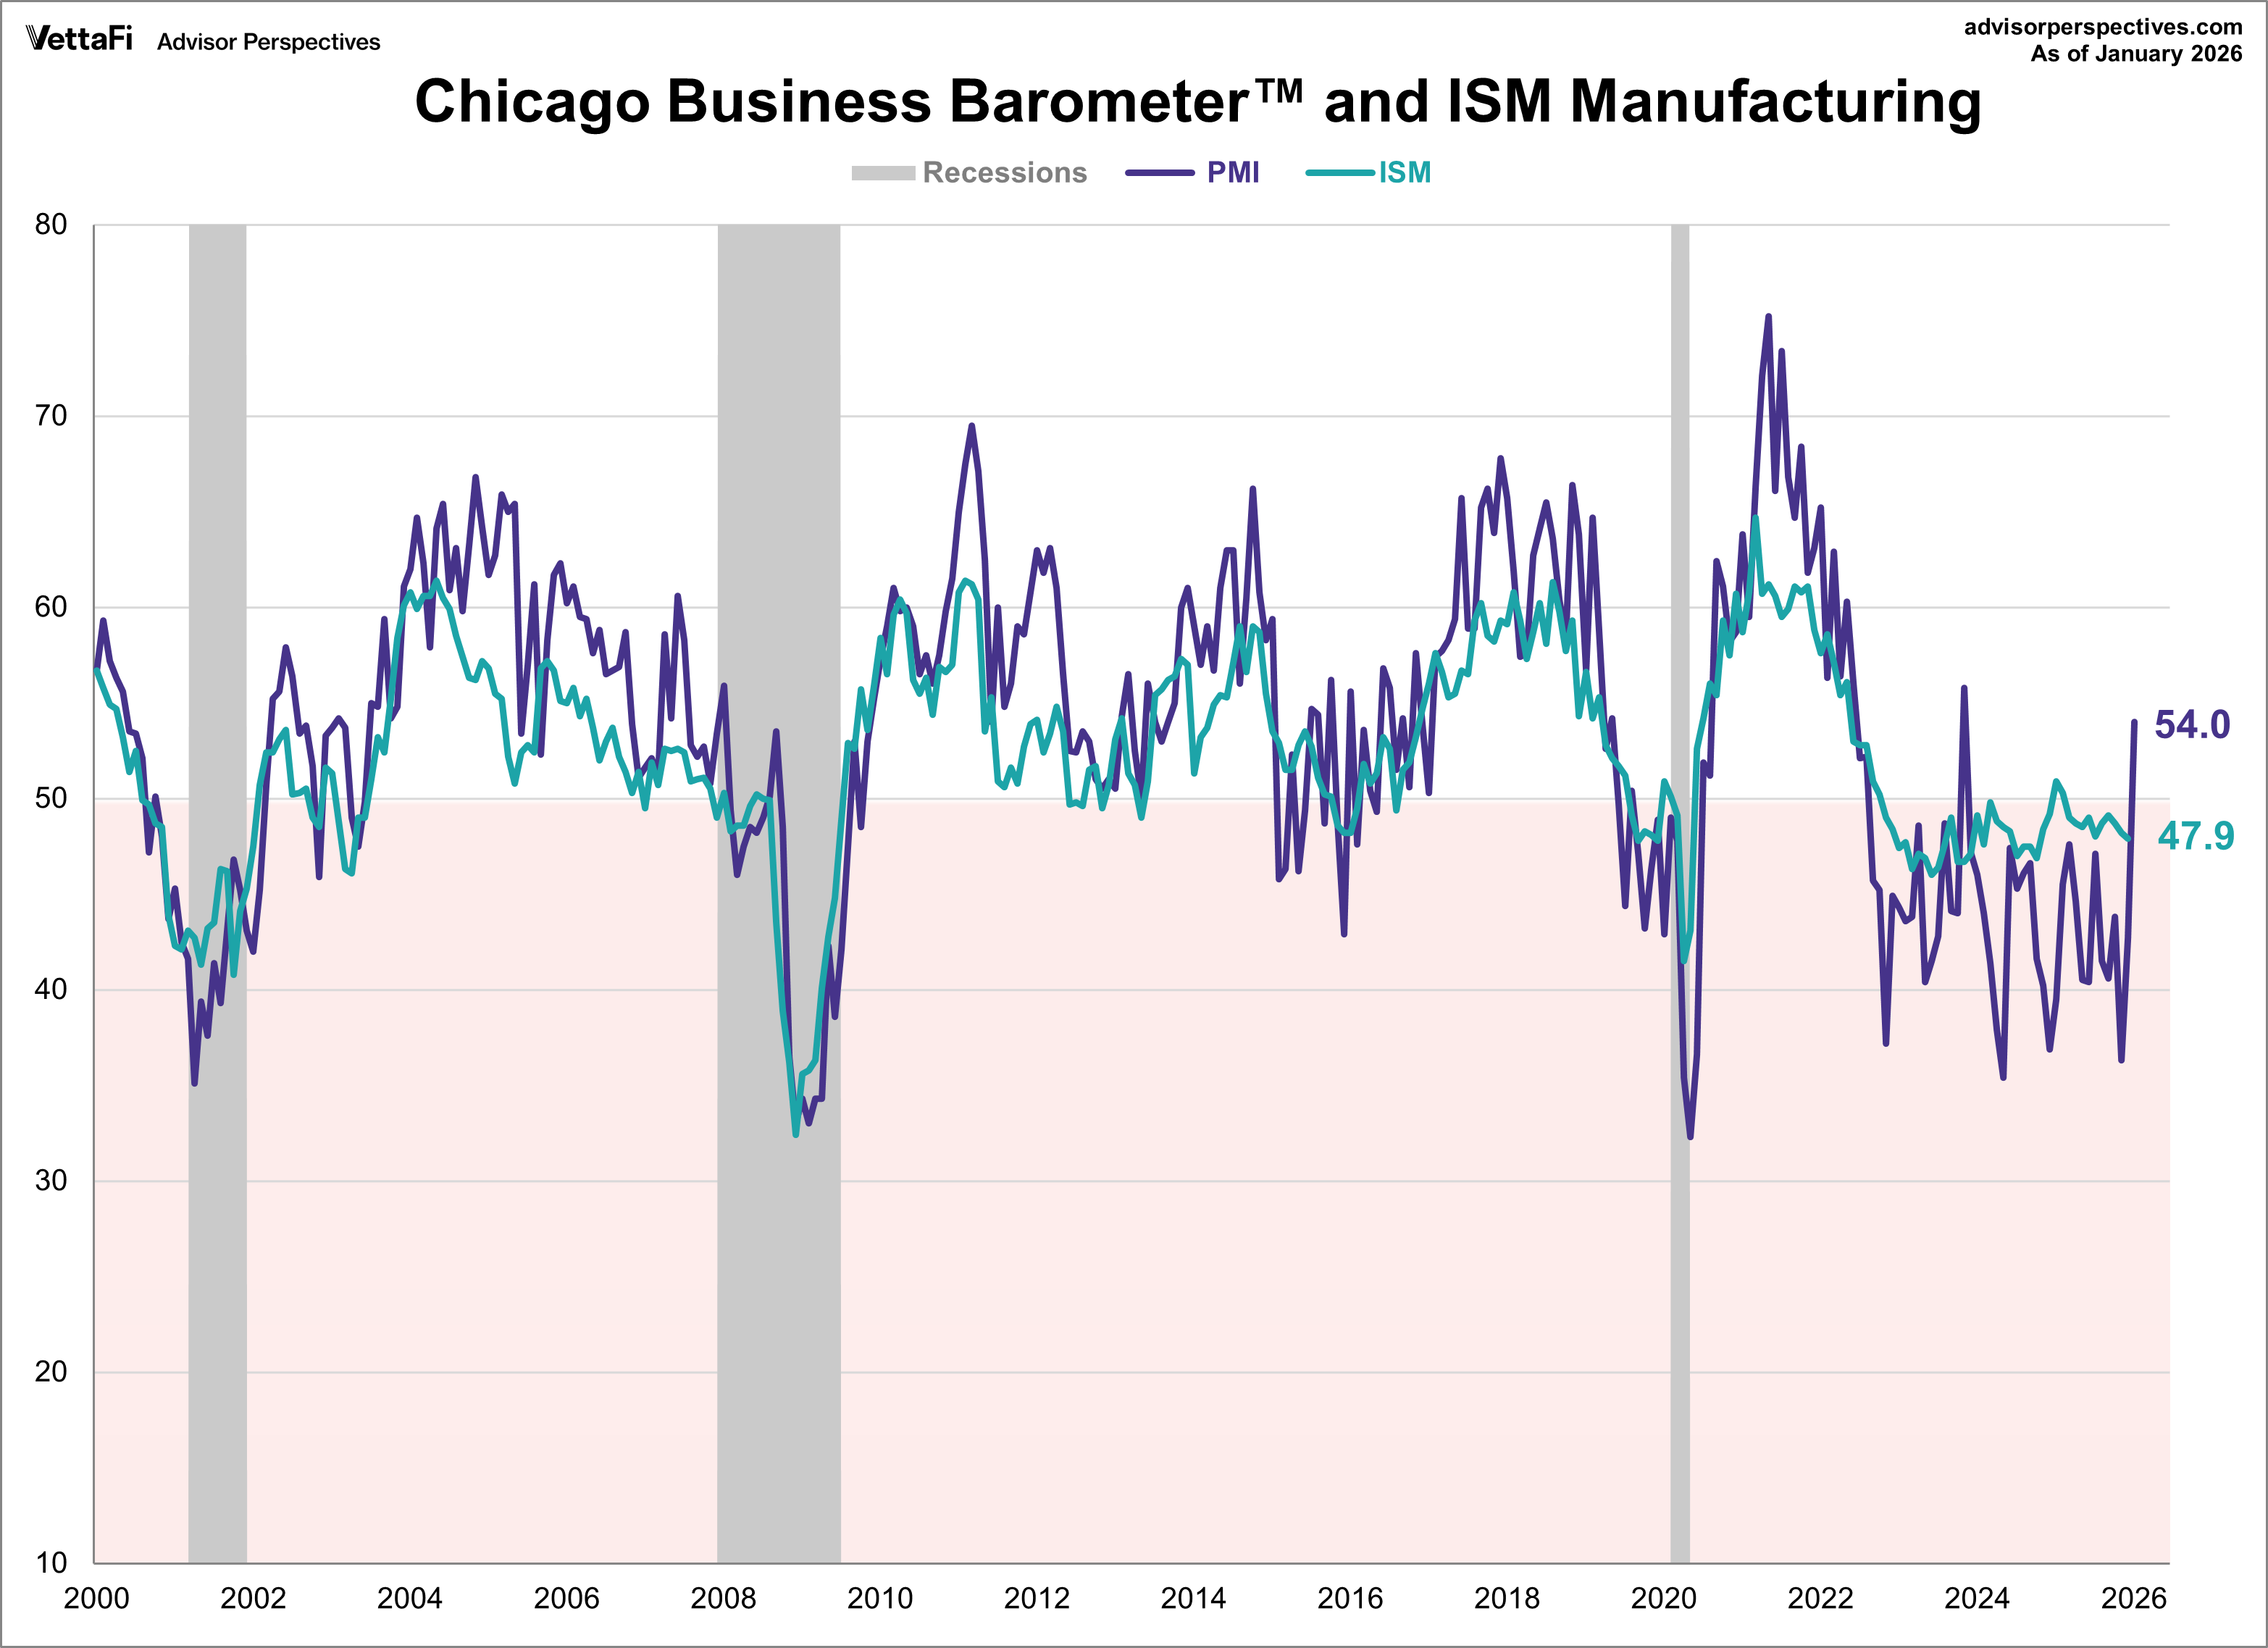
The Chicago ISM is important as it is a window into the national ISM reports which will be issued shortly. When you compare the graph below of the ISM Manufacturing Index against the Chicago PMI (graph above) – there is a general correlation in trends, but not necessarily correlation in values.
source and read the full report: Chicago PMI
include(“/home/aleta/public_html/files/ad_openx.htm”); ?>


