by Peter Krauth, Money Morning
Special Report from Money Morning
Although the price of gold today (Friday, Jan. 6) is down 0.5% to $1,175 this morning, the biggest story for gold recently is its 2016 rebound.
In fact, gold prices are coming off their first annual gain in three years.

In our update just before the holidays, we considered the possibility that – with gold trading down below the $1,130 level – maybe sentiment had become sufficiently negative for at least an interim bottom.
Today, I’m going to take some time to review gold prices in 2016 – and what last year’s performance may mean for gold prices in 2017.
Let’s start with this chart here…
How the Price of Gold Performed in 2016
When looking at the gold price in U.S. dollars, the precious metal gained roughly 9% in 2016. While that may seem unimpressive to some, it’s still gold’s first annual gain since 2012.
That’s right. After three straight years of declines, the price of gold has finally turned around.
Admittedly, the 2016 gold price chart isn’t all that pretty, but it doesn’t change the fact that it was an up year…
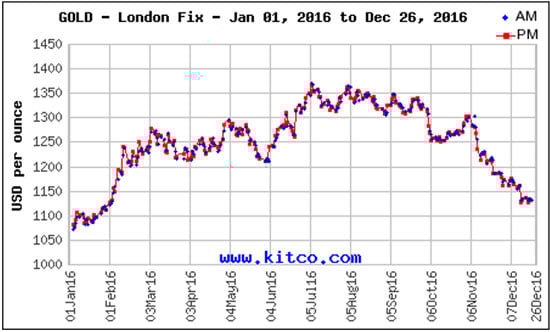
And so far, we’ve managed to remain clearly above the correction lows of $1,060 in December 2015.
Most of the 2016 gold price rally can be attributed to its performance in the first half of 2016. Thanks to the stunning Brexit vote and the Fed’s caution about raising interest rates, the price of gold soared to a two-year high of $1,369 by July.
From there, gold prices entered a correction. The metal declined 17.2% from July to December.
But gold seems to have bottomed in the past two weeks, testing levels just below $1,130. In our Dec. 16 update, we pointed out that the December 2015 interest rate hike caused gold prices to bottom out. We’ve been waiting since last month’s rate hike to see if history would repeat itself.
Since then, the price of gold’s momentum has been impressive, closing at a five-week high of $1,181 on Jan. 5. The gains even came against the hawkish tone presented by the Fed minutes released on Jan. 4.
On this six-month chart below, we not only see the recent bottom, but we also see positive trends in both the RSI and MACD – two indicators of strength in the gold market. These trends have been moving higher despite the downward trending 50-day moving average in the gold price.
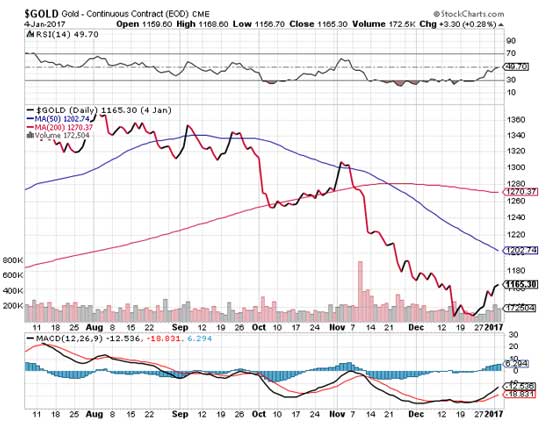
What precipitated the change in direction for the price of gold? I think the most likely culprit was a topping out of the U.S. Dollar Index (DXY). Gold’s low reached on Dec. 15 matched the point at which the dollar peaked near 103 basis points. And just like in 2015, the gold price low came the very day after the Fed announced a rate hike.
Maybe, just maybe, history is repeating…
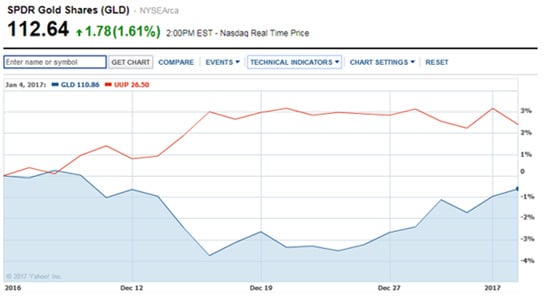
In the chart above, the blue line represents the SPDR Gold Trust ETF (NYSE Arca: GLD) – which follows the price of gold – and the red line represents PowerShares U.S. Dollar Index (NYSE Arca: UUP) – which follows the dollar. It seems as though gold was sensing the dollar’s run was getting tired and pounced on that weakness. In other words, it was a case of “sell the rumor, buy the news“.
The dollar topped at 103.82 on Jan. 3 – the first trading day of 2017 – and pulled what now looks like a head fake. By Thursday, Jan. 5, the DXY was more than 250 basis points lower, trading as low as 101.3 by midday.
While the U.S. Dollar Index is showing signs of topping or at least tiring, there are three other factors that will fuel the gold price rally in 2017.
Here’s our specific gold price target for the second half of the year…
Where the Price of Gold Will Be by the Second Half of 2017
Gold prices will reach $1,400 by the third quarter – a gain of 19.1% from today’s price of $1,175. And there are three reasons why we’re confident in that price target.
The first reason is rising inflation. High bond yields indicate rising inflation, and yields are at their highest in over two years. Since mid-December, the 10-Year Treasury yield has hovered near 2.5% – the highest since September 2015. Gold is typically a safe-haven investment, meaning more investors will buy it to protect their portfolios from the negative effects of inflation.
The second reason behind the 2017 gold price rally is India – the world’s largest gold importer. The Indian government is considering slashing gold import taxes from 10% to 6%. The idea is to discourage the smuggling of gold into the country, which had swelled since the government had raised duties earlier in 2016. Although many speculate the government might limit the number of gold imports, a cut in import taxes would incentivize citizens to buy more gold. This would boost global gold prices regardless of import restrictions.
And the third factor is a possible surge in buying from the Islamic community. Several weeks ago, I told you that Bahrain’s Accounting and Auditing Organization for Islamic Financial Institutions was about to provide guidelines for metals investments. These guidelines would comply with Sharia law. With those guidelines now released, Islamic buyers can more easily invest in the precious metals arena. And that could mean a lot of buying from a group with a historical affinity to gold.
With all these positive factors at play, $1,400 gold in 2017 is looking a whole lot more attainable.


