by Callum Thomas, Topdown Charts
The Chart Storm is a weekly selection of 10 charts which I hand pick from around the web (+some of my own charts), and then post on Twitter.
The charts focus on the S&P500 (US equities); and the various forces and factors that influence the outlook – with the aim of bringing insight and perspective.
Hope you enjoy!

Please share this article – Go to very top of page, right hand side, for social media buttons.
1. Boing! Say what you want about the 50-day moving average, it seems to have held the line fairly well so far during this short sharp selloff (as it normally would during a strong uptrend/bull market).
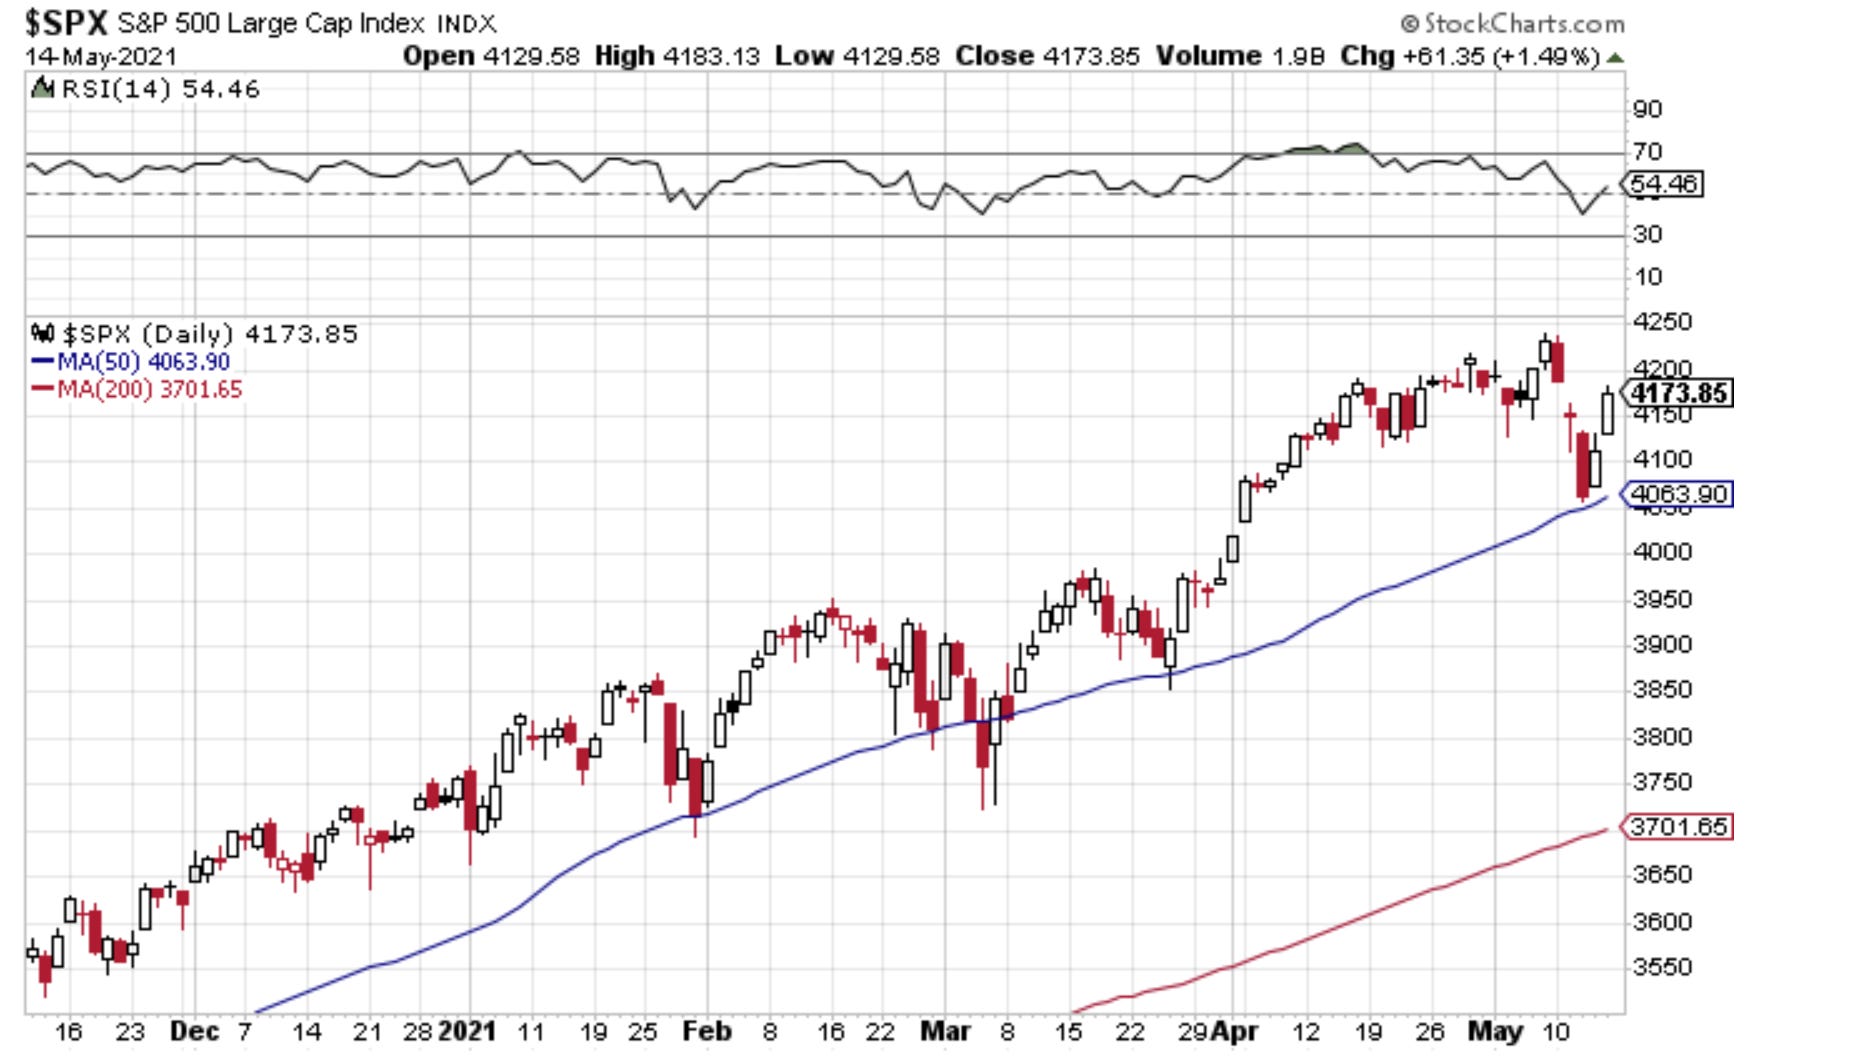
Source: @Callum_Thomas
2. 50-day Moving Average Breadth: Since we’re looking at the 50dma, here’s the proportion of S&P500 stocks trading above their respective 50-day averages. The curious point I noted was how the indicator bounced off my arbitrarily drawn uptrend line. Back to business?
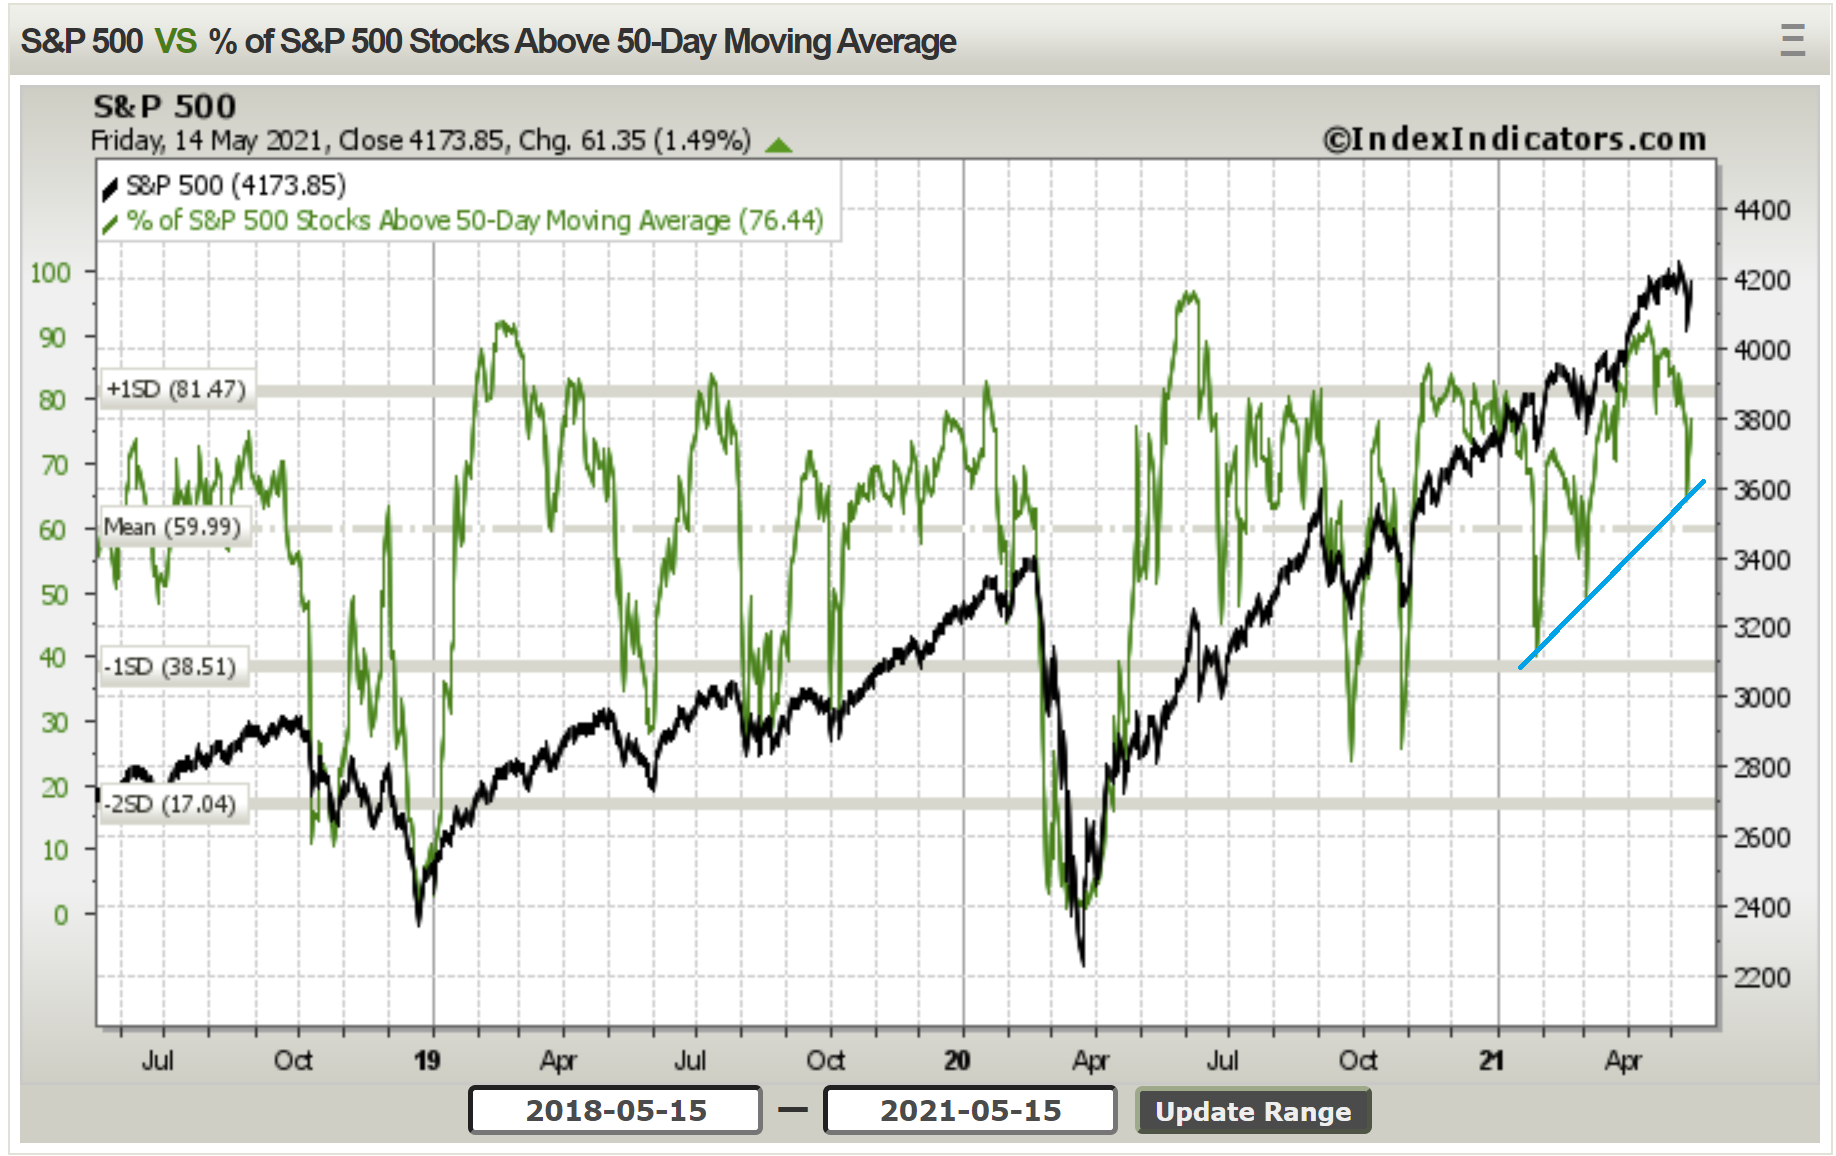
Source: @Callum_Thomas
3. NYSE New Highs: The author of this chart, Tom McClellan noted (before the selloff):
“Such spikes can mark short term exhaustion events, but ‘major’ price tops usually see a divergence in the NH numbers.”
And behold, as seen in the previous two charts, we got a short sharp selloff.
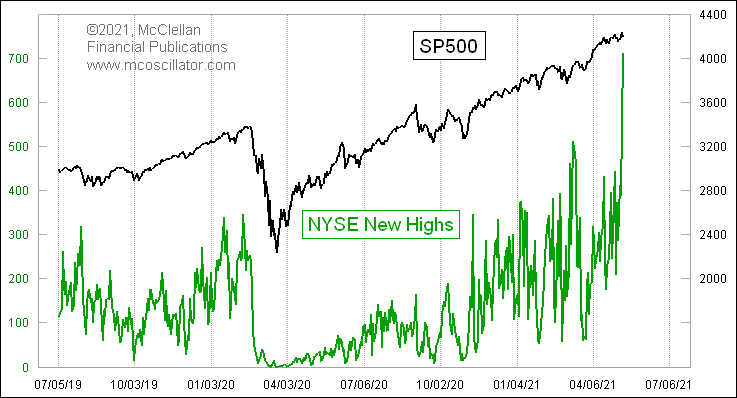
Source: @McClellanOsc
4. Tech Flows: After a flurry of inflows, tech now seeing some outflows…
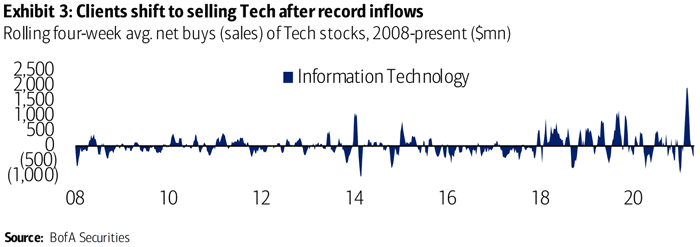
Source: @ISABELNET_SA
5. Tech Flows and Implied Allocations: This one shows a similar dynamic in flows (waning interest), but more interesting to me is the ETF market share of Tech funds – we can think of this like an “implied allocation“ by investors to this sector – to that end, allocations have gone from like 13% to 30%. Excessive? Perhaps. Rolling over? Looks like it…
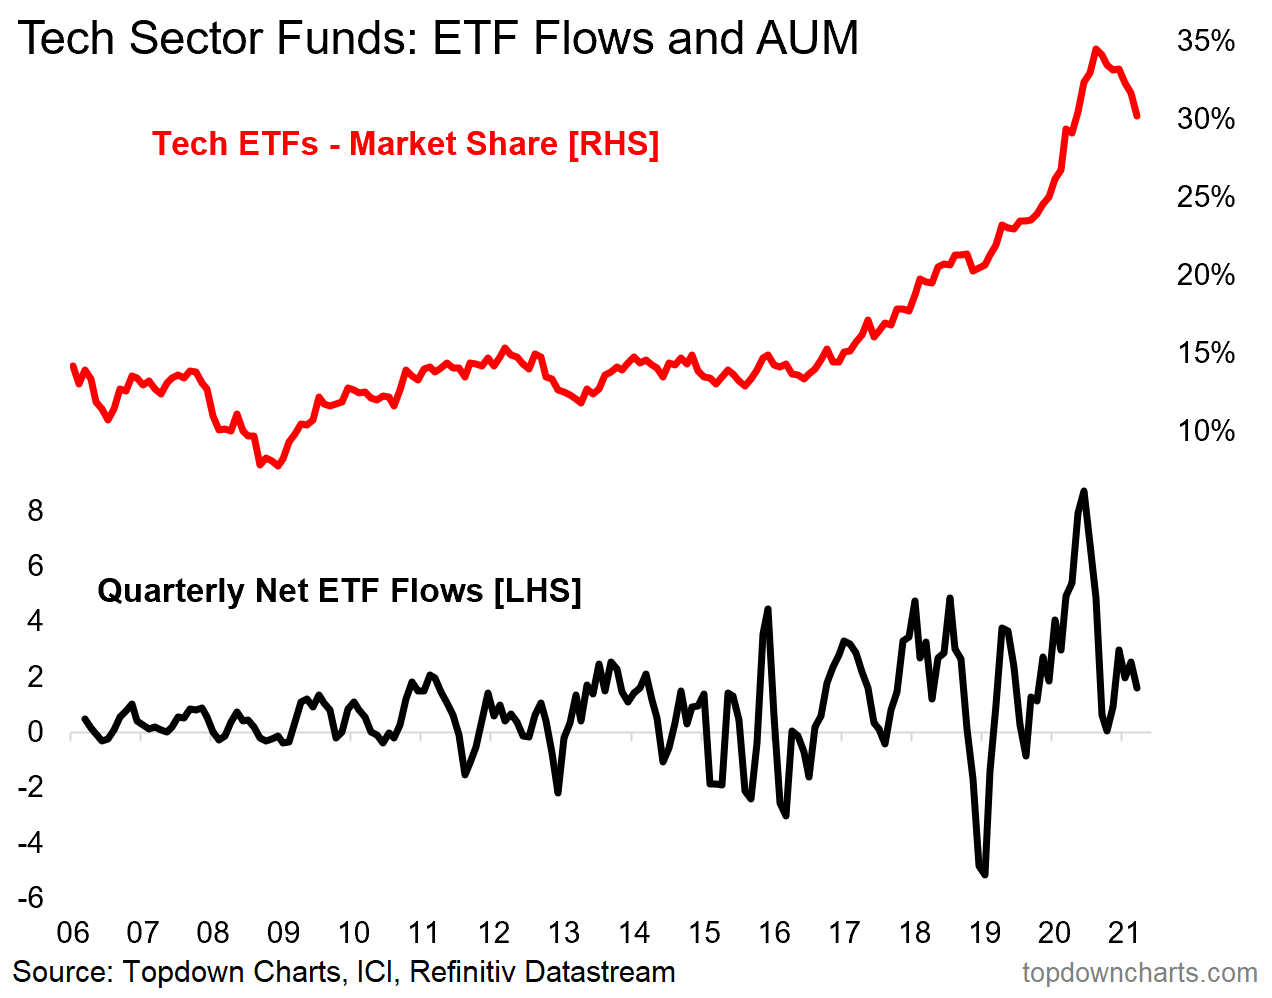
Source: @topdowncharts
6. Tech = Toast? In many ways this one probably helps explain the previous couple of charts – tech stocks have been underperforming in relative terms (flows tend to follow performance). Aside from that it really sticks out from a technical standpoint. And tech also faces very high starting point valuations, and some regulatory uncertainty… time for tech to pass the torch I think.
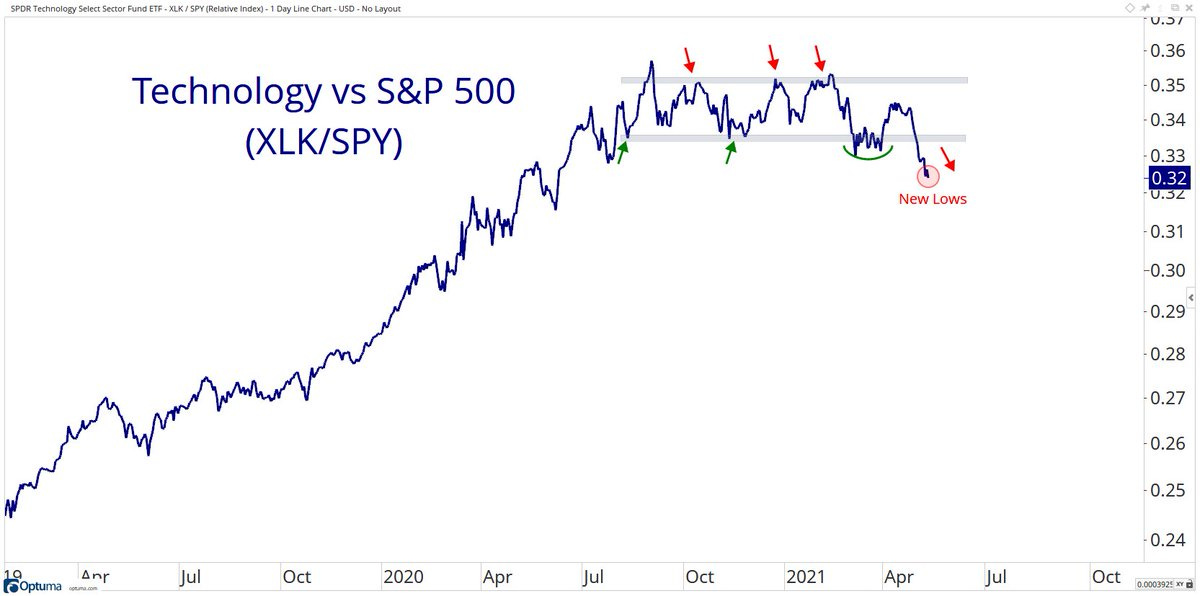
Source: @granthawkridge
7. Buybacks Back: We could talk about how firms seem to be averse to investing in risky, long-runway capex projects, but are happy to chase short term gains by repurchasing their stock… but no. What we will mention is how this is an interesting flows dynamic at the very least: i.e. a source of buying demand.
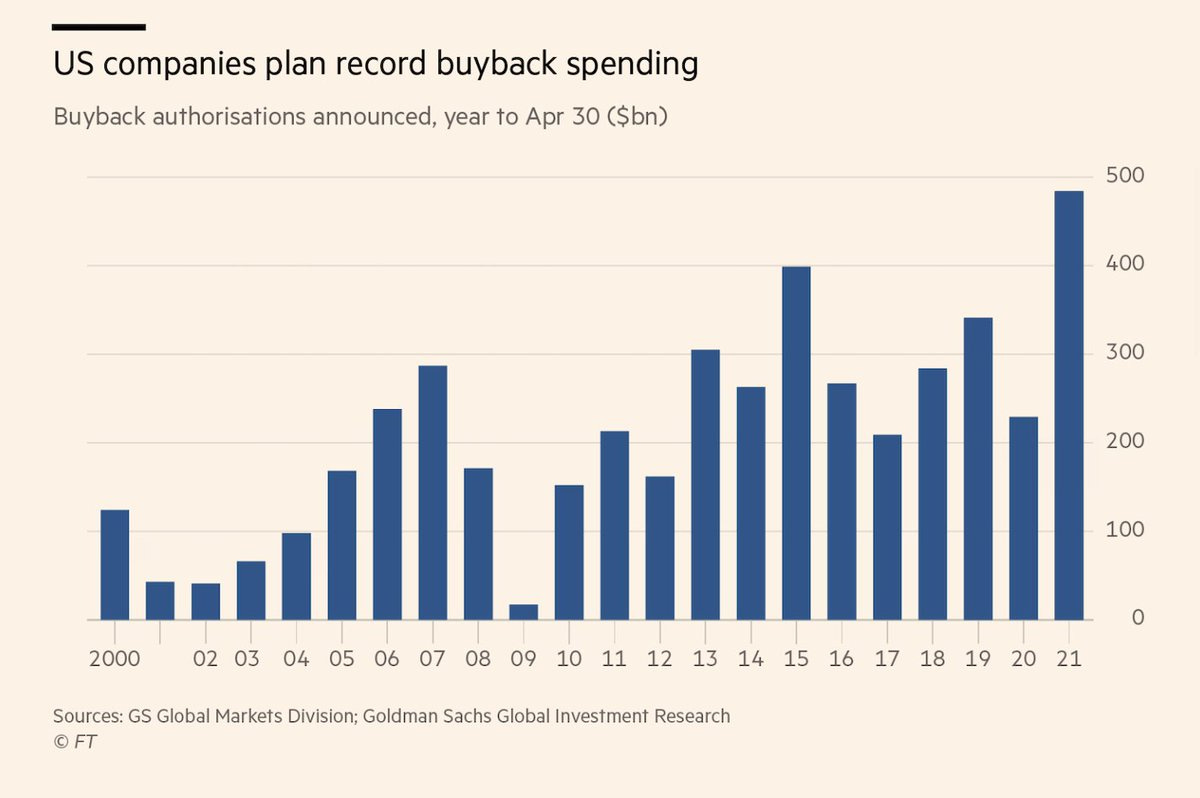
Source: @acemaxx
8. Valuations vs Returns: Longer term, elevated valuations have sealed the fate of investors. And so I asked somewhat rhetorically: growth is good, but growth at any price…?
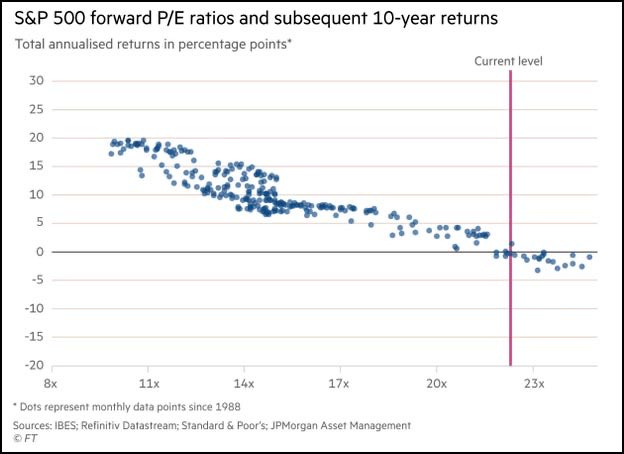
Source: @MichaelaArouet & @FT
9. Value vs Growth Exposure by Country: Interesting sense for which countries are more “growthy” – mostly as you would expect…
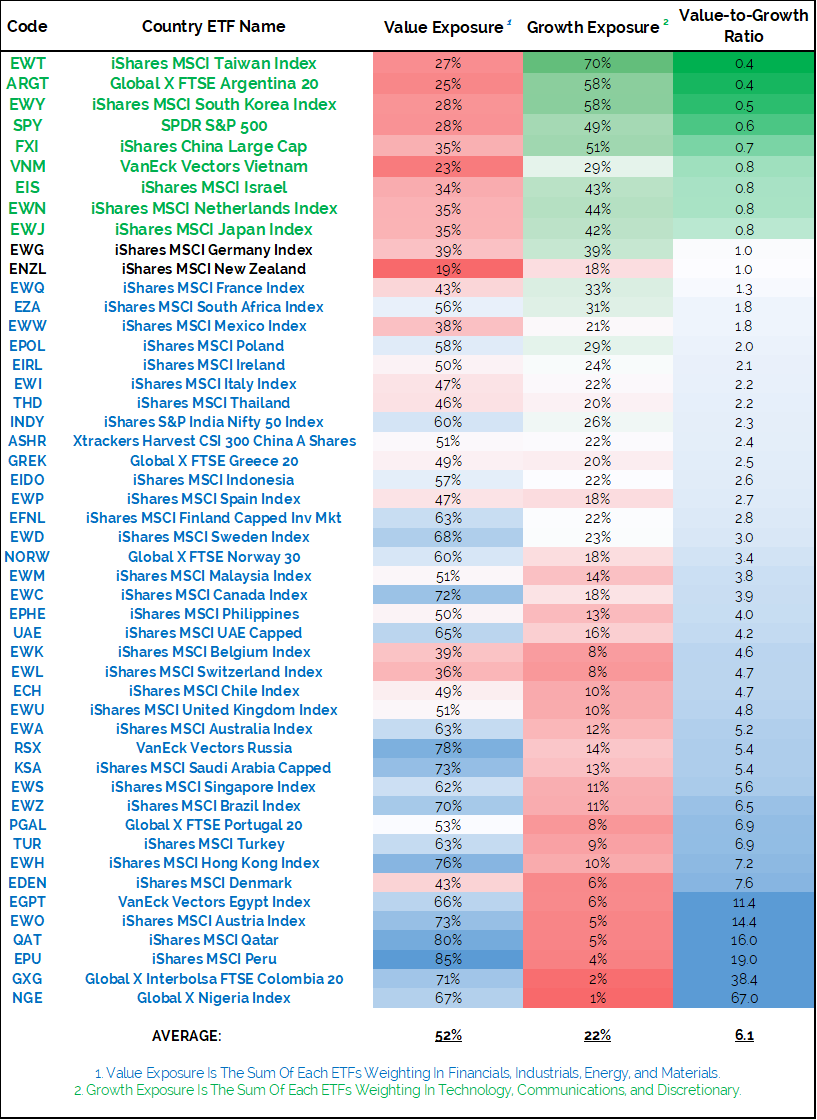
Source: @allstarcharts @sstrazza
10. Stocks vs Commodities: This chart shows the astronomical outperformance of equities vs commodities, and given the interesting evolving macro/market environment, I simply tweeted the following:
Stocks = significantly overvalued
Commodities = facing prospective supercycle
Place your bets?
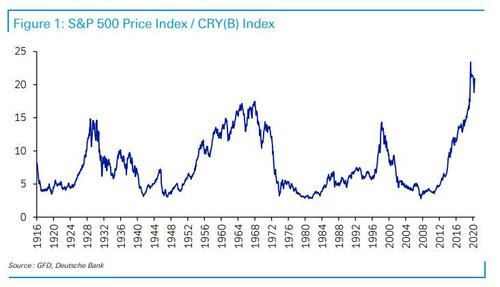
Source: @zerohedge
Thanks for following, I appreciate your interest!
oh… that’s right, almost forgot!
BONUS CHART
The Search For Yield: This chart aggregates the assets under management of yield or income focused ETFs. It includes just about everything under the yield sun, and as you might guess it’s tracking around all time highs.
With cash rates at zero percent, those who saved for retirement hoping to earn 6% on their bank deposit have been severely disappointed by the low (or even negative in some places) interest rate environment.
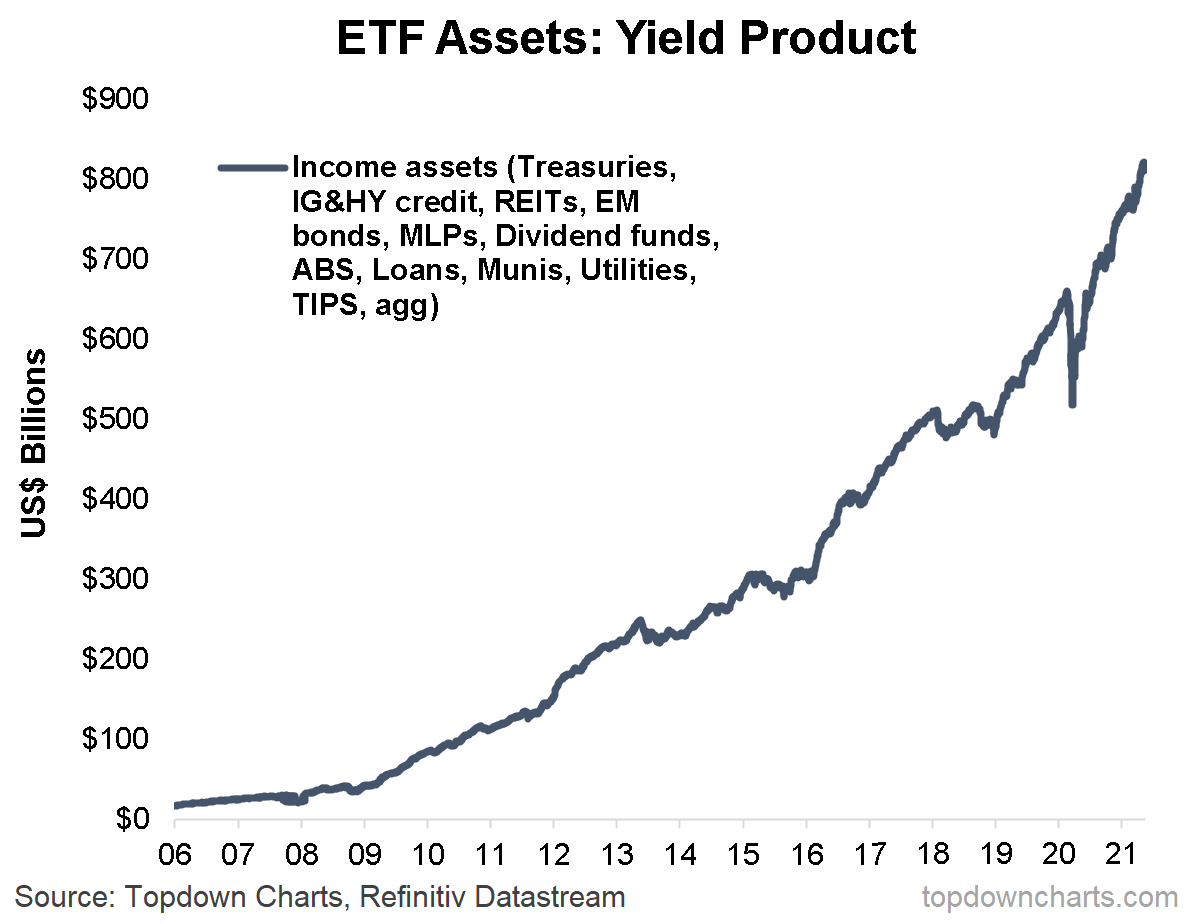
Those with term deposits rolling over face the option of taking 0% (or very close to it), and at least know it’s safe. But otherwise they need to push further out the curve to get the yield they need: longer duration, higher credit risk, equity market risk, currency risk, commodity risk, tenancy risk, regulatory risk…
Not to mention the risk that inflation erodes the real value of their savings.
What other choice do they have?
It’s either eat your savings or take on more risk.
We are all yolo investors now.
.


