Written by Lance Roberts, Clarity Financial
Extreme Deviations & Eventual Outcomes
This article was written Tuesday 21 January. It is being reposted now because its value in hindsight is almost greater than it was in real time.
The good news is that with the market closed yesterday, the extreme extensions of the market did not get any more extreme. Also, it doesn’t change our analysis much from this past weekend’s missive either:

Please share this article – Go to very top of page, right hand side, for social media buttons.
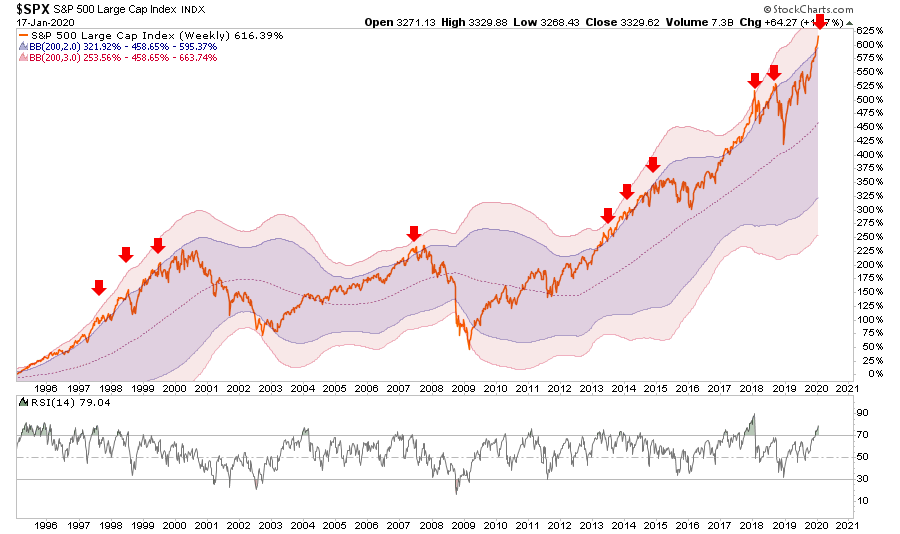
“This week, the market pushed those deviations even further as the S&P 500 has now pushed into 3-standard deviation territory above the 200-WEEK moving average. There have only been a few points over the last 25-years where such deviations from the long-term mean were prevalent. In every case, the extensions were met by a decline, sometimes mild, sometimes much more extreme.”
As we discussed, there is a potential the current “momentum” push, due to the Fed’s ongoing “NotQE,” which could drive markets higher in the short-term.
“With the Federal Reserve’s ongoing ‘Not QE,’ it is entirely possible the markets could continue their upward momentum towards S&P 3500, and Dow 30,000. Clearly, the ‘cat is out of the bag’ if CNBC even realizes it’s the Fed:
‘On Oct. 11, the central bank announced it would begin purchasing $60 billion of Treasury bills a month to keep control over short-term rates. The magnitude of the purchases resembles the quantitative easing program the Fed conducted during and after the financial crisis.’
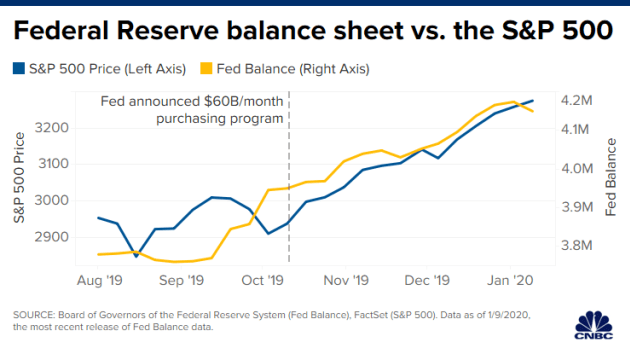
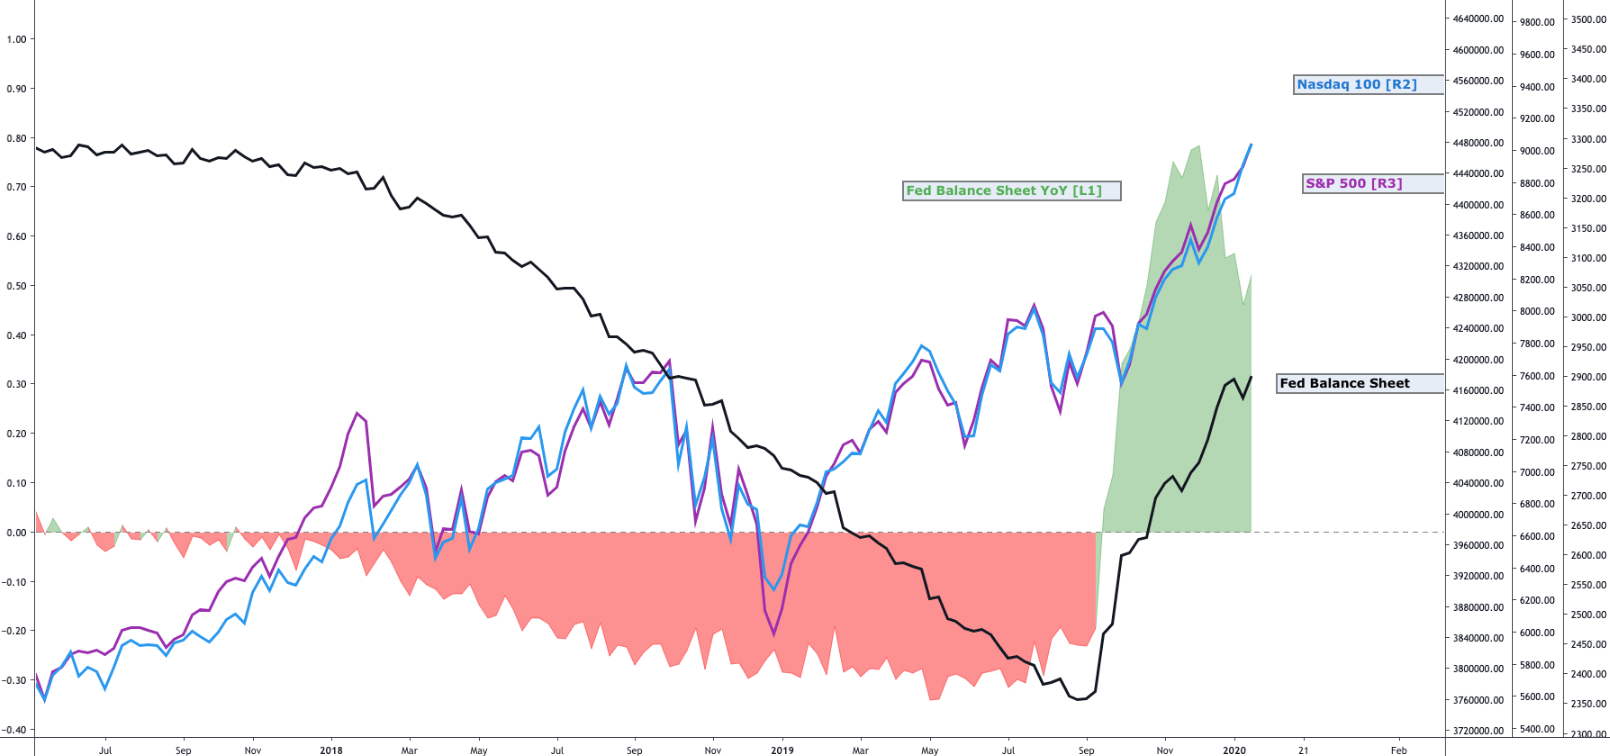
‘The increase in the Fed’s balance sheet has been in near lockstep with the stock market’s climb. The balance sheet has expanded 10% since October, while the S&P 500 shot up 12%, including notching its best fourth quarter since 2013.’”
There is much debate between the Fed, and their supporters, and virtually everyone else, about the implications of the Fed’s actions. The “Heisenberg Report” did a good job summing up our view on the issue:
“Neel Kashkari’s take is a bit different, as is Mary Daly’s. The whole ‘debate’ is somewhat silly. Both sides are being disingenuous. It’s not ‘QE.’ It probably will be, eventually, but for right now, the Fed isn’t buying coupons. And irrespective of any knock-on effects for risk assets, the overarching intent is to avoid another short-term funding squeeze by reestablishing an abundant reserves regime with a buffer. That, as opposed to a goal of compressing risk premia, driving investors out the risk curve and down the quality ladder to foster the wealth effect.
On the other hand, the idea that the distinction matters is a bit dubious. Regardless of what the overarching goal is, liquidity provision is liquidity provision and there’s a signaling effect too. Call it a ‘chart crime’ if you like, but I’d be more inclined to say that ‘it is what it is'”
He’s correct, and as he notes, even those sophisticated enough to be “short” something, are probably “net long” currently.
This is precisely our positioning, and why we discussed “taking profits” last week. While we are certainly not opposed to “shorting the market” to hedge our portfolio risk, the continued flood of liquidity by the Fed makes shorting a challenging proposition in the short-term. Therefore, our best option to reduce risk was to simply “ease back on the gas” by reducing position weights in the most egregiously “overbought” areas.
Most likely, this will be an exercise we repeat as long as the Fed is continuing to push liquidity into the market.
.
The Higher We Go…
At present, there is seemingly little to stop the markets from pressing higher, particularly once the push hits “rarefied air.” Weak fundamental and economic data is readily dismissed “hopes” those “soft spots,” will soon strengthen to catch up with price. More often than not, it is usually the opposite, which occurs.
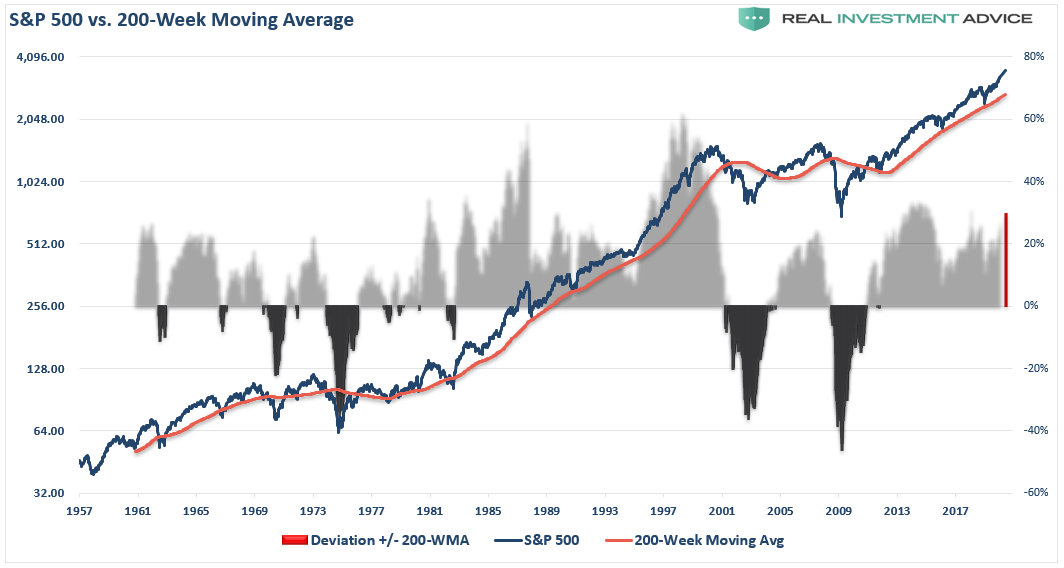
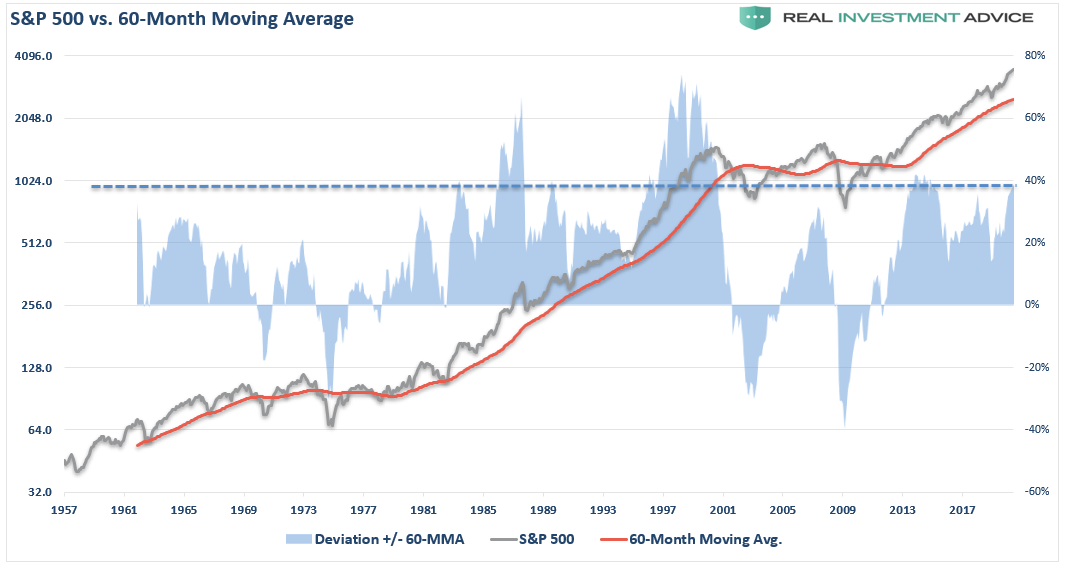
The chart below shows the S&P 500 index versus its 200-WEEK moving average and the historical percentage deviation between the two. The chart assumes the market will continue to push higher through the end of the “seasonally strong period,” and attain the 3500 level by June.
Historically, when the market becomes deviated from its 4-year (200-week) moving average by 20% or more, as it is currently, corrections have tended to follow. Some corrections were minor, such as the “Crash of 1987″, the “LTCM crisis” in 1988, or the 2015-2016 “Taper Tantrum.” Other corrections from such deviations were much more severe such as the “Crash of 1974″, the “Dot.com Bust”, or the “Financial Crisis” of 2008.
The same deviation mismatch can be seen in the 60-month (5-year) moving average. At 3500, the S&P 500 will achieve a deviation only seen 3-times prior, which preceded the “Crash of 1987″, the “Dot.com Bust,” and the 2015-2016 “Taper Tantrum.”
The defining aspect of whether corrections were “mild” or “severe” really came down to whether the valuations were expanding from “cheap to expensive,” or if they were “expensive heading towards cheap.” At 30x trailing reported 10-year average earnings, and price-to-sales above 2x (the highest level on record for the S&P 500), it is hard to suggest that valuations are cheap.
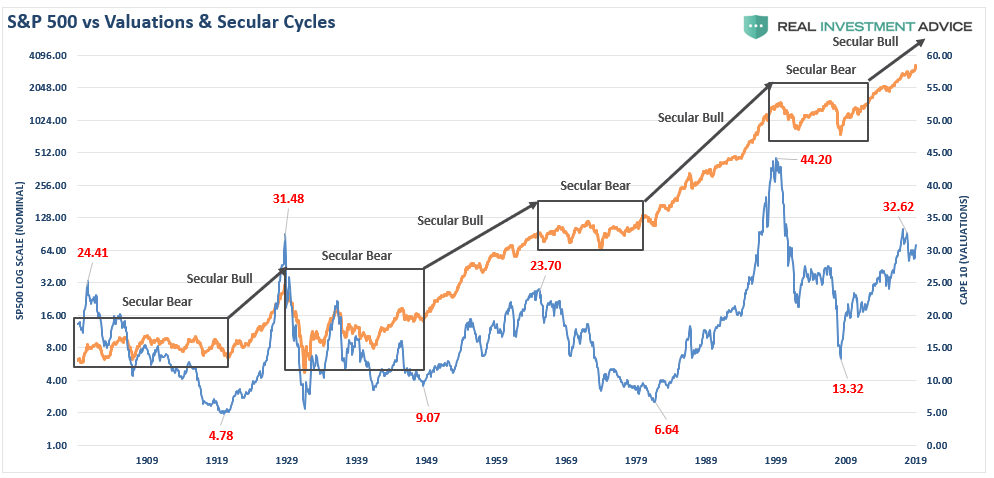
Our favorite way to look at the data is with our QUARTERLY analysis that combines both valuation, relative strength, and deviations into one chart.
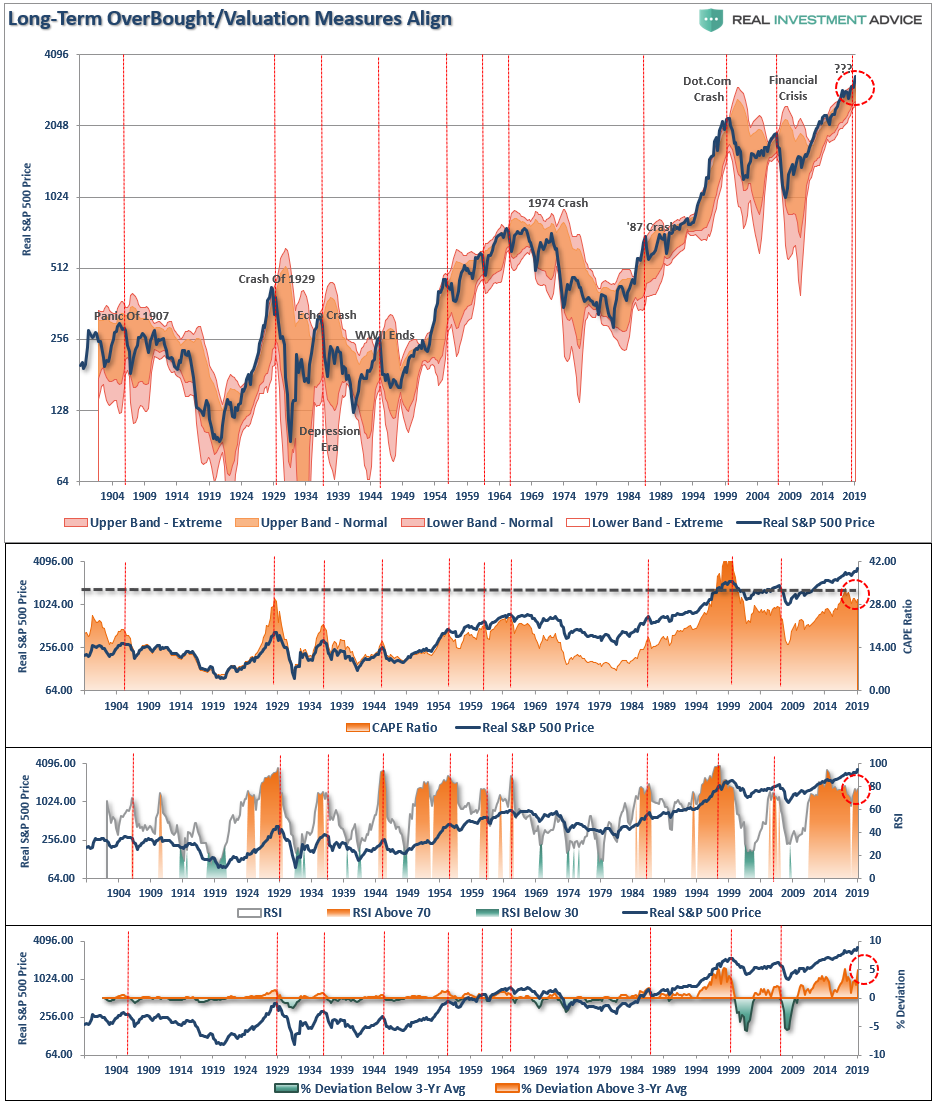
There is little to suggest that investors who are extremely “long equity risk” in portfolios currently won’t eventually suffer a more severe “mean reverting event.”
While valuations and long-term deviations suggest problems for the markets ahead, such can remain the case for quite sometime which always leads investors to believe “this time is different.” Because of the time required for long-term data to revert, monthly and quarterly data is more useful as a guide to manage allocations and longer-term exposures. In other words, this data is not useful as a short-term market-timing tool.
However, even the short-term data, has now reached more extreme technical levels which DO suggest caution. The chart below is our RIAPRO (Try 30-Days Risk Free) Technical Composite which combines short-term relative strength, momentum, and deviation into one indicator.
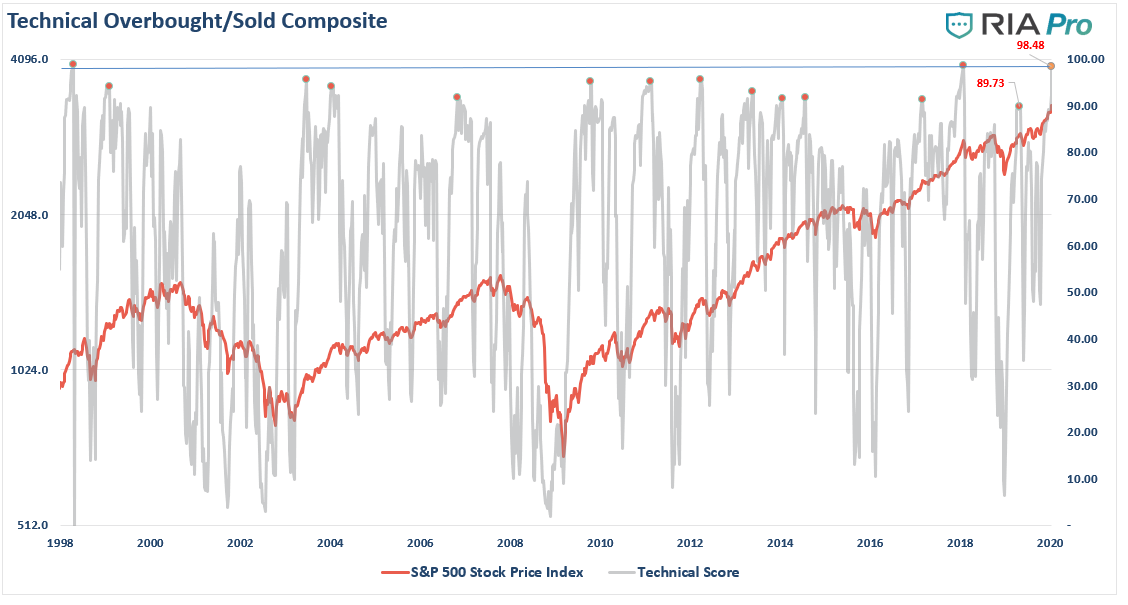
At 98.48, corrections from short-term market peaks tend not to be far off. In January of 2018, as the “tax cut” bill took effect, stocks were soaring in January pushing the technical composite to a similar level. It is worth remembering, the market dropped 10% heading into the first two weeks of February.
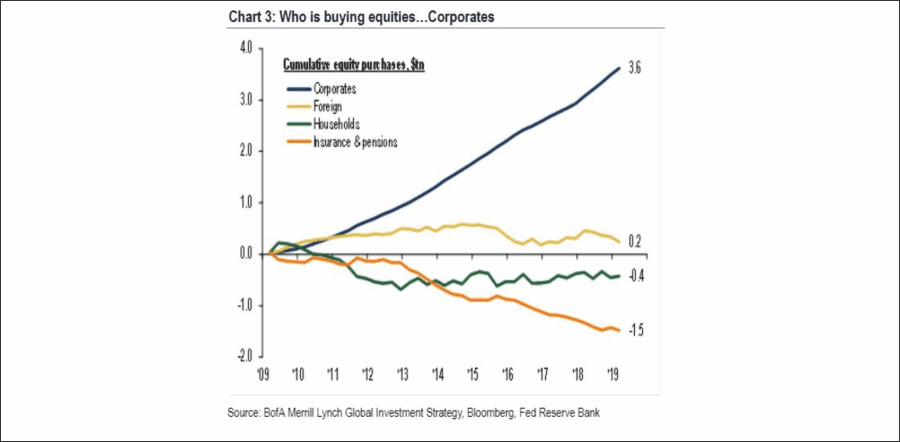
Currently, the market feels much like what we saw in early 2018, and a similar correction is likely in the short-term. However, longer-term it will be a reduction in corporate “share repurchases,” which will be a bigger factor in the sustainability of the market’s advance.
Clearly, the Federal Reserve is doing whatever it can to keep markets stable. With economic growth already fragile, a more serious correction in prices would collapse consumer confidence, lead to rising unemployment, and foster the onset of a full-blown recession. Such would be problematic for the Fed to counter, particularly if the trillions of dollars at play in leveraged hedge funds begin to lock up.
However, I agree with Wolf Richter’s recent comment.
In my decades of looking at the stock market, there has never been a better setup. Exuberance is pandemic and sky-high. And even after today’s dip, the S&P 500 is up nearly 29% for the year, and the Nasdaq 35%, despite lackluster growth in the global economy, where many of the S&P 500 companies are getting the majority of their revenues.
Mega-weight in the indices, Apple, is a good example: shares soared 84% in the year, though its revenues ticked up only 2%. This is not a growth story. This is an exuberance story where nothing that happens in reality – such as lacking revenue growth – matters, as we’re now told by enthusiastic crowds everywhere.
He’s right. The only period in history where we have seen a similar “set-up” was in 1999.
While we do realize this time “IS” different, we also know the “outcomes” will ultimately be the same. This is why we continue to look for opportunities to reduce risk, raise exposures to cash, and are ready to respond to market changes as they occur.
Yes, we are underperforming the market this year, but (to adapt a phrase from Popeye), we will gladly pay that price today for a “hamburger” tomorrow.
.


