Written by Lance Roberts, Clarity Financial
It only took eighteen-months longer than expected, but the markets finally reached 3000 on the S&P 500 index this past week.

Please share this article – Go to very top of page, right hand side, for social media buttons.
“What do you mean ‘expected?’ You are always bearish.”
I am just going to save our “reading impaired” individuals some time by reminding them of what I wrote in January of 2018:
“While the record-breaking pace is certainly breathtaking, it should not be surprising as we discussed in the June 9th, 2017 edition of the weekly newsletter.
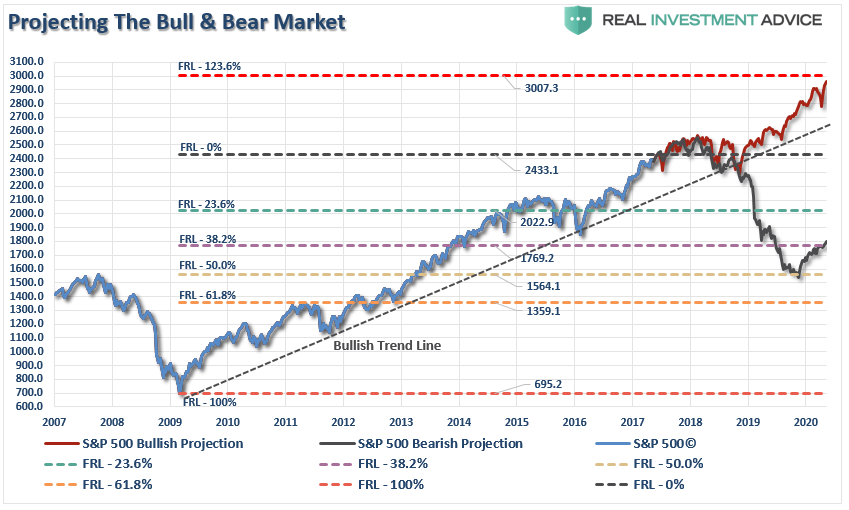
“Let me state this VERY clearly. The bullish bias is alive and well, and a move to 2500 to 3000 on the S&P 500 is viable.All that will be needed is some piece of legislative agenda from the current administration, which provides a positive surprise. However, without a sharp improvement in the underlying fundamental and economic backdrop soon, the risk of something going ‘wrong’ is rising markedly. The chart below shows the Fibonacci run to 3000 if ‘everything goes right.'”
Of course, that piece of legislative agenda was ‘tax reform.’
With investors now betting on a sharp rise in earnings to reduce the current levels of overvaluation, the seems to be little in the way of the next major milestones for 30,000 for the Dow and 3000 for the S&P 500.”
In March, we followed up that post stating:
“Since that time, tax cuts/reform have been passed, earnings estim+tes have exploded higher, and corporate stock buybacks have surged to record levels while wage growth has remained non-existent for the bottom 80% of workers.
Not surprisingly, with those tailwinds, the market has pushed sharply higher towards our original target of 3000.”
As we know now, the market wound up following our mid-2017 accelerated projection trend.

So, here we are 18-months later, and the market finally hit 3000.
What is interesting, however, is the advance to 3000 incorporated both the original bull and bear projections.
The 20% slide from the September highs came on concerns the Fed was tightening too aggressively as Trump’s “trade war” took a bite out of economic growth and profitability. The subsequent rally back, which brutally reminded investors what “volatility” is, was based on “hope” that Trump would find a resolution with China and the Fed would cut rates.
Neither has happened yet, but the markets remain hopeful.
“But you missed out on the whole rally because you have been all in cash.”
Again, for those that cannot read more than 280-characters at a time:
“Portfolios have remained allocated toward equities, although we did shift to more defensive holdings earlier this year. We had also been aggressive buyers of bonds at 3% and higher on the 10-year bond which has added to portfolio performance this year. “
The Bull & Bear Case
As we face down the last half of 2019, we can once again run some projections on the bull and bear case going into 2021, as shown in the chart below:

Let us break down both potential pathways into the “bull” and “bear” case. See articles:
.
include(“/home/aleta/public_html/files/ad_openx.htm”); ?>


