Written by Lance Roberts, Clarity Financial
I will readily admit that the recent rally over the last couple of weeks has certainly had me second guessing myself. I am human after all and am subject to the evils of emotional bias just as anyone is.

It is in times like these that I must force myself to re-focus on my discipline and strategy to manage portfolio risk effectively. But this does not mean that current analysis cannot be wrong. The financial markets are dynamic and evolving organisms. Events occur that impact markets in an unexpected manner. Therefore, analysis must also be dynamic and evolving in order to remain relevant. The shorter the time frame, the greater the impact the change in market dynamics will have on the accuracy of the analysis. This is why I tend to remain focused on weekly, monthly and quarterly data where evolutions in the markets have a much slower pace of impact to the accuracy of the analysis.
For example, earnings, which are announced quarterly, are one of the most important drivers of future stock market returns. I have addressed recently the ongoing deterioration in earnings and profits currently.
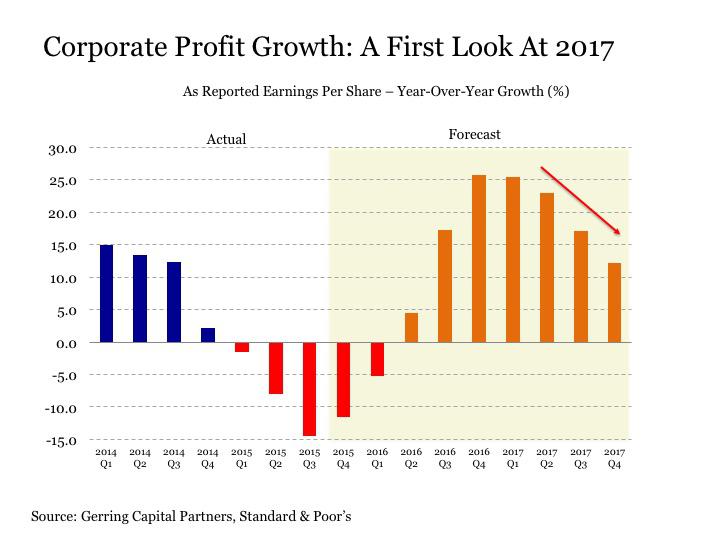
The importance of this cannot be dismissed. Since 1900, there have been 27 instances of EPS declines over a 2-quarter period. Historically speaking, such a rate of decline has coincided with a recession 81% of the time. The remaining 19% of the time, earnings re-accelerated for a short period due to short-term stimulus (either fiscal or monetary) which only temporarily delayed the onset of a recession.
The chart below shows the long-term history of earnings growth and the cyclical nature of earnings from 6% peak-to-peak growth to 5% trough-to-trough reversions. (I have provided where Goldman Sachs and Raymond James had predicted earnings to grow from 2014-2020 versus where we are currently.)
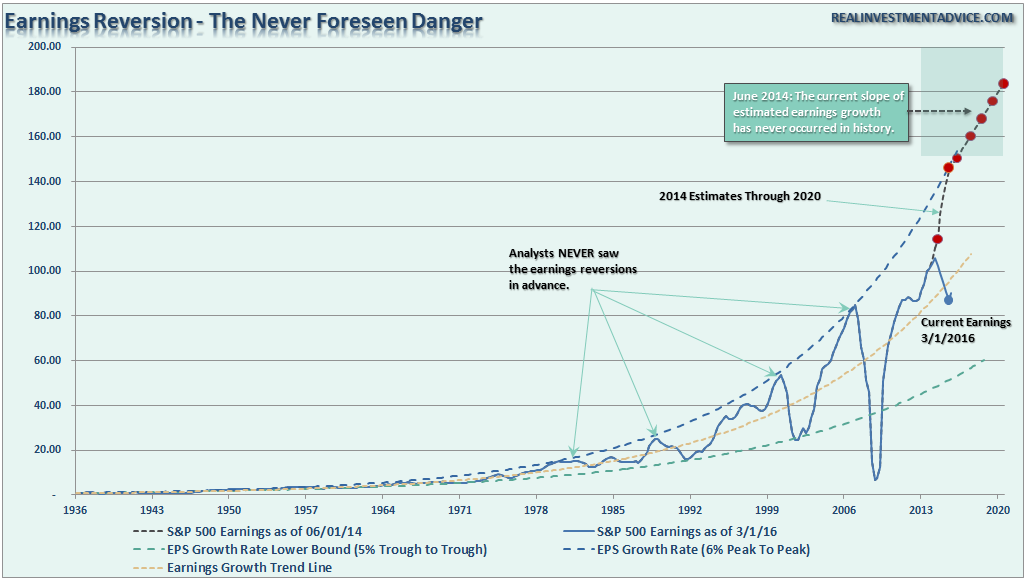
“Missed It By That Much.” – Maxwell Smart, Get Smart
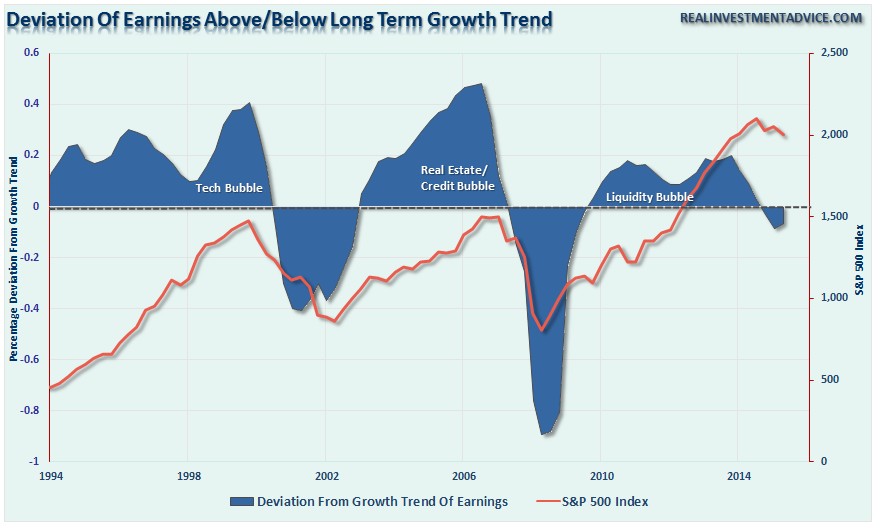
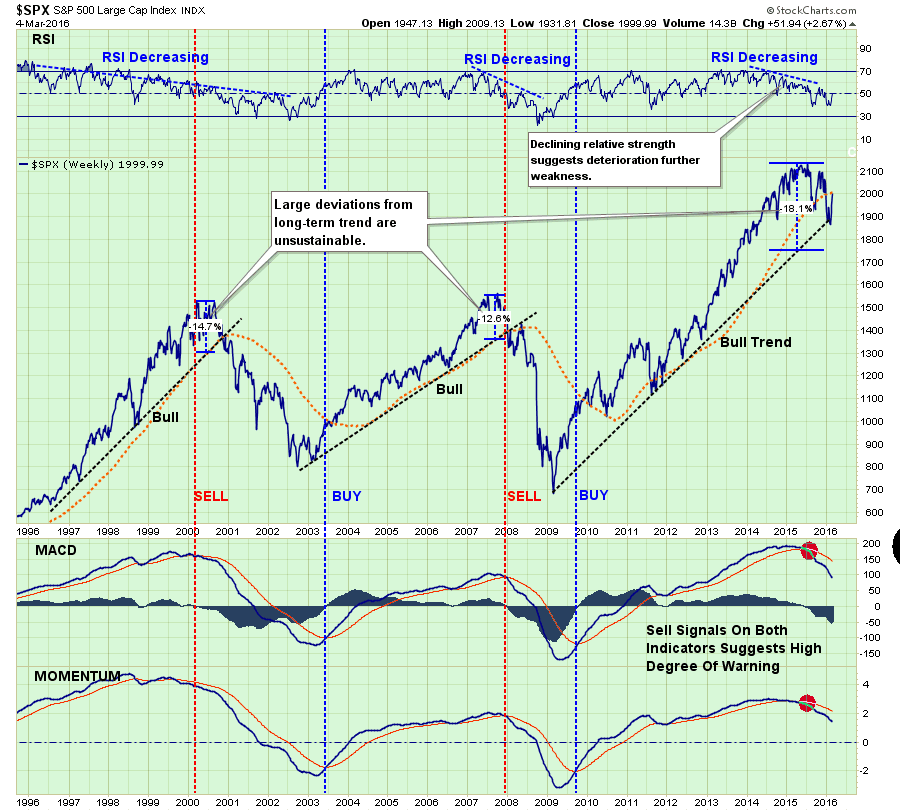
The next chart shows the current deviation in earnings growth from the long-term trend. Note that negative deviations have coincided with major market peaks.
Lastly, the technical chart below shows earnings capped at the “prior peak” of earnings growth as compared to the S&P 500. Future outcomes have not been kind.
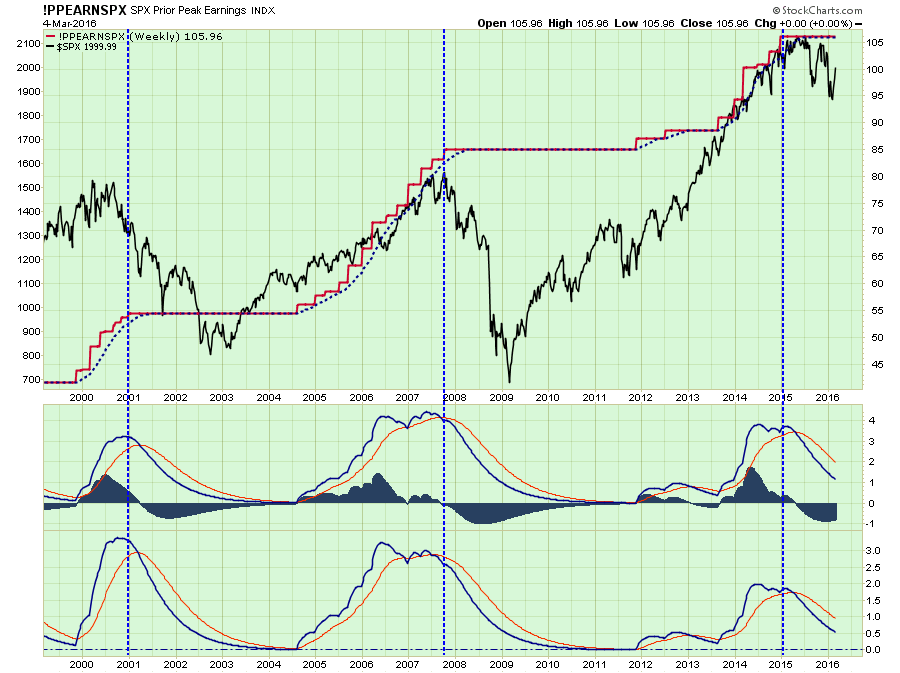
The point here is that while markets have bounced as of late, a major underpinning of future stock prices is still negative. Until a change to the positive begins to occur, the probability of lower prices continues to outweigh the possibility of higher ones.
Therefore, we continue to wait.
WAITING FOR CHANGE
As stated last week:
“There is now little for us to do except to wait, and watch patiently, for the market to either confirm a “bear market,” OR stabilize and begin to rebuild the bullish supports necessary to allow equity risk to once again be increased.”
Neither situation will make itself apparent in short order, so relax and we let the market dictate what actions we take next. “Guessing” at the markets has not typically been a successful and repeatable strategy.
While very short-term indicators have improved, the longer-term signals have not.
As investors, we should not be basing our investment decisions on “hope,” but rather an analysis of the evidence that would put the highest probability of “winning” in our favor.
“On Wall Street, the caveat of the marketplace should be translated: Gambler Beware” – Nicholas Darvas, Wall Street: The Other Las Vegas
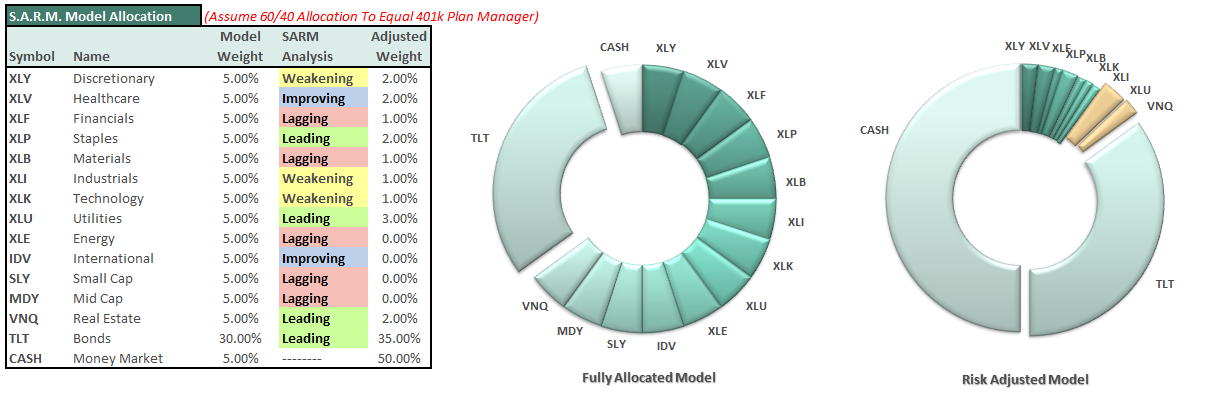
S.A.R.M. Model Allocation
If you are a new reader to this missive, click here and review previous explanations of the S.A.R.M. Model in the MONDAY MORNING CALL section of that missive.
There have been no changes to S.A.R.M. model in the past week.
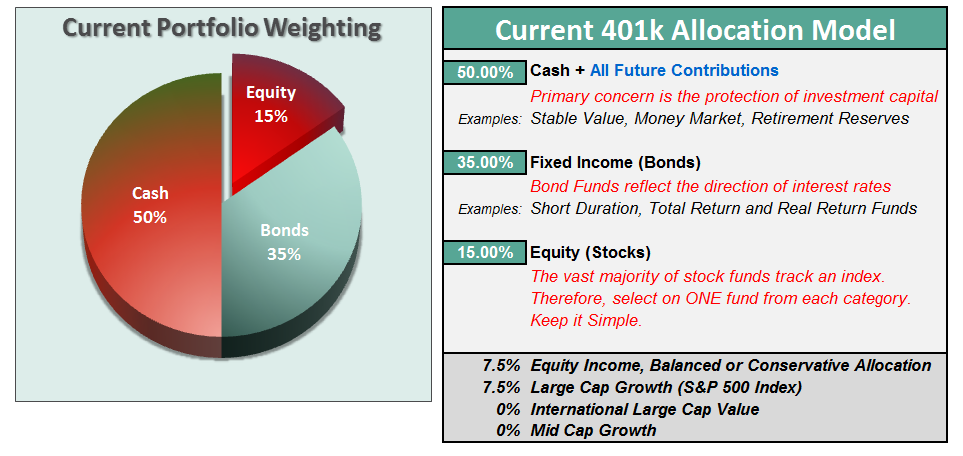
The portfolio model remains unchanged this week with CASH to 50%, 35% in bonds, and 15% in equities.
It is completely OKAY if your current allocation to cash is different based on your personal risk tolerance. This is just a guide.
As you can see, there are not DRASTIC movements being made. Just incremental changes to reducing overall portfolio volatility risks. However, if the expected bounce fails at resistance, then further reductions will be required in accordance with the risk reduction modeling.
Remember, as investors, our job is not to try and capture every single relative point gain of the market as it rises. While we certainly want to participate in the rise, our JOB is to protect our capital against substantial losses in the future. A methodology that regularly harvests gains, reduces risk and keeps the portfolio focused on longer-term goals will lead to a more successful outcome.
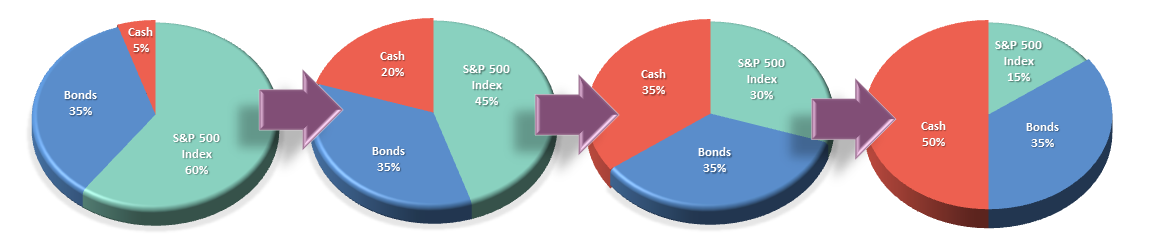
THE REAL 401k PLAN MANAGER

There are 4-steps to allocation changes based on 25% reduction increments. As noted in the chart above a 100% allocation level is equal to 60% stocks. I never advocate being 100% out of the market as it is far too difficult to reverse course when the market changes from a negative to a positive trend. Emotions keep us from taking the correct action.
SITTING AT TARGET FOR NOW
With the market having broken the long-term bullish-trend, the risk currently remains to the downside. As discussed throughout the entirety of this week’s missive, the technical damage to the market is significant and the recent rally will most likely fail. This is an estimation based on historical analysis, some event (exogenous, monetary or fiscal) could occur which would render such analysis incorrect. If such an event occurs, we will re-evaluate holdings and readjust accordingly. However, we are not there yet.
Therefore, I reiterate last week’s note:
“With portfolio allocations now reduced to TARGET levels, the only action to currently take is NOTHING. We are now in the position to just WAIT and allow the market to TELL us what it wants to do next.
While many will speculate on a resumption of a “bull market” in the short-term, the RISK of being WRONG far outweighs the possibility that such prognostications are correct.”
Portfolio management is not difficult, it is just a function of letting the markets tell you what it wants to do, rather than “hoping and guessing” at what YOU want it to do.
You are not in control. When you learn to accept that, managing your money becomes vastly easier.
If you need help after reading the alert; don’t hesitate to contact me.
Current 401-k Allocation Model
The 401k plan allocation plan below follows the K.I.S.S. principal. By keeping the allocation extremely simplified it allows for better control of the allocation and a closer tracking to the benchmark objective over time. (If you want to make it more complicated you can, however, statistics show that simply adding more funds does not increase performance to any great degree.)
401k Choice Matching List
The list below shows sample 401k plan funds for each major category. In reality, the majority of funds all track their indices fairly closely. Therefore, if you don’t see your exact fund listed, look for a fund that is similar in nature.


