by Lance Roberts, Clarity Financial
The good news is that you can “walk, rather than run, to the exit.”
As shown in the chart below, on a very short-term basis the market is oversold and the bounce on Friday was JUST enough to close above the October lows support at 1860.

Any continued rally next week should be used to further reduce equity risk and rebalance portfolios.
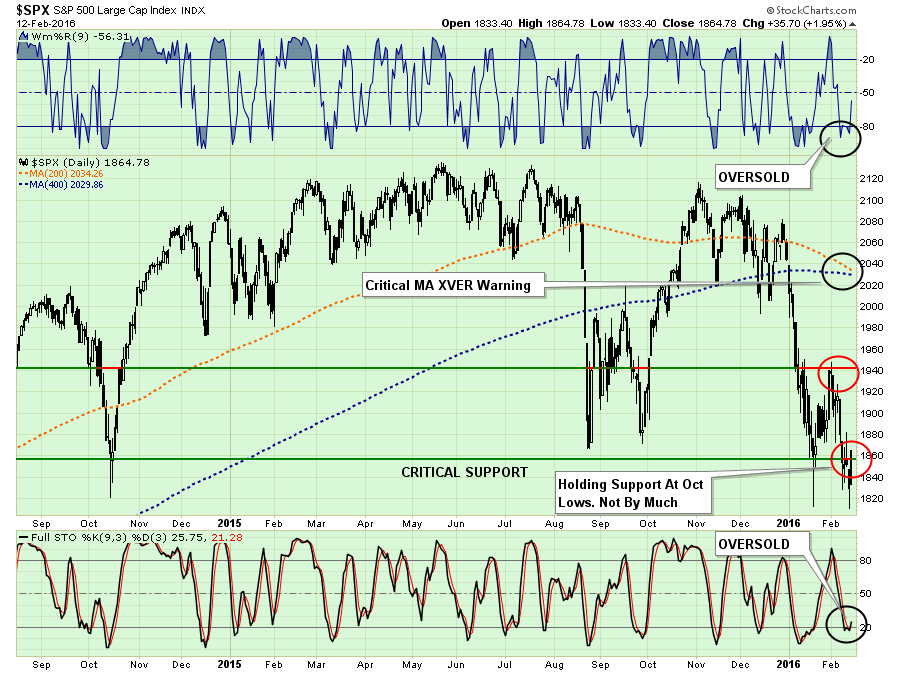
Unfortunately, we have had a series of failed one-day rallies over the past couple of months, so it is advisable to not try and game the market at this juncture.
I continue to suggest taking actions to reduce risk in portfolios by taking the following actions on ANY RALLIES:
Trim back winning positions to original portfolio weights: Investment Rule: Let Winners Run
Sell positions that simply are not working (if the position was not working in a rising market, it likely won’t in a declining market.) Investment Rule: Cut Losers Short
Hold the cash raised from these activities until the next buying opportunity occurs. Investment Rule: Buy Low
MOMENTUM TELLS THE STORY
In Gary Antonacci’s book, Dual Momentum Investing, he combines two measures of momentum into a single portfolio management structure. One of the ideas he lays out is relative momentum which is the price momentum of an asset versus that of another. In effect, it is a measure of relative strength.
However, what we do know is that relative strength of an asset versus a comparative index can tell us where opportunities may be available. The first chart below is each sector of the S&P 500 versus the S&P 500 index. Each sector is divided into the index to provide a relative strength measure. When the ratio is higher than its 12-month moving average, the sector is outperforming its index and deserves some further attention. (Note: I didn’t say buy it. I said it deserves further attention and analysis. This is simply an “alert system.”)
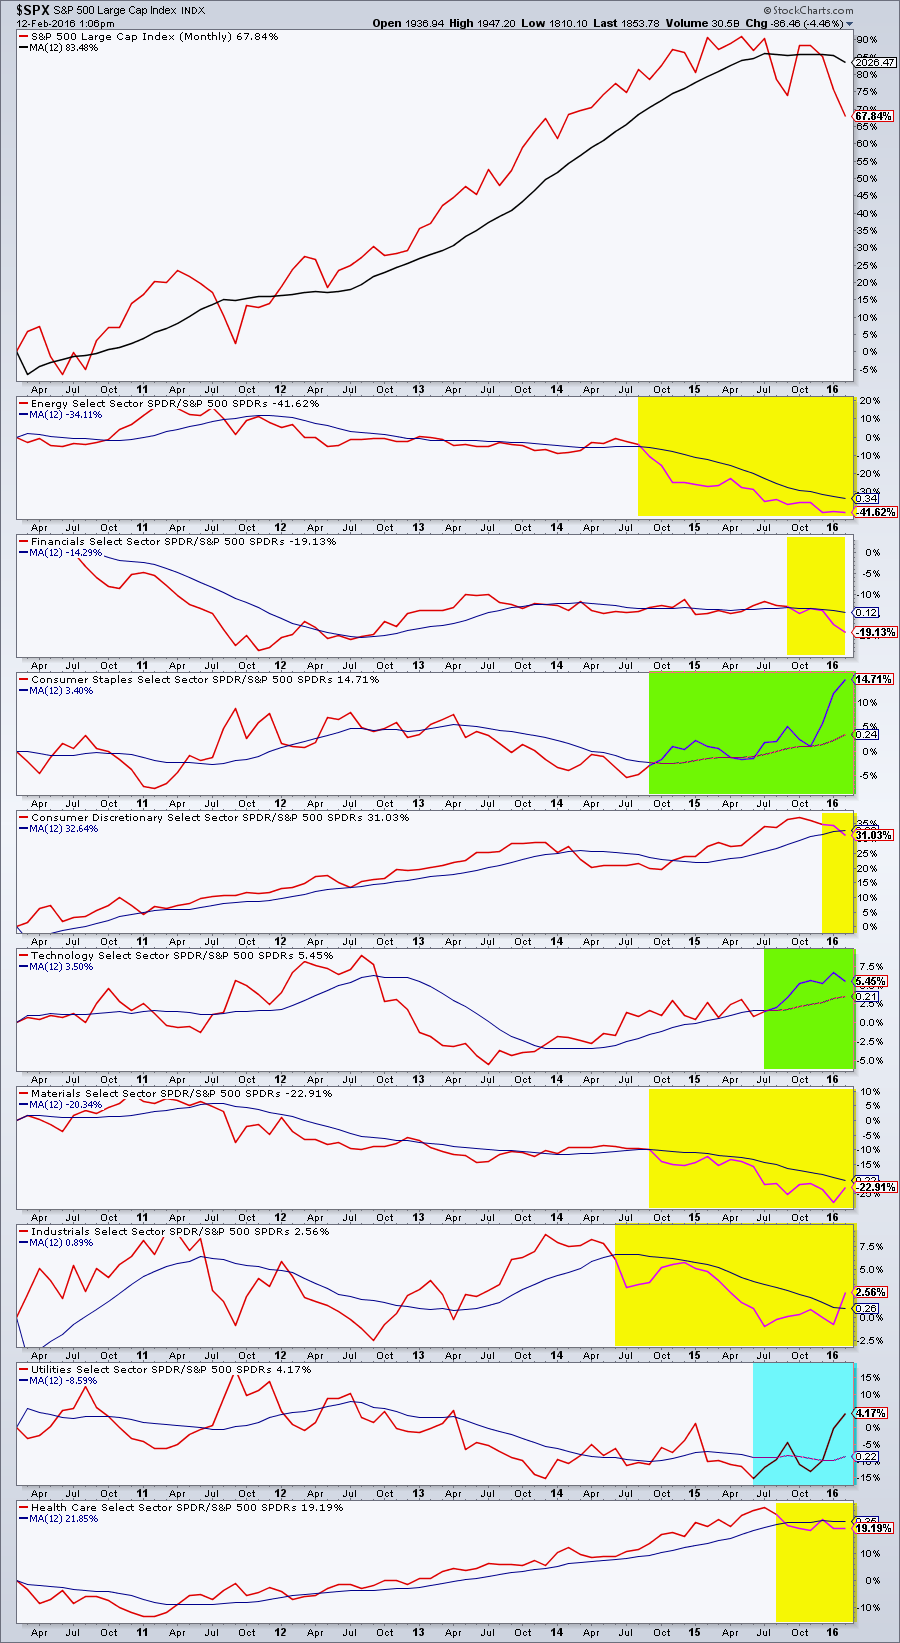
Not surprisingly, we find Utilities and Staples leading the charge, with Technology beginning to wane. Interestingly, money is also finding its way into Industrials.
Hold on a second. This doesn’t mean these sectors are making money. It just means they are performing better than the overall index. Winning by not losing as much, is not winning.
The chart below shows the price performance of each major sector of the S&P 500 since the beginning of this year.
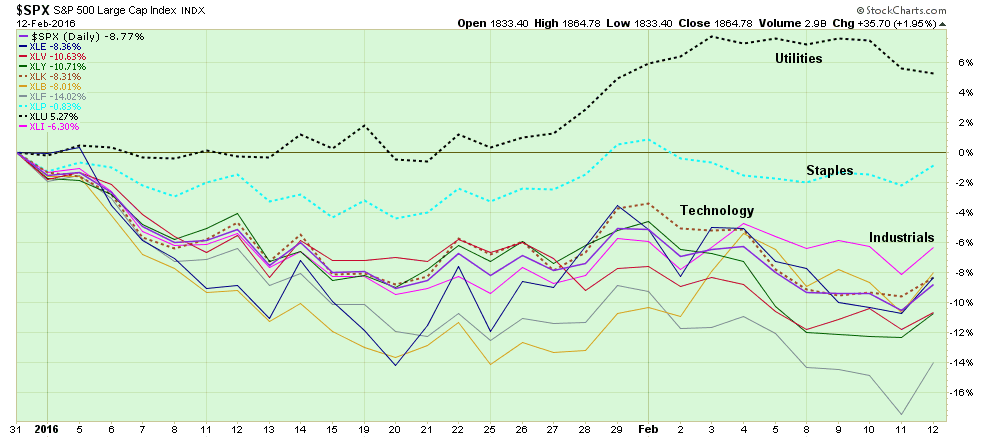
As suspected, only Utilities have had a positive return on a year-to-date basis. The deterioration in the overall market suggests that there is more pain to come. Also, money is hiding in Utilities as a safety play. Utilities are extremely overvalued and, like investors found out with MLP’s, they are not a replacement for bonds.
Moving on, let’s look at major asset classes in the same manor.
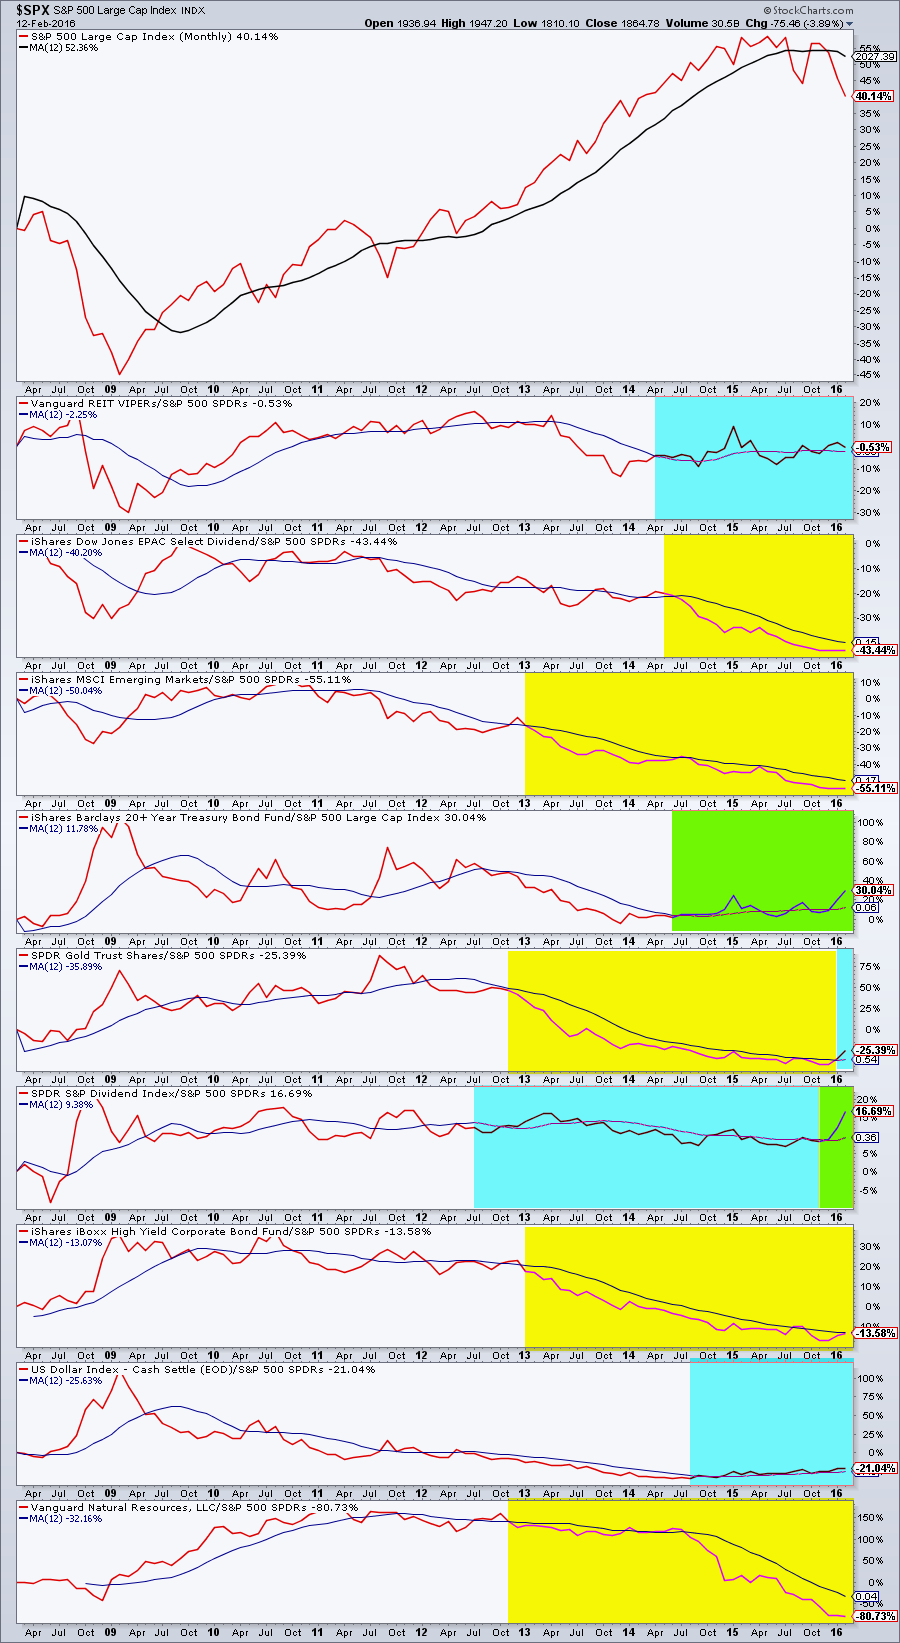
As with Utilities above, we are watching money seek safety inside of “dividend stocks.” But unlike utilities, dividend stocks are not posting gains overall this year. What is making money, as “fear” rises in the markets, is Gold and Bonds.
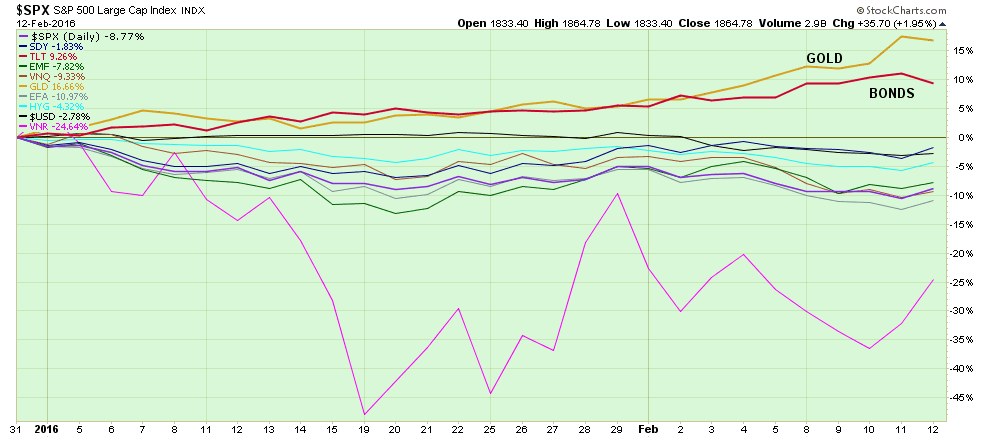
While Gold has shown some signs of life as of late, it is still too early to add this asset class to portfolios. At the beginning of 2012, I wrote in this missive that investors should exit Gold. While Gold is improving, it is still trapped in a long-term downtrend. When the downtrend is reversed the reward/risk ratio will once again be favorable to add this asset class back into portfolios.
Gold is a very speculative and volatile asset class. Gold is NOT a hedge for inflation. Gold is NOT an alternative currency. Gold will not protect you in an economic meltdown. For that, you should own lead with which you can get all the gold you want.
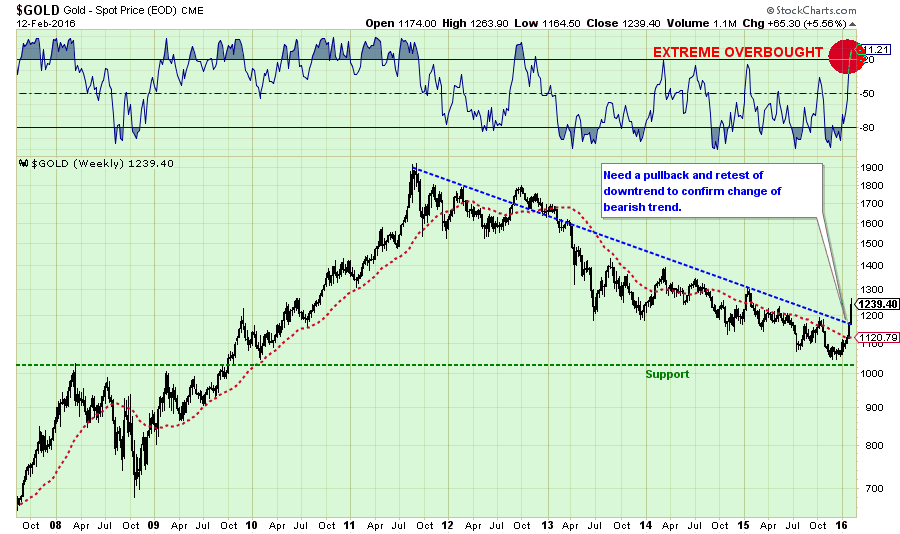
We may be approaching a point soon where gold can be added to portfolios, but that time is not now. Furthermore, it is important to note that in 2008, as shown above, Gold lost more than 30% of its value during the panic to “sell out” of the market. It was not a “hedge” against the decline. That will likely happen again if a similar correction in the markets occurs.
Overall, this is still a very dangerous market. Deterioration is still prevalent both economic, fundamentally and technically. Caution is highly advised until a more bullish set-up emerges.
S.A.R.M. Model Allocation
If you are new reader to this missive, click here and review previous explanations of the S.A.R.M. Model.
I have adjusted the model allocation to account for the rebalancing of bonds, REITS, and Utilities in portfolios. We will still want to use the current reflexive rally to take actions to rebalance portfolio models accordingly.
During THIS bounce in the market, adjust weightings as follows:
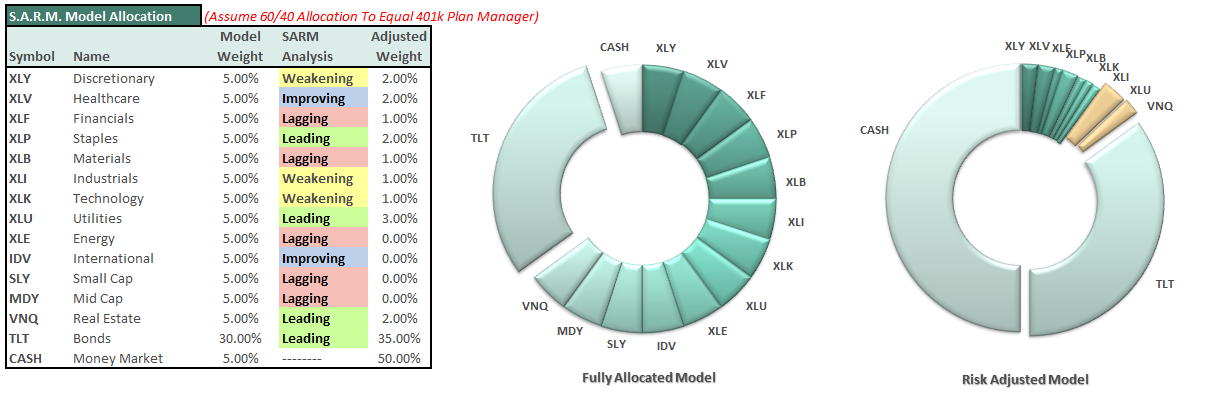
During this rally, cash will be increased from 50% of the portfolio to 45%, with 35% in bonds, and the rest in equities.
It is completely OKAY if your current allocation to cash is different based on your personal risk tolerance. This is just a guide.
As you can see, there are not DRASTIC movements being made. Just incremental changes to reducing overall portfolio volatility risks. However, if the expected bounce fails at resistance, then further reductions will be required in accordance with the risk reduction modeling.
Remember, as investors, our job is not to try and capture every single relative point gain of the market as it rises. While we certainly want to participate in the rise, our JOB is to protect our capital against substantial losses in the future. A methodology that regularly harvests gains, reduces risk and keeps the portfolio focused on longer-term goals will lead to a more successful outcome.


