from The Conversation
— this post authored by Laura B. Balzer and Brian W. Whitcomb, University of Massachusetts Amherst
San Francisco and New York City both reported their first COVID-19 cases during the first week of March. On March 16, San Francisco announced it was ordering residents to stay home to avoid spreading the coronavirus, and New York did the same less than a week later. But by the end of May, while San Francisco had attributed 43 deaths to COVID-19, New York City’s death count was over 20,000.

Please share this article – Go to very top of page, right hand side, for social media buttons.
What explains the stark difference in COVID-19-related deaths between these two cities? Is the delay in the stay-at-home order responsible? What about city-specific measures taken to mitigate COVID-19 before the order? Is something else going on?
The divergent trajectories of San Francisco and New York City, while especially striking, are not unique. Worldwide, COVID-19 is having highly variable effects. Within the U.S., infections, hospitalizations and deaths have skyrocketed in nearly all major cities in the Northeast while remaining fairly low in some other metropolitan centers, such as Houston, Phoenix and San Diego.
How cities and states implemented public health interventions, such as school closures and stay-at-home orders, has varied widely. Comparing these interventions, whether they worked and for whom, can provide insights about the disease and help improve future policy decisions. But accurate comparisons aren’t simple.
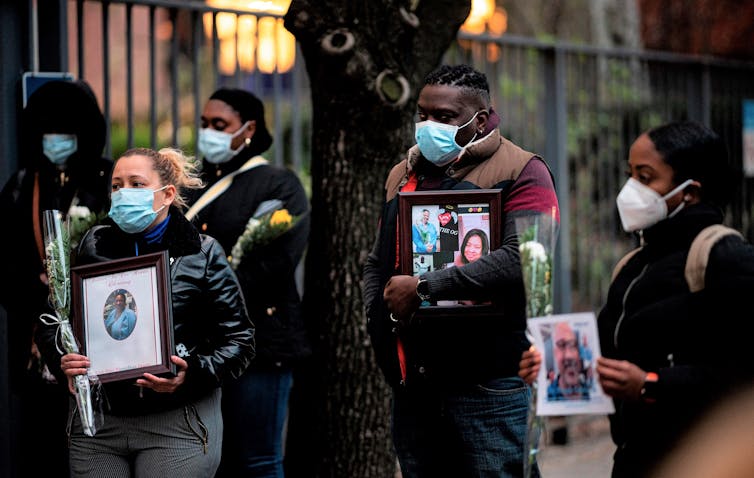
Nurses and other health care workers in New York mourned colleagues who have died during the outbreak of the novel coronavirus. Johannes Eisele/AFP/Getty Images
The range of COVID-19 interventions implemented across the U.S. and worldwide was not random, making them difficult to compare. Among other things, population density, household sizes, public transportation use and hospital capacity may have contributed to the differences in COVID-19 deaths in San Francisco and New York City. These sorts of differences complicate analyses of the effectiveness of responses to the COVID-19 pandemic.

As a biostatistician and an epidemiologist, we use statistical methods to sort out causes and effects by controlling for the differences between communities. With COVID-19, we’ve often seen comparisons that don’t adjust for these differences. The following experiment shows why that can be a problem.
City simulations reveal a paradox
To illustrate the dangers of comparisons that fail to adjust for differences, we set up a simple computer simulation with only three hypothetical variables: city size, timing of stay-at-home orders and cumulative COVID-19 deaths by May 15.
For 300 simulated cities, we plotted COVID-19 deaths by the delay time, defined as the number of days between March 1 and the order being issued. Among cities of comparable size, delays in implementing stay-at-home orders are associated with more COVID-19 deaths – specifically, 40-63 more deaths are expected for each 10-day delay. The hypothetical policy recommendation from this analysis would be for immediate implementation of stay-at-home orders.
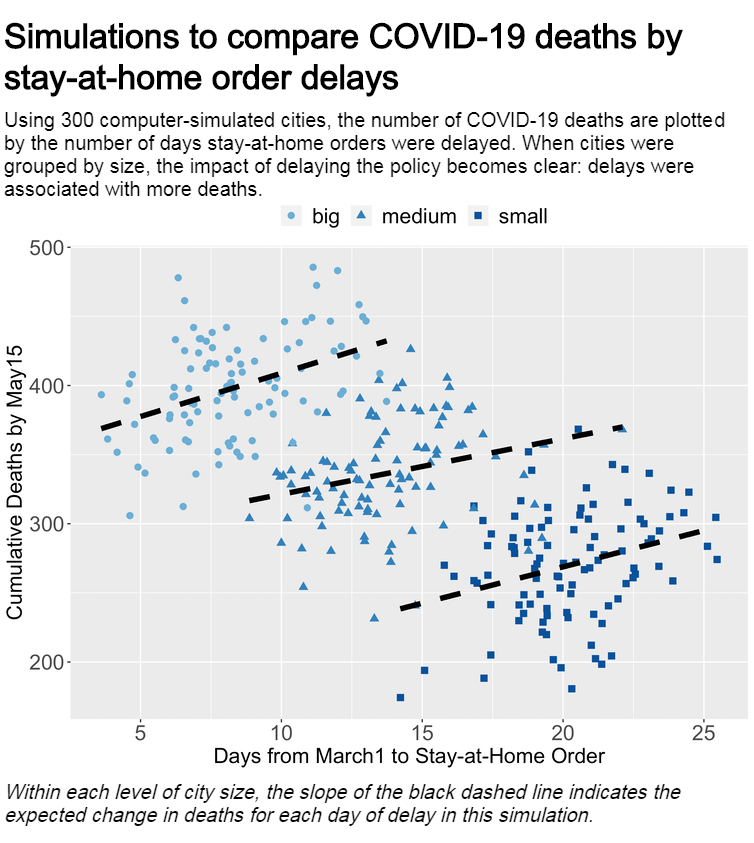
Laura Balzer/Github, CC BY-ND
Now consider a plot of the same 300 simulated cities that doesn’t take city size into consideration. The relationship between delays and deaths is reversed: Earlier implementation in this simulation is strongly associated with more deaths, and later implementation with fewer deaths. This apparent paradox occurs because of the causal relationships between city size, delays and COVID-19 deaths. Strong connections or associations between two variables don’t guarantee that one variable causes another. Correlation does not imply causation.
Failing to properly address these relationships can create misperceptions with dramatic implications for policymakers. In these simulations, the analysis that fails to consider city size would lead to an erroneous policy recommendation to delay or never implement stay-at-home orders.
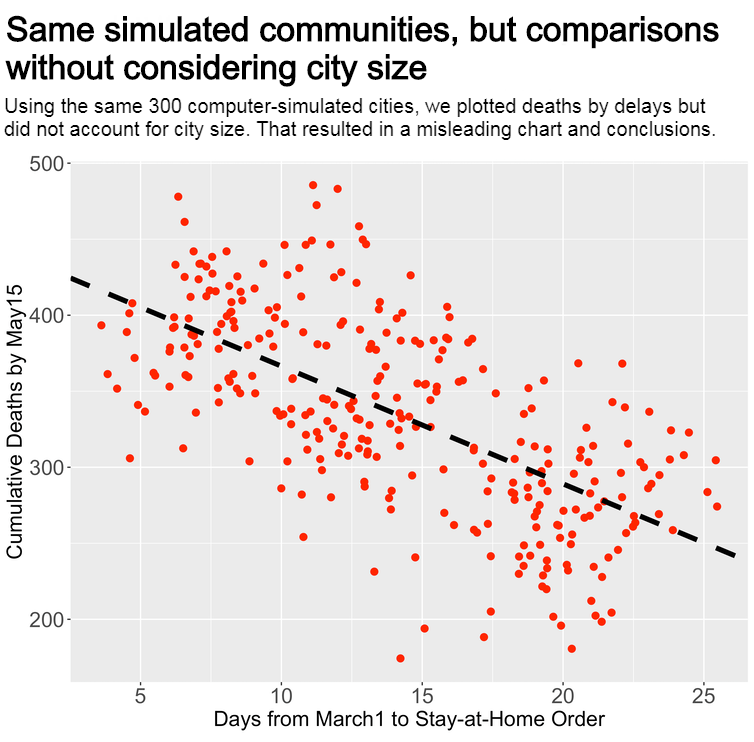
Laura Balzer/Github, CC BY-ND
It gets more complicated
Of course, causal inference in real life is more complicated than in a computer simulation with only three variables.
In addition to confounding factors like community size, substantial evidence suggests that public health interventions do not protect all people equally.
In San Francisco, stark disparities have emerged. For example, comprehensive testing of the Mission District revealed 95% of people testing positive were Hispanic. Factors like socioeconomic status, race and ethnicity, and many others, vary widely among communities and can impact COVID-19 infection and death rates. Differences among community residents makes appropriate interpretation of comparisons, such as between San Francisco and New York, even more difficult.
So how do we effectively learn in the current environment?
While especially pressing now, the analytic challenges posed by COVID-19 are not new. Public health experts have long used data from nonrandomized studies – even in the midst of epidemics. During the Cholera outbreak in London in 1849, John Snow, famed in epidemiologic circles, used available data, simple tools and careful consideration to identify a water pump as a source of disease spread. Evidence-based decisions require both data and appropriate methods to analyze data.
Cities and communities worldwide vary in important ways that can complicate public health research. The rigorous application of causal inference methods that can take into account differences between populations is necessary to guide policy and to avoid misinformed conclusions.
[You need to understand the coronavirus pandemic, and we can help. Read The Conversation’s newsletter.]
Laura B. Balzer, Assistant Professor of Biostatistics & Director of the UMass Causality Lab, University of Massachusetts Amherst and Brian W. Whitcomb, Associate Professor of Epidemiology, University of Massachusetts Amherst
This article is republished from The Conversation under a Creative Commons license. Read the original article.
.


