Written by rjs, MarketWatch 666
 Here are some selected new articles from the week ended 21 October 2018.
This article is a feature every Monday evening on GEI.
Please share this article – Go to very top of page, right hand side, for social media buttons.
DUC wells at a record high, leading to a 6.5 month backlog of unfracked wells; rig count at a 41 month high nonetheless
Oil prices were down for a second week and hit a one month low on Thursday, as trading on fundamentals gave way to geopolitical concerns arising from the Saudi orchestrated dismemberment and subsequent killing of Washington Post columnist and Saudi insider Jamal Khashoggi, who apparently had information linking the Saudi royals to the 9-11 trade tower bombing and hence had to be shut up…after falling 4% to $71.34 a barrel in a broad based global market selloff last week, prices for US crude oil contracts for November delivery spiked to as high as $72.70 a barrel on Monday after Saudi Al Arabiya television warned that if the US sanctioned Saudi Arabia for the Khashoggi killing, we would “face an economic disaster that would rock the entire world,”, but settled back to close just 44 cents higher at $71.78 a barrel on an outlook for long term weakness in oil demand…oil prices then rose another 14 cents to $71.92 a barrel in cautious trading on Tuesday as expectations of higher U.S.oil inventories offset reports of lower oil exports from Iran…after an initial rally to $72.43 a barrel on Wednesday, oil prices tumbled more than 3% to close down $2.17 at $69.75 a barrel, after the EIA reported an increase in US crude supplies that exceeded expectations for the 4th week in a row…oil prices fell another $1.10 to a one month low of $68.65 a barrel on Thursday, as oil traders’ concerns turned to the potential recessionary impact of the escalating trade war between the Trump administration and China…oil prices then bounced back 47 cents on U.S.-Saudi tensions over the Khashoggi killing on Friday, but still ended the week 3.1% lower than last Friday at $69.12 a barrel..
Natural gas prices, on the other hand, ended the week higher on volatile trading on changing weather forecasts and concerns over winter supplies…natural gas prices first rose 8.1 cents to $3.242 per mmBTU on Monday as forecasts indicated the current cold snap would linger through October, then gave up three-tenths of a cent on Tuesday, and then rose another 8.1 cents to $3.240 per mmBTU on Wednesday, again on the likelihood of below-average temperatures east of the Rockies and concern that would exacerbate the storage crisis…but a forecast that the cold weather was breaking down precipitated a dramatic Thursday sell-off in November natural gas contracts, which ended 12.2 cents lower at $3.198 per mmBTU, after the natural gas storage report came in close to expectations…natural gas contracts for November delivery then rebounded 5.2 cents on Friday to end the week at $3.250 per mmBTU, a 2.8% increase on the week..
This week’s natural gas storage report from the EIA for week ending October 12th indicated that natural gas in storage in the US rose by 81 billion cubic feet to 3,037 billion cubic feet during that week, which left our gas supplies 601 billion cubic feet, or 16.5% below the 3,638 billion cubic feet that were in storage on October 13th of last year, and 605 billion cubic feet, or 17.0% below the five-year average of 3,642 billion cubic feet of natural gas that are typically in storage after the second week of October….this week’s 81 billion cubic feet increase in natural gas supplies was a bit below consensus expectations of an 85 billion cubic foot increase, but was a bit above the average of 79 billion cubic feet of natural gas that have been added to storage during the second week of October in recent years, still only the 5th average or above average inventory increase in the past fifteen weeks…natural gas storage facilities in the Midwest saw a 37 billion cubic feet increase this week, reducing their supply deficit to 12.0% below normal, while supplies in the East increased by 22 billion cubic feet but still saw their deficit fall to 8.5% below normal for this time of year…the South Central region saw a 24 billion cubic feet increase in their supplies, as their natural gas storage deficit decreased to 24.8% below their five-year average…however, a natural gas pipeline rupture in Canada cutoff imports to both the Mountain and Pacific regions, so Mountain region supplies fell 3 billion cubic feet and their deficit from normal rose to 16.9%, while there was just a 2 billion cubic feet addition to storage in the Pacific region, where the natural gas supply deficit rose to 23.3% below normal for this time of year….
To get an idea of what kind of temperature factors led to this past week’s 81 billion cubic feet increase in natural gas stores, we’ll take a quick look at the most recent average temperature summary from the EIA’s natural gas storage dashboard:
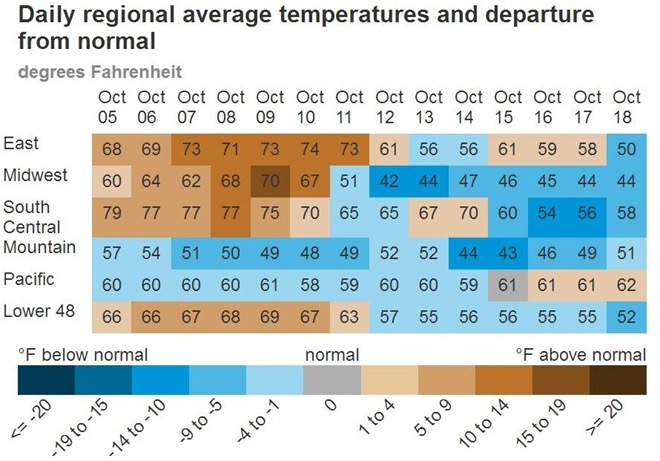
The above graphic from the EIA’s natural gas storage dashboard gives us both the average daily temperature from October 5th thru October 18th in each of the five natural gas regions, as well as the variance from normal for each of those daily temperature averages, as color coded at the bottom…to take temperatures in the East for example, the initial 68 and 69 degree averages on October 5th and October 6th are colored with the 2nd lightest shade of brown, indicating those average temperatures were 5 to 9 degrees above normal for the region on those dates…temperatures in the East from October 7th through the 11th are a darker shade of brown, indicating those average temperatures were 10 to 14 degrees above normal; however, the average temperatures in the East had dropped to 56 degrees by October 13th and 14th, and are thus color coded in light blue as being 1 to 4 degrees above normal…so this graphic gives us not only the actual average temperature for each region for each day, but also indicates how much that temperature deviated from the norm..
While the departure from normal helps us understand why a particular week may have deviated from past averages, what really matters for natural gas consumption is the actual temperature…for instance, an average temperature of 68 on a given day is not going to see much heating or cooling demand whether it is above normal in the Northeast or below normal in the deep south…what this graphic shows for week ending October 12th was that temperatures in the East were a bit warm and might have seen some air conditioning use, but not much; that temperatures in the Midwest probably saw little demand for cooling or heating, at least until the last two days of the period, that temperatures in the south central states were a bit warmer than normal and probably saw some modest air conditioning demand, and that temperatures in the Mountain States and Pacific states were cooler than normal and probably saw some demand for heating…however, since we are in this so-called “shoulder season” between the cooling season and the heating season, that means that we were able to store 81 billion cubic feet of natural gas in advance of the winter for for week ending October 12th…since we can see that the current week was much cooler nationally, we would expect that more furnaces will be clicking on nationally, and the associated natural gas surplus will be much less…
The Latest US Oil Data from the EIA
This week’s US oil data from the US Energy Information Administration, covering the week ending October 12th, showed that because of lower oil exports, higher oil imports, and a slowdown in oil refining, we were able to add oil to our commercial crude supplies for a fourth week in a row, despite a modest hurricane related drop in domestic oil production…our imports of crude oil rose by an average of 218,000 barrels per day to an average of 7,615,000 barrels per day, after falling by an average of 658,000 barrels per day the prior week, while our exports of crude oil fell by an average of 794,000 barrels per day to an average of 1,782,000 barrels per day during the week, which meant that our effective trade in oil worked out to a net import average of 5,833,000 barrels of per day during the week ending October 12th, 1,012,000 more barrels per day than the net of our imports minus exports during the prior week…over the same period, field production of crude oil from US wells was reportedly 300,000 barrels per day lower than the prior week at 10,900,000 barrels per day, which means that our daily supply of oil from the net of our trade in oil and from wells totaled an average of 16,733,000 barrels per day during this reporting week…
Meanwhile, US oil refineries were using 16,316,000 barrels of crude per day during the week ending October 12th, 352,000 barrels per day less than the amount of oil they used during the prior week, while over the same period 774,000 barrels of oil per day were reportedly being added to the oil that’s in storage in the US….hence, this week’s crude oil figures from the EIA would seem to indicate that our total working supply of oil from net imports and from oilfield production was 357,000 fewer barrels per day than what refineries reported they used during the week plus what oil was added to storage….to account for that disparity between the supply of oil and the consumption or new storage of it, the EIA inserted a (+357,000) barrel per day figure onto line 13 of the weekly U.S. Petroleum Balance Sheet to make the reported data for the daily supply of oil and the consumption of it balance out, essentially a fudge factor that is labeled in their footnotes as “unaccounted for crude oil” (for more on how this weekly oil data is gathered, and the possible reasons for that “unaccounted for” oil, see this EIA explainer)….
Further details from the weekly Petroleum Status Report (pdf) show that the 4 week average of our oil imports slipped to an average of 7,695,000 barrels per day, still 3.5% more than the 7,435,000 barrel per day average that we were importing over the same four-week period last year….the net 774,000 barrel per day increase in our total crude inventories was due to an 927,000 barrel per day increase in our commercially available stocks of crude oil, which was partially offset by a 157,000 barrel per day decrease in the amount of oil in our Strategic Petroleum Reserve, likely part of a sale of 11 million barrels from those reserves to Exxon et al that closed six weeks ago….this week’s crude oil production was reported as down by 300,000 barrels per day to 10,900,000 barrels per day because of a rounded 300,000 barrels per day decrease to 10,400,000 barrels per day in the rounded output from wells in the lower 48 states as Gulf of Mexico production was shut in due to Hurricane Michael, while a 13,000 barrels per day increase to 499,000 barrels per day in oil output from Alaska was not enough to impact the reported national total, which is now being rounded to the nearest 100,000 barrels per day….last year’s US crude oil production for the week ending October 13th had fallen to 8,406,000 barrels per day in another hurricane impact, so comparing this week’s oil production to that of a year ago is not meaningful…
Meanwhile, US oil refineries were operating at 88.8% of their capacity in using 16,316,000 barrels of crude per day during the week ending October 12th, unchanged from 88.8% of capacity the prior week, a typical utilization rate for the refinery maintenance season….the 16,316,000 barrels per day of oil that were refined this week were once again at a seasonal high, for the 18th out of the past 20 weeks, 5.7% higher than the 15,439,000 barrels of crude per day that were processed during the week ending October 13th, 2017, when US refineries were operating at 84.5% of capacity, an inordinately low figure probably due to a spate of storms active in the Gulf region at that time…
Despite the decrease in the amount of oil being refined this week, gasoline output from our refineries was quite a bit higher, increasing by 719,000 barrels per day to 10,430,000 barrels per day during the week ending October 12th, after our refineries’ gasoline output had decreased by 239,000 barrels per day during the week ending October 5th…with that jump in gasoline output, our gasoline production during the week was thus 4.0% higher than the 10,031,000 barrels of gasoline that were being produced daily during the same week last year…meanwhile, our refineries’ production of distillate fuels (diesel fuel and heat oil) decreased by 213,000 barrels per day to 4,784,000 barrels per day, after that output had decreased by 1,000 barrels per day the prior week….even so, this week’s distillates production was still fractionally higher than the 4,964,000 barrels of distillates per day that were being produced during the week ending October 13th 2017….
Even with the big jump in our gasoline production, our supply of gasoline in storage at the end of the week still fell by 2,014,000 barrels to 234,156,000 barrels by October 12th, the 19th decrease in the past 34 weeks, a period encompassing the spring and summer weeks of higher gasoline consumption, when supplies usually trend lower….our supplies of gasoline fell this week because our exports of gasoline rose by 135,000 barrels per day to an October record high of 1,164,000 barrels per day, and because our imports of gasoline fell by 299,000 barrels per day to 394,000 barrels per day, and because the amount of gasoline supplied to US markets rose by 104,000 barrels per day to 9,182,000 barrels per day….but even after this week’s decrease, our gasoline inventories are still at a seasonal high, 5.3% higher than last October 13th’s level of 222,334,000 barrels, and roughly 10.4% above the 10 year average of our gasoline supplies for this time of the year…
Meanwhile, with our distillates production somewhat lower, our supplies of distillate fuels also fell again, decreasing by 827,000 barrels to 132,638,000 barrels during the week ending October 12th, their fourth straight decrease after 8 straight weeks of increases…our distillates supplies decreased even as the amount of distillates supplied to US markets, a proxy for our domestic demand, fell by 836,000 barrels per day from last week’s record high to 3,793,000 barrels per day, partly because our exports of distillates rose by 338,000 barrels per day to 1,305,000 barrels per day, while our imports of distillates fell by 22,000 barrels per day to 165,000 barrels per day….after this week’s decrease, our distillate supplies ended 1.4% below the 134,487,000 barrels that we had stored on October 13th, 2017, and roughly 5.7% below the 10 year average of distillates stocks for this time of the year…
Finally, despite higher oil exports and lower oil imports, our commercial supplies of crude oil increased for the 4th week in a row and for the 20th time in 2018, as they rose by 6,490,000 barrels during the week, from 409,951,000 barrels on October 5th to 416,441,000 barrels on October 12th…that increase means that our crude oil inventories are now about 2% above the five-year average of crude oil supplies for this time of year, and roughly 22% above the 10 year average of crude oil stocks for the 2nd weekend in October, with the disparity between those figures arising because it wasn’t until early 2015 that our oil inventories first rose above 400 million barrels…but since our crude oil inventories had been falling through most of the past year and a half until just recently, our oil supplies as of October 12th were still 8.7% below the 456,485,000 barrels of oil we had stored on October 13th of 2017, 11.2% below the 468,711,000 barrels of oil that we had in storage on October 14th of 2016, and 6.3% below the 444,618,000 barrels of oil we had in storage on October 16th of 2015…
This Week’s Rig Count
US well drilling rig activity increased for the third time in 4 weeks during the week ending October 19th, eclipsing this year’s previous high set after the first week of June, and thus it’s now the highest since March 20th 2015….Baker Hughes reported that the total count of rotary rigs running in the US increased by 4 rigs to 1067 rigs over the week ending on Friday, which was also 154 more rigs than the 913 rigs that were in use as of the October 20th report of 2017, but was still down from the shale era high of 1929 drilling rigs that were deployed on November 21st of 2014, the week before OPEC began their attempt to flood the global oil market…
The count of rigs drilling for oil increased by 4 rigs to 873 rigs this week, which was also 137 more oil rigs than were running a year ago, while it was well below the recent high of 1609 rigs that were drilling for oil on October 10, 2014…at the same time, the number of drilling rigs targeting natural gas formations rose by 1 rig to 194 rigs, which was also 17 more than the 177 natural gas rigs that were drilling a year ago, but way down from the modern high of 1,606 natural gas rigs that were deployed on August 29th, 2008…on the other hand, the last active rig categorized as “miscellaneous” was shut down this week, so there are no “miscellaneous” rigs deployed now, same as a year ago…
Offshore drilling in the Gulf of Mexico fell by 3 rigs to 19 rigs this week, which was down from the 20 Gulf of Mexico rigs active a year ago…however, a single rig continued to drill offshore from Alaska this week, so the total national offshore count is at 20 rigs, same as a year ago, when there was no offshore drilling other than in the Gulf…..
The count of active horizontal drilling rigs was down by 1 rig to 926 horizontal rigs this week, which was still 155 more horizontal rigs than the 771 horizontal rigs that were in use in the US on October 20th of last year, but down from the record of 1372 horizontal rigs that were deployed on November 21st of 2014…on the other hand, the directional rig count was up by 2 rigs to 72 directional rigs this week, which was still down from the 80 directional rigs that were in use during the same week of last year….in addition, the vertical rig count was up by 3 rigs to 69 vertical rigs this week, which was also up from the 62 vertical rigs that were operating on October 20th of 2017…
The details on this week’s changes in drilling activity by state and by shale basin are included in our screenshot below of that part of the rig count summary pdf from Baker Hughes that shows those changes…the first table below shows weekly and year over year rig count changes for the major producing states, and the second table shows the weekly and year over year rig count changes for the major US geological oil and gas basins…in both tables, the first column shows the active rig count as of October 19th, the second column shows the change in the number of working rigs between last week’s count (October 12th) and this week’s (October 19th) count, the third column shows last week’s October 12th active rig count, the 4th column shows the change between the number of rigs running on Friday and those on the equivalent weekend of a year ago, and the 5th column shows the number of rigs that were drilling at the end of that reporting week a year ago, which in this week’s case was on Friday the 20th of October, 2017…
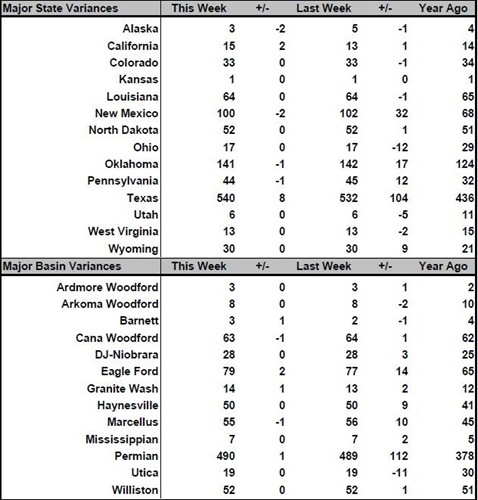
As you can see, this week’s drilling increase was all about Texas, as except for California, all other states that saw changes had their rig counts reduced…of the 8 rigs added in Texas, 4 were in the core Texas Oil District 8, or the Permian Delaware basin, and 2 were in Texas Oil District 7C, or the Permian Midland basin; so that means either that more than one Permian rig was shut down in New Mexico, or that some of the rig start ups in the Texas Permian region were conventional rigs that didn’t involve horizontal drilling in the Permian itself…note that despite the 3 rig decrease in Gulf of Mexico rigs offshore from Louisiana, the state saw no changes in its overall rig count because of the addition of 3 land based rigs in the southern part of the state at the same time…meanwhile, other than the 1 rig decrease in Pennsylvania’s Marcellus, all other rig increases or decreases in the basins shown above were oil rigs, but the natural gas rig count still rose by 1 because of a 2 rig increase in basins not tracked separately by Baker Hughes…
DUC well report for September
Monday of this past week saw the release of the EIA’s Drilling Productivity Report for October, which includes the EIA’s September data for drilled but uncompleted oil and gas wells in the 7 most productive shale regions…for the 24th consecutive month, this report again showed an increase in uncompleted wells nationally in September, even as drilling of new wells slowed while completions of drilled wells increased….like most previous months, this month’s uncompleted well increase was due to a big increase of newly drilled but uncompleted wells (DUCs) in the Permian basin of west Texas, with modest increases of uncompleted wells in the Anadarko basin of Oklahoma and the Eagle Ford of south Texas also contributing…for all 7 sedimentary regions covered by this report, the total count of DUC wells increased by 192, from 8,197 wells in August to 8,389 wells in September, again the highest number of such unfracked wells in the history of this report, and up 32.5% from the 6,329 wells that had been drilled but remained uncompleted in September a year ago…that was as 1,437 wells were drilled in the 7 regions that this report covers (representing 87% of all U.S. onshore drilling operations) during September, down from 1,495 in August, while 1,281 wells were completed and brought into production by fracking, a increase of 11 well completions over the 1270 completions seen in August…at the September completion rate, the 8,389 drilled but uncompleted wells left at the end of the month represent a 6.5 month backlog of wells that have been drilled but not yet fracked…
As has been the case for most of the past two years, the September DUC well increases were predominantly oil wells, with most of those in the Permian basin…the Permian basin saw its total count of uncompleted wells rise by 194, from 3,525 DUC wells in August to 3,722 DUCs in September, as 619 new wells were drilled into the Permian but only 425 wells in the region were fracked…at the same time, DUC wells in the Anadarko basin region in & around Oklahoma rose by 31, from 1014 DUC wells in August to 1,045 DUCs in September, as 191 wells were drilled in the Anadarko basin during September, while 160 Anadarko basin wells were completed…over the same period, the number of DUC wells in the Eagle Ford of south Texas increased by 18 to 1,584, as 179 wells were drilled into the Eagle Ford while 197 Eagle Ford wells were fracked….on the other hand, the drilled but uncompleted well count in the Appalachian region, which includes the Utica shale, fell by 22 wells, from 687 DUCs in August to 665 DUCs in September, as 114 wells were drilled into the Marcellus and Utica shales, while 136 of the already drilled wells in the region were fracked…in addition, the drilled but uncompleted well count in the Niobrara chalk of the Rockies’ front range decreased by 15 wells to 407, as 181 Niobrara wells were drilled while 196 Niobrara wells were being fracked…similarly, DUC wells in the Bakken of North Dakota fell by 11, from 778 DUC wells in August to 767 DUCs in September, as 124 wells were drilled into the Bakken in September while 135 drilled wells in that basin were completed….lastly, the natural gas producing Haynesville shale of the northern Louisiana-Texas border region saw their uncompleted well inventory decrease by 3 wells to 199, as 47 wells were drilled into the Haynesville during September, while 50 Haynesville wells were fracked during the same period…thus, for the month of September, DUCs in the 5 oil basins tracked by in this report (ie., the Anadarko, Bakken, Niobrara, Permian, and Eagle Ford) increased by a net of 217 wells to 7525 wells, while the uncompleted well count in the natural gas basins (the Marcellus, Utica, and the Haynesville) decreased by 25 wells to 864 wells, although as the report notes, once into production, more than half the wells drilled nationally will produce both oil and gas…
U.S. OKs startup of part of Enbridge Ohio-Michigan NEXUS natgas pipe – (Reuters) – U.S. energy regulators approved Canadian energy company Enbridge Inc’s request to put part of its $2.6 billion NEXUS natural gas pipeline from Ohio to Michigan into service. NEXUS is one of several gas pipelines designed to connect growing output in the Marcellus and Utica shale basins in Pennsylvania, West Virginia and Ohio with customers in other parts of the United States and Canada. Enbridge said the facilities the U.S. Federal Energy Regulatory Commission (FERC) on Wednesday allowed the company to put into service will enable it to transport about 0.97 billion cubic feet per day (bcfd). Once the 255-mile (410-km) NEXUS project is fully in service, it will be able to carry up to 1.5 bcfd of gas from the Marcellus and Utica shale fields to the U.S. Midwest and Gulf Coast and Ontario in Canada. NEXUS is a partnership between Enbridge and Michigan energy company DTE Energy Inc. Earlier this week, Enbridge said it put part of its $200 million Texas Eastern Appalachian Lease (TEAL) gas pipeline project into service. TEAL is an expansion of Enbridge’s Texas Eastern system designed to deliver 0.95 bcfd of gas to NEXUS. When it started construction of the NEXUS pipe in late 2017, Enbridge estimated the TEAL and NEXUS projects would enter service in the third quarter of 2018. Enbridge said it completed the NEXUS project in September when it asked FERC for permission to put part of pipeline into service. New pipelines built to remove gas from the Marcellus and Utica basins have enabled shale drillers to boost output in the Appalachia region to a forecast record high of around 29.4 bcfd in October from 24.2 bcfd during the same month a year ago. That represents about 36 percent of the nation’s total dry gas output of 81.1 bcfd expected on average in 2018. A decade ago, the Appalachia region produced just 1.6 bcfd, or 3 percent of the country’s total production in 2008.
Trumbull County Residents Working To Limit Wastewater Wells – — Much of the wastewater from Pennsylvania’s fracking industry is trucked across the border to Ohio. Last year, Pennsylvania and West Virginia contributed nearly half of the more than a billion gallons of frack waste that were injected into underground wells in Ohio. In Trumbull County, Michelle Garman used to marvel at the 22-acres of land around her home in Vienna, Ohio, less than 10 miles from the Pennsylvania border. She didn’t know much about fracking then, let alone frack waste injection wells. But she remembers New Years Eve 2011, when a 4.0-magnitude earthquake shook nearby Youngstown, Ohio. Around a dozen smaller quakes followed. The state determined that the quakes were caused by an injection well. And one in New Castle, Pennsylvania was linked to fracking as well. The well believed to have caused the Youngstown quakes has been closed permanently. Garman’s view changed in 2013 when an injection well was built on the property next door. “How does it affect our health, my son’s health?” she wondered. “I mean, it is toxic. Plain and simple, that’s poison that they’re pumping into the ground.” On a recent evening, leaders from townships in Trumbull County gathered at the gazebo in the Brookfield town square. Brookfield Township trustee Gary Lees coached people on how to send letters to their representatives in Columbus asking them to consider legislation that would stop more injection wells in Trumbull County. Trumbull County already has 17, among the most in the state, and 6 more are in the works. In Hubbard Township, Bobcat LLC has applied to the Ohio Department of Natural Resources for an injection well. Pittsburgh-based Seneca Resources has drilled a new injection well in Brookfield Township, one of five it plans on the site. The company still needs state approval of its surface facility. State representative Glenn Holmes says people there are fed up. He references a petition against a plan for the five injection wells by Seneca Resources. “In a community of about 8,000 people, [we have] 5,000 signatures,” he said. “They don’t want it.” Holmes has proposed two bills in the Ohio House of Representatives meant to rein in injection wells. One,introduced last spring, would divert more than a third of fees Ohio collects from other state’s frack waste disposal to local governments. Last year, fees for this waste brought in more than $650,000. Holmes says counties should get a cut.
A Great Lakes pipeline dispute points to a broader energy dilemma – WTOP – Gov. Rick Snyder and Enbridge, a Canadian company, have reached an agreement over a leak-prone pipeline that runs beneath the Straits of Mackinac, the 4-mile-long waterway that divides Lake Michigan and Lake Huron.Rather than shut the 65-year-old pipeline down altogether, as environmentalists are demanding, or conduct routine maintenance, as Enbridge desired, Snyder is requiring Enbridge to replace the pipeline at an estimated cost of up to US$500 million without a deadline. While the lakes, beaches and livelihoods vulnerable to harm from a potential spill are perhaps unique to Michigan, the question of what to do about a host of aging pipelines across the U.S. is not. Nearly half of the nation’s pipelines currently operating were built before 1960. Amid rising oil and gas production, there are hard compromises to make between ensuring an adequate energy supply, protecting public safety, and reducing the nation’s reliance on fossil fuels – a key contributor to climate change. Approximately 3 million miles of pipelines move crude oil, natural gas and other hazardous liquids across the U.S. Most crude oil pipelines traversing the center of the country transport oil from western Canada and North Dakota southward to refineries in Texas and Louisiana. Much of this system dates back to the economic boom of the 1950s and 1960s. Indeed, roughly half of the crude oil pipelines operating today are at least 50 years old. More of the natural gas pipelines that span the county are concentrated around the Marcellus Shale formation, in eastern Ohio and Pennsylvania. And 60 percent of the 319,000 miles of pipelines currently transporting natural gas were installed before 1970. A recent Department of Energy report suggested that replacing just the cast-iron pipelines, which are the oldest and riskiest variety, would cost approximately $270 billion. Compared to hauling fuel by rail or truck, the Transportation Research Board, a nonprofit that serves as an advisory body to the White House, Congress and federal agencies, considers pipelines to be safer. Yet when pipeline accidents do occur, they are typically larger and impact the environment more directly than the alternatives. A big spill in the Straits of Mackinac could result in oil polluting over 1,200 miles of shoreline, cause $1.3 billion in damage and cost $500 million to clean up, Michigan Technological University researchers estimate.
Perhaps 29 New Natural Gas Fueled Electric Power Plants in PA, OH, & WV — A new report shows that natural gas-powered energy plants either in operation or in various stages of development have attracted more than $25 billion worth of new investment to the Appalachian Basin.The report comes on the heels of an announcement Tuesday that the Lordstown Energy Center, a $1 billion, 940-megawatt combined cycle-energy plant, is now operational and producing electrical power.Some 29 new power plants, each with a capacity of 475-megawatts or greater, are in operation, under construction, or in the various stages of the permitting process in Ohio, Pennsylvania and West Virginia.When operating at full capacity, the 29 plants would generate a combined 26,086 megawatts of power. Total construction jobs would amount to 17,800, the industry group reports. DOWNLOAD CHART Ten plants are either in operation or slated for Ohio, 16 are in operation or in various stages of development in Pennsylvania, and three are in the works in West Virginia, the advocacy group reports. Among the plants under construction in Pennsylvania is the Hickory Run Energy Center in Lawrence County, Pa., which represents an $863 million investment. In addition to the Lordstown plant, in Ohio the $889 million Carroll County Energy plant is operating, the South Field Energy plant in Columbiana County, a $1.3 billion investment, is scheduled to begin construction soon. And permits have been issued for the Trumbull Energy Center, also in Lordstown, a $865 million project that remains in limbo pending resolution of a legal dispute. The plants are being constructed using local labor. Don Crane, former president of the Western Reserve Building and Construction Trades Council, described the labor agreement that employed the workers who built the Lordstown Energy Center as “the best labor agreement that anyone has ever seen on either side of the table in the oil and gas industry. It will be a model going forward that gets used often.” Moreover, many of the new power plants are being built on the sites of previous power plants or other industrial facilities. Ohio’s 10 new plants represent more than 9,000 megawatts of power and an estimated $9 billion worth of investment, the report found. The projects have the prospect of creating about 7,200 jobs during the construction phase.
Appalachia has 29 gas-fired power plants in various development stages – One of the biggest untold stories in the Utica Shale is the still-growing development of natural gas-fired power plants, Kallanish Energy reports. That assessment came from Jackie Stewart, managing director, energy and natural resources, for FTI Consulting, headquartered in Washington, D.C. “It’s the most exciting thing happening on Ohio … and it’s the greatest story in Ohio,” she said. She touted the shale boom in a talk on Wednesday at Utica Summit VI at Walsh University in North Canton, Ohio. The downstream-focused conference drew roughly 100 people, and was presented by Shaledirectories.com and the Canton Regional Chamber of Commerce. Ohio has 10 gas-fired power plants in operation, under construction or planned, offering a total of 9,294 megawatts of capacity, Stewart said. The 10 plants together have a price tag of $9.1 billion. They will produce roughly 7,200 construction jobs. Four Ohio gas-fired plants are operational and two are under construction. The Lordstown Energy Station in Trumbull County in northeast Ohio just became operational in the last few days, she said. The plants are replacing coal-fired plants that are being shut down and they provide baseload electricity renewables cannot provide, she said. What’s happening in Ohio is also spreading to its neighboring states in the Appalachian Basin, Stewart said. Pennsylvania has 16 gas-fired power plants in operation, under construction or on the drawing boards. Those plants together will cost an estimated $9.1 billion and produce 9,300 MW of electricity. They will create about 7,200 construction jobs. In addition, West Virginia has three plants in development. They would produce 2,050 MW of electricity and cost roughly $2.3 billion. They would create 1,900 construction jobs. That means the 29 gas-fired plants in the Appalachian Basin will cost about $20.5 billion and create more than 16,000 construction jobs, according to Stewart. Natural gas produces 26.7% of electricity in the 13-state PJM Interconnection region. Coal produces 32.2% and nuclear power produces 35.9% and renewables generate 5%.
Residents: Fracking disposal well would make Plum ‘a dumping ground for the oil and gas industry’ – Opening the state’s largest drilling and fracking wastewater disposal well in Plum could lead to earthquakes and contaminated groundwater, according to opponents of the proposal who testified at a state Department of Environmental Protection hearing Monday. More than a dozen speakers urged DEP regulators not to approve a permit sought by at Delmont-based Penneco Environmental Solutions, a subsidiary of Penneco Oil Co. The company wants to convert an old oil and gas well into a wastewater injection well allowed to accept more than 2.2 million gallons of salty and chemically laced fracking wastewater a month.”This injection well would put a lot of young families at risk,” said Angela Billanti, a member of Citizens 4 Plum, a community group opposed to the wastewater injection well. “This, along with new zoning that will allow the drilling of hundreds of shale gas wells, will make Plum Borough a dumping ground for the oil and gas industry.”In addition to accepting more wastewater than any other disposal well in the state, it would be the first such well in Allegheny County. Matt Kelso, a Plum resident and manager of data and technology for the Fractracker Alliance, a non-profit that maps shale gas industry operations, said the potential for earthquakes caused by the disposal well poses a significant risk, not only due to the underlying geology, but also because of the many abandoned mines in the area.”For decades, (the DEP) determined that the subsurface geology of most of Pennsylvania was unsuitable for underground injection. But now they are tasked with overseeing an oil and gas industry that produced 58 million barrels, or 2.4 billion gallons, of toxic liquid waste in 2017 alone,” Mr. Kelso said. “Just because there is more waste to deal with does not make our area suddenly suitable to be a dump for toxic liquid waste.”
Natural gas-fired power plants are being added and used more in PJM Interconnection — The average annual capacity factors for natural gas-fired generators in the PJM Interconnection – the largest competitive wholesale electricity market in the United States – have increased in recent years, reflecting greater use of natural gas-fired generators in the region. The increase in PJM’s capacity factors for natural gas-fired generators is the largest of any regional transmission organization in the country in the past five years (2013 – 2017). Capacity factors are an indicator of how often a generator is run, and the combination of additions of natural gas-fired capacity in the region and higher capacity factors have meant that utilities in the PJM Interconnection have been generating more electricity using natural gas. Similar to the rest of the country, the share of natural gas-fired electricity generation in PJM has increased during the past five years as relatively low natural gas prices have made natural gas more cost-competitive with coal. Much of the increase in generation from natural gas is from generating units using combined-cycle technology. By comparison, the use of natural gas-fired combustion turbines in PJM has remained relatively constant. Average annual capacity factors for natural gas-fired combined-cycle generators in PJM first surpassed those of coal-fired generators in 2015. Relatively lower natural gas prices – in part because of PJM’s proximity to Appalachian natural gas production – have been a primary driver for increasing natural gas capacity factors. The monthly average cost of Central Appalachian coal in the PJM region averaged $2.76 per million British thermal unit (MMBtu) in 2013 and has only slightly increased since then, most recently averaging 3.30/MMBtu in 2017. In contrast, the monthly average price of natural gas at the Texas Eastern Transmission Market Zone 3 (TETCO M-3) hub, which generally reflects natural gas prices in Pennsylvania, New Jersey, and New York, fell below the price of coal on a dollar-per-MMBtu basis in mid-2014 and, with the exception of winter price spikes, has remained lower than the price of coal since then.
Gas leak prompts evacuations Friday near Oil City — An unknown issue at a local oil and gas well site prompted local authorities to evacuate several homes near Oil City Friday evening. Carter County Emergency Management Director Paul Tucker said 20-30 homes were evacuated as a precaution after a natural gas leak was reported at a rural well site in northwestern Carter County. Tucker said the cause for the leak is still unknown and the extent and volume of gas leaked had not been reported. Evacuated residents were allowed to return home early Saturday morning.
Bird’s Eye View of the Mountain Valley Pipeline – The controversial Mountain Valley Gas Pipeline has been under construction since the beginning of the year. Most of the trees on its 300 mile path have been cut and sections of pipeline and were being installed when the project hit a snag last week and a court issued a suspension for construction through streams and waterways. Flying over the Mountain Valley Pipeline last week in a small plane, pilot Hap Endler gets close enough to construction site that it looks a bit like one of those miniature train sets. Long sections of light green colored pipe, 42 inches in diameter, waiting to be buried, are easy to see from the air. But what you can’t see are the hundreds of water ways, some little more than a trickle that cross the pipeline’s path.”A lot of them are very small water bodies and some, including some of the agencies, would tell you, ‘don’t worry about it because they’re small, little streams.’ The problem is those are some of the most valuable and sensitive streams that we have,” says David Sligh with a group called ‘Wild Virginia.'”Those are the homes of the Brook Trout, of the endangered Roanoke Log Perch, of mussels that are found nowhere else in the world. So, the fact that those places are so vulnerable means they should have more protection not less, and we believe, and scientists tell us, that (for) some of these streams, the populations will be wiped out,” Sligh says.We’re being flown over the pipeline, courtesy of a nonprofit conservation organization called Southwings. As we soar over mountainous terrain, interrupted by patchwork quilts of residential areas, farms, small towns and endless trees. Sligh points out what he believes to be violations of proper protocol and safety. But it’s not pipeline construction that has now been halted by the court in the decision announced last Friday. Only the crossing of any of the 383 streams and 142 wetlands in the pipeline’s path,is on hold. And while that makes pipeline construction more difficult, it is not prohibited under the ruling.
Flood carries a piece of the Mountain Valley Pipeline into the hands of opposing landowner – It’s one thing for rain to wash mud and sediment away from where the Mountain Valley Pipeline is being built; that’s happened many times. But when part of the pipe gets swept away, that’s another story. It happened Thursday on Dale Angle’s cornfield in Franklin County. And Angle – who has been complaining for months about runoff from construction damaging his land – says he’s not ready to give Mountain Valley its pipe back. “They called this morning wanting me to sign a permission slip” that would allow company workers onto his property to retrieve two 80-foot sections of steel pipe that floated away, Angle said Friday. “I said I couldn’t do it right now. They’ve done destroyed enough of my property. I’m not going to let them do it again.” In recent weeks, Mountain Valley has been digging trenches to bury a 42-inch diameter pipe that will transport natural gas at high pressure through Angle’s 160-acre farm on its way from West Virginia to a connecting pipeline in Pittsylvania County. Sections of the pipe were laid along the construction right of way and left until they could be lowered into the ground. Two such sections were in a low-lying area, next to where Little Creek enters the Blackwater River, when Thursday’s torrential rains began. Angle, who says the bottom land is often completely covered by flood waters, was not surprised by what happened next. One section was washed about 60 feet from its spot, he said. The other one floated nearly 1,000 feet before lodging against some trees near the banks of the Blackwater. Both had clearly crossed a boundary line drawn earlier this year when Mountain Valley used its legal power of eminent domain to obtain an easement through Angle’s land, despite his fervent opposition. Although construction crews can do as they please along established rights of way and access roads, they must obtain permission before venturing onto adjacent private property.
The Quiet but Furious Nationwide War Against Pipelines – People here have seen what big industry can mean for water. Now fracked gas pipelines are being pushed through Appalachia, not only the one near my house but also the Mountain Valley Pipeline and the Atlantic Coast Pipeline. The MVP and the ACP would originate in northwestern West Virginia and run down through Virginia, parallel to each other about 100 miles apart in routes that will take them through national forests, the Appalachian Trail, waterways, and private land. A report earlier this year from the National Resources Defense Council warned that construction of the MVP and the ACP would cause erosion and stir up sediment in drinking water sources before they were even operational. Amy Mall, a senior policy analyst at the NRDC, told me, “Some people think erosion doesn’t sound so bad, but it’s considered a major source of water pollution. It increases turbidity, which makes it harder for plants and animals to live. Water temperature is also affected. Sedimentation can clog intakes for public water supplies. Quantity can also be impacted. Basically, these construction projects can crush an aquifer, so there’s no water available in a well anymore.” Chemical spills from the drilling process are also a risk, Mall added. After the pipelines are finished, residents will worry about explosions like the one that happened near our house in 2011, or about natural gas leaking out and contaminating their water – according to High Country News, between 2010 and 2017, 17.55 billion cubic feet of natural gas has leaked out of the country’s sprawl of pipes.Naturally, people are angry. Appalachian communities are mounting a stiff opposition to the MVP and the ACP, joining grassroots pipeline resistance around the country and internationally. Since February, local people have launched up to a dozen tree-sits in-the path of the Mountain Valley Pipeline. The tree-sits in the path of the MVP have meant that work crews can’t clear trees or operate heavy machinery without endangering activists. The current tree-sitters, Lauren Bowman and an activist going by the name “Nettle,” climbed to their platforms on September 4 and have been up there for more than a month. Before climbing her tree, Bowman posted a statement to the Appalachians Against Pipelines Facebook page, a group which supports MVP and ACP resistance. She wrote, “I am compelled to fight back against this pipeline because I cannot sit back and ignore what is happening to my home and to the mountains that I have known and loved since I was a child.”
Fragile Pipelines Pose an Increasing Risk in Gas-Hungry US – The kind of dramatic scenes that played out in suburban Massachusetts last month following a series of explosions and fires may serve as a warning of what lies ahead for the U.S., where an increasing reliance on natural gas is running up against aging infrastructure. While there’s no firm conclusion about what caused the series of deadly blasts on Sept. 14, a preliminary National Transportation Safety Board report on the incident released this week says it was linked to work being carried out to replace old pipes. And across the U.S. there’s an awful lot of old pipes: In all, the country has about 80,000 miles of unprotected bare steel and cast or wrought-iron natural gas pipes — enough to wrap around the Earth three times — much of which dates back to the early 1900s. “Aging infrastructure is clearly an issue in the U.S., especially on the East Coast where they have a lot of old cast iron pipes that are well known to fail,” While those lines represent just 3.6 percent of all the pipes that deliver gas to consumers nationally, they pose the highest risk and account for 41 percent of all fatalities, according to the Pipeline and Hazardous Materials Safety Administration. PHMSA, as the regulator is also called, has urged operators to accelerate plans to replace the oldest lines because decades of wear and degradation has made them more brittle and prone to leaks or ruptures from ground movement. Exposure to rain and freezing temperatures is also a problem (modern gas lines installed in towns and cities are made of plastic, which is corrosion-resistant and less brittle, or from protected steel that won’t rust as easily).Utilities continue to spend billions of dollars to replace old lines. In Ohio, for example, the Public Utilities Commission oversees programs undertaken by utilities including Duke Energy Corp. But while those lines are being ripped out and replaced, there’s a huge build-out of new pipelines, driven by the shale-gas boom. And that’s prompted concerns that the regulatory environment hasn’t kept pace.
Cold Snaps Could Trigger Winter Pipeline Constraints in New England, Los Angeles, FERC Says — Forecasters are expecting a warmer-than-average winter this year, but prolonged periods of cold temperatures could still trigger regional pipeline constraints in New York City, Boston and Los Angeles and increase the risk of price volatility, according to the 2018-2019 Winter Energy Market Assessment released Thursday by FERC’s Office of Enforcement (OE). A bomb cyclone last winter drove cash prices north of $100/MMBtu in the Northeast. If similar conditions materialize this winter, “pipeline constraints on Algonquin Gas Transmission, Transcontinental Pipeline, and Tennessee Gas Pipeline could result in high gas prices at Transco Zone 6 near New York City, Algonquin Citygates in ISO New England Inc., and Transco Zone 5 South in PJM Interconnection LLC,” OE said. The National Oceanic and Atmospheric Administration (NOAA) said in a separate winter outlook also released Thursday that it expects warmer-than-normal conditions across much of the northern and western United States. An El Nino event, which often signals wetter-than-average weather in the southern United States and drier conditions in parts of the North, is also likely to develop during the next few months, according to Mike Halpert, deputy director of NOAA’s Climate Prediction Center. “The last winter that was impacted by El Nino was back in 2015-2016,” Halpert said. “However, we’re not anticipating a repeat of that winter, as this El Nino is expected to be much weaker than that one.” Basis futures prices are up 47 cents/MMBtu in New York City and $3.40/MMBtu in Boston compared with the same time last year, OE said, suggesting “a market expectation that both regions may face pipeline transportation constraints this winter.” A 13-cent increase in basis futures price at Dominion South — a point representative of the Marcellus Shale region — “is likely a result of recent increases in pipeline takeaway capacity out of the region leading to a reduction of the local natural gas production surplus.” Basis futures are also up compared with last year at Southern California Border and Southern California Citygates, OE said.In its own Winter Fuels Outlook, released last week, the Energy Information Administration (EIA) said it expects Henry Hub prices during December, January and February to average $3.20/MMBtu, an 8% increase based on increased gas use in the electric power sector, growing natural gas exports from liquefied natural gas (LNG) facilities, and lower-than-average inventory levels.
Natural Gas Breaks Higher – Injections Pick Up The Pace At The 11th Hour – Price volatility in the natural gas futures market is nothing new for the energy commodity that has traded in a range from $1.02 to $15.65 per MMBtu since contracts began trading on the NYMEX division of the CME in 1990.Since the February 2018 high at $3.661 per MMBtu, the energy commodity had traded in a range from $2.53 to $3.053 on the continuous futures contract until the final week of September.The natural gas futures market has been growing, and open interest recently hit a new record at 1,699,571 contracts on October 4. The expansion of the metric is a result of the rising demand for hedging from producers and consumers aside from the speculation players who come to the market to profit from price volatility. On the supply side, quadrillions of cubic feet of the energy commodity in the Marcellus and Utica shale regions of the U.S., technological advances in extraction, and fewer regulations have combined to increase output to record levels.On the demand side, replacing coal with natural gas in power generation and shipments of LNG by ocean vessel around the globe have increased demand as supply rises. The rise in open interest reflects the growing scope of the U.S. natural gas market. As open interest and volumes in a futures markets rise, it can have a dampening impact on price volatility. The wild and explosive moves to levels above $10 per MMBtu in 2005 and 2008 have faded in the market’s rearview mirror. However, the current level of stockpiles going into the season of peak demand is at a level where the price broke above its technical resistance level during the last week of September, and it remained above $3.053 at the end of last week as that price has now become technical support. Over recent weeks, the pace of natural gas injections into storage facilities around the United States has picked up. After an increase in stocks of 46 bcf for the week ending on September 21, they rose by 98 bcf during the final week on September. On October 11, the EIA reported an increase of 90 bcf bringing the total amount of the energy commodity in inventories to 2.956 trillion cubic feet. As the chart shows, stocks were 17.5% below last year’s level and 17% below the five-year average as of October 5. While the injection slightly exceeded the increase last year at 87 bcf, the increases in stocks are coming at the eleventh hour when it comes to preparing for the upcoming peak season for demand of the energy commodity.
Prices Little Changed As Bullish Weather Forecasts Are Offset By Commencement Of New Pipeline Projects — Highlights of the Natural Gas Summary and Outlook for the week ending October 12, 2018 follow. The full report is available at the link below.
- Price Action: The November contract rose 1.8 cents (0.6%) to $3.161 on a 23.0 cent range ($3.368/$3.138).
- Price Outlook: Prices continued higher and established a new weekly high for the 4th consecutive week. However, the market ended near the weekly low as new supply did begin flowing on the Atlantic Sunrise expansion, focusing market attention again on US production. However, there is still no indication of a +100 bcf injection and the chance for a triple digit injection has now passed.
- Weekly Storage: US working gas storage for the week ending October 5 indicated an injection of +90 bcf. Working gas inventories rose to 2,956 bcf. Current inventories fall (639) bcf (-17.8%) below last year and fall (598) bcf (-16.8%) below the 5-year average.
- Supply Trends: Total supply rose 0.4 bcf/d to 82.3 bcf/d. US production fell. Canadian imports rose. LNG imports fell. LNG exports fell. Mexican exports rose. The US Baker Hughes rig count rose +11. Oil activity increased +8. Natural gas activity increased +4. The total US rig count now stands at 1,063 .The Canadian rig count rose +13 to 195. Thus, the total North American rig count rose +24 to 1,258 and now exceeds last year by +118. The higher efficiency US horizontal rig count rose +8 to 927 and rises +141 above last year.
- Demand Trends: Total demand rose +0.9 bcf/d to +69.5 bcf/d. Power demand rose. Industrial demand fell. Res/Comm demand rose. Electricity demand rose +3,127 gigawatt-hrs to 78,378 which exceeds last year by +4,085 (5.5%) and exceeds the 5-year average by 5,364 (7.3%%).
- Nuclear Generation: Nuclear generation fell (5,035)MW in the reference week to 77,759 MW. This is (8,933) MW lower than last year and (4,855) MW lower than the 5-year average. Recent output was at 78,103 MW.
- The cooling season is now over. With a forecast through October 26 the 2018 total cooling index is at 5,629 compared to 4,850 for 2017, 5,495 for 2016, 4,402 for 2015, 3,451 for 2014, 4,811 for 2013, 7,212 for 2012 and 6,709 for 2011.
Natural Gas Winter Prices Rally as Current Cold Snap to Linger Through October – For the second weekend in a row, a bullish turn in the weather outlooks led to a sharp rally in core winter natural gas contracts to start the week, elevating November natural gas prices on Monday by 8.1 cents to $3.242. Spot gas prices also strengthened as the early-season cold snap drove up demand across much of the United States. The NGI National Spot Gas Avg. rose 17 cents to $3.135.
Natural Gas: Just When Things Seemed To Be Going So Well For Trump’s America — October 15, 2018: oh-oh. Maybe the Natural Gas Supply Association spoke too soon. From SeekingAlpha — Bullish weather forecasts again led to a sharp rally in core winter natural gas contracts to start the week, boosting November natural gas prices by more than $0.08 to $3.242/MMBtu, and spot gas jumped $0.17 to $3.135/MMBtu as early-season cold drove up demand across much of the U.S.With unseasonably low temperatures expected to persist through the end of October, NatGasWeather expects the coming weather pattern to further raise storage inventory deficits vs. the five-year average to more than 650 Bcf and likely toward 700 Bcf.The background state will remain bullish for quite some time until record production finally shows signs of improving deficits, “something that’s not expected to happen until after October due to the coming colder-than-normal pattern,” the forecaster says. In the SeekingAlpha note above, the writer suggests the deficit could trend toward 700 Bcf. In the graphic from last week, “stocks were 627 Bcf less than last year at this time and 607 Bcf below the five-year average.
Natural gas jumps on expectations of above-average cold, with supplies at decade low — Natural gas prices jumped Monday on report of below-average cold weather expected across the U.S. at a time when gas supplies are at decade lows.Natural gas futures for November rose 2.6 percent, to $3.242 per million British thermal units.”The updated model from over the weekend showed an early-season cold snap for the bulk of the country, which is the last thing consumers needed to have happen,” said John Kilduff of Again Capital.Natural gas hit a high of $3.37 per mBtu a week ago Tuesday on a cold weather report, but that concern faded and a new 11-day to 15-day forecast shows a blast of cold across the U.S., particularly in the South and in the Midwest. “It’s a different pattern,” said Jacob Meisel, Bespoke Weather Services chief weather analyst. “You’re seeing more risk that cold air masses get trapped across the East. Before, it looked like we’d get warm Pacific air into the East.”Meisel said this year’s weather pattern has been unusual, and it coincides with extremely low supply. “My early thoughts are for a warmer November into December and then some colder risk in January but primarily February,” he said. “In October, we’re actually looking at a top-five cooling demand days and a top-five heating demand. We started with near-record heat, and we flipped to cold. You always expect to get several weeks of low energy demand, and that’s not happening.”
Bullish Weather Forecasts Send Natural Gas Injections Lower – We expect a +85 Bcf change in the storage report for the week ended October 12. A storage report of +85 Bcf would compare with +50 Bcf last year and +79 Bcf for the five-year average. Natural gas storage is expected to be 3.177 Tcf by November 9. That’s 671 Bcf below the five-year average. You can see that in the chart above and below: Sadly for the natural gas bears, the weather models showed increasingly cooler than normal conditions over the weekend resulting in further downward revisions in our natural gas injections.In addition, the latest ECMWF-EPS long-range outlook flipped from a bearish outlook in early November to a bullish one. Yes, the weather has been consistently turning bullish. With the latest weather forecast update, we will no longer be initiating a new DGAZ position as we wrote about last week. Given that we are now entering a period where weather model volatility dictates the movements in natural gas prices, we will need to avoid shorting into a bullish outlook such as this one. Of course, the daily model updates are more important, so we will be keeping a close eye on that, but so far, it’s not supportive for the bears. As the weather turns bullish and heating demand gets an early start, we can see the overall increase below. The bump up we are seeing in 2018 is materially higher than the two previous years. This also is another reason why the natural gas storage deficit to the five-year average is expected to increase into November. On the supply side, we are seeing lower Canadian gas net imports due to a pipeline accident in Western Canada. Enbridge is currently trying to fix the rupture with no return date just yet: Overall, the natural gas market continues to be well supported due to a bullish weather outlook. The early bearish November outlook has now flipped to a bullish one, so we will not be initiating any new short position on the back of this update.
NYMEX November gas jumps 8.1 cents on weather-related issues, storage concerns – The NYMEX November natural gas futures contract jumped 8.1 cents and settled at $3.320/MMBtu Wednesday, largely driven by erratic weather and storage concerns. The front-month contract traded between $3.240/MMBtu and $3.338/MMBtu so far in the session. “Natural gas prices are getting a bounce because of the weather,” said Phil Flynn, senior market analyst at Price Futures Group. The National Weather Service calls for a likelihood of below-average temperatures to continue across much of the Midwest, Northeast, Southwest and Texas, while above-normal temperatures are in the forecast for the rest of the US over the next six to 10 days. These extreme weather conditions during the shoulder season are providing support for prices, Flynn said. The offsetting weather patterns have resulted in cooling demand extending deep into the shoulder season along with a rise in heating demand. Residential and commercial demand rose over the past seven days and is estimated to stand at 23.7 Bcf Wednesday, according to data from S&P Global Platts Analytics. Over the next seven days, heating demand is set to average 24 Bcf/d, up from 16.9 Bcf/d in the year-ago period. The lingering cooling demand and strengthening heating demand is likely to cut into injections, dampening the market’s expectation of a reduced storage deficit during the fall injection season, despite elevated production levels. “As we get closer to winter, the market is getting more and more nervous about [the storage deficit],” Flynn said. A consensus of analysts surveyed by S&P Global Platts expects an 83-Bcf injection for the week that ended October 12, down 7 Bcf from the strong build of 90 Bcf announced last week by the US Energy Information Administration, but largely in line with the five-year build of 79 Bcf for the same time.
November Natural Gas Plunges 12 Cents as Cold Seen Breaking Down; Spot Gas Crashes –A pullback in heating degree days for the end of October/early November laid the groundwork for a dramatic sell-off in natural gas futures Thursday that was further pressured by Lower 48 gas production returning to near record highs in recent days. With no surprises on the storage data front, the Nymex November gas contract went on to settle at $3.198, down 12.2 cents
EIA expects US natural gas production to jump nearly 1 Bcf/d – With four regions expected to see triple-digit increases from October to November, U.S. natural gas production from the lower 48 states’ seven most productive shale plays will jump nearly 1 billion cubic feet per day, according to Kallanish Energy.The most recent issue of the Drilling Productivity Report, which is produced by the Energy Information Administration, projects total production from the seven regions will increase by 957 million cubic feet per day (Mmcf/d), to 74.06 billion cubic feet per day, from 73.10 Bcf/d.The Appalachian Basin – the combined Marcellus and Utica shales – is expected to see the biggest month-to-month increase in gas production. The report projects an increase of 337 Mmcf/d, to 29.79 Bcf/d, from 29.45 Bcf/d.
Natural Gas Production From Big Seven Plays to Reach 74.06 Bcf/d in November, EIA Says– The U.S. Energy Information Administration (EIA) is projecting production from the nation’s seven most prolific onshore unconventional plays — the Anadarko, Appalachian and Permian basins, and the Bakken, Eagle Ford, Haynesville and Niobrara formations — will increase in November, continuing a nearly two-year trend, with natural gas output forecast to reach 74.06 Bcf/d and oil production an estimated 7.71 million b/d. In its latest Drilling Productivity Report (DPR), released Monday, the EIA said it expects total gas production from the the seven key regions this month to reach 73.1 Bcf/d and oil production to be 7.61 million b/d.The plays have been on a roll since January 2017, when EIA estimated total gas production was 47.51 Bcf/d and total oil production was an estimated 4.54 million b/d.Natural gas production in November is expected to increase the most in the Appalachian Basin, which includes the Marcellus and Utica shales. Production is expected to reach 29.77 Bcf/d, up from 29.45 Bcf/d in October.EIA said it also is forecasting increased production in the Anadarko (7.4 Bcf/d from 7.31 Bcf/d), Bakken (2.56 Bcf/d from 2.53 Bcf/d), Eagle Ford (7.24 Bcf/d from 7.12 Bcf/d), Haynesville (9.74 Bcf/d from 9.63 Bcf/d), Niobrara (5.21 Bcf/d from 5.136 Bcf/d) and Permian (12.13 Bcf/d from 11.89 Bcf/d).Oil production is expected to increase in six of the seven plays. More than half of the increase is expected to come from the Permian, which is projected to hit 3.55 million b/d in November from 3.5 million b/d in October.Oil production is expected to reach 572,000 b/d in the Anadarko, 132,000 b/d in Appalachia, 1.35 million b/d in the Bakken, 1.44 million b/d in the Eagle Ford and 626,000 b/d in the Niobrara. Haynesville production is expected to remain flat at 43,000 b/d.The number of drilled but uncompleted (DUC) wells across the Big Seven ended September at 8,389, an increase of 192 from August, according to EIA.The bulk of the DUCs, and the largest increase in DUCs, came in the Permian, which rose 194 in September to 3,528. DUCs increased by 31 in the Anadarko to 1,045 and by 18 in the Eagle Ford to 1,584. DUC numbers decreased from August in Appalachia (minus 22), Bakken (minus 11), Haynesville (minus 3) and Niobrara (minus 15). The productivity of new oil wells in the Big Seven plays is expected to increase in November to 668 b/d, according to the DPR. New-well gas production per rig is also expected to increase to 3.79 MMcf/d.
EIA Oct ’18 Drilling Report: Shale Gas Output Up Another 1 Bcf/d – Last month the U.S. Energy Information Administration’s (EIA) monthly “Drilling Productivity Report” (DPR) estimated that this month (in October) the country’s seven major shale plays would produce an amazing, all-time high of 73 billion cubic feet per day (Bcf/d) of natural gas production (see EIA Sep ’18 Drilling Report: Shale Output Flies Past 73 Bcf/d). EIA issued the October DPR yesterday (with numbers for November) and once again, production is going up. EIA estimates November production will hit 74 Bcf/d – another record-breaker.Month after month production in the Marcellus/Utica region, called “Appalachia” in the report, goes up roughly 1/3 Bcf. And yes, it happens again for November. EIA predicts Appalachia production will hit 29.8 Bcf/d – a full 40% of all shale gas production in the U.S., up 337 million cubic feet per day (~1/3 Bcf) from last month.Shale oil production also continues to rise in the coming month – from 7.6 million barrels this month to 7.7 million barrels next month. Below are the three charts the EIA doesn’t include in the official PDF of the report (for whatever reason). We think these are the three best charts they issue each month.Note the third chart above, DUCs (Drilled but UnCompleted wells). A DUC happens when drillers put the initial hole in the ground, including the lateral, but they don’t finish the job by fracking the well and bringing it online into production.In our region the DUC number went down by 22, indicating we’re drilling fewer new wells and completing and bringing online already-drilled wells instead. We’re burning off our DUC inventory. That’s been a trend for a number of months.A big surplus in DUCs (like that in the Permian) means they’re drilling holes in the ground like crazy and mothballing wells, waiting for new pipelines to connect them (or prices to go up) before bringing them online. The Permian adding over 100 DUCs a month has also been a trend for a number of months.
Low U.S. gas market stocks tempered by mild El Nino forecast –– U.S. natural gas stocks are going into winter at the lowest level for fifteen years despite a slightly faster rate of injections into storage over the summer than in 2016 or 2017. Low inventories have encouraged hedge funds to build their largest position in futures and options for more than eight years and pushed benchmark prices to their highest level for almost nine months. But pressure on stocks and prices is being tempered by the development of El Nino conditions over the Pacific which should lead to a relatively mild winter for much of the country. Higher prices will encourage power producers to run gas-fired units for fewer hours in the coming weeks and increase generation from coal, which has been languishing at multi-decade lows. The resulting switch from gas to coal should help boost gas stocks faster than normal in the remainder of the injection season and limit drawdowns in the early stages of the winter heating season, conserving scarce stocks. If the winter starts with prolonged cold periods in November and December, however, the gas market could come under severe pressure, with prices spiking. Working gas stocks in underground storage reached 3,037 billion cubic feet (bcf) on Oct. 12, according to the U.S. Energy Information Administration (“Weekly natural gas storage report”, EIA, Oct. 18). Stocks have risen by 1,688 bcf since the injection season started on April 1, compared with increases of 1,586 bcf in 2017 and 1,325 bcf in 2016 (https://tmsnrt.rs/2J76aKS ). Even so, gas stocks are the lowest level since 2003, and the market has struggled to eliminate the deficit to the five-year average that developed during the long cold winter of 2017/18. Until a few weeks ago, most traders appeared unconcerned by low inventories and benchmark futures prices were stuck below $3 until the final week of September. Since then, hedge funds and other money managers have turned strongly bullish, increasing their net long position in futures and options by nearly 1,500 bcf over the last three weeks. Portfolio managers’ net long position is the highest for 35 weeks, according to position records published by the U.S. Commodity Futures Trading Commission.
EIA data show weekly U.S. natural-gas supply above 3 trillion cubic feet for first time since Dec. 2017 – The U.S. Energy Information Administration reported Thursday that domestic supplies of natural gas rose by 81 billion cubic feet for the week ended Oct. 12. Consensus estimates called for build near 85 billion, according to Schneider Electric. Total stocks now stand at 3.037 trillion cubic feet, down 601 billion cubic feet from a year ago, and 605 billion below the five-year average, the government said. Stocks in storage haven’t topped 3 trillion since late December 2017, EIA data show. November natural gas NGX18, +1.03% traded at $3.259 per million British thermal units, down 6.1 cents, or 1.8%, from Wednesday’s settlement. It was trading at $3.247 before the supply data.
October 19 Natural Gas Weekly: Injection Season Is Likely To End In The 2nd Week Of November – We estimate that aggregate demand for American natural gas (consumption + exports) totaled around 530 bcf for the week ending October 19 (up 3.7% w-o-w and up as much as 15.0% y-o-y). The deviation from the norm stayed positive but increased marginally from +27% to +29% (see the chart below). According to our calculations, aggregate demand for U.S. natural gas (on a weekly basis) has been above 9-year norm since February 24, 2017. Last week, the weather conditions cooled down significantly across the country – but particularly in the Central, Midwest, and Southwest parts of the U.S. We estimate that the number of nation-wide heating degree-days (HDDs) has more than doubled in the week ending October 19, while the number of cooling degree-days (CDDs) dropped by 50% w-o-w to the point where they are no longer having any meaningful effect on consumption. In addition, non-degree-day factors – such as higher nuclear outages – spurred extra consumption in the Electric Power sector. Overall, total energy demand (measured in total degree-days) should be above last year’s level by no less than 60%. Total exports dropped by 6% w-o-w, mostly due to weaker LNG sales (because of the base effect). According to Marine Traffic data, Sabine Pass served only four LNG tankers this week (total natural gas carrying capacity of 13 bcf), whereas last week, it served six vessels (total carrying capacity of 20 bcf). Despite the fact that flows to liquefaction at Cove Point have resumed (after a three-week maintenance), the terminal has not yet supplied any vessels since mid-September.We estimate that dry gas production has been expanding in annual terms for 72 consecutive weeks now. However, the daily rate of output has been unable to set a new all-time high for 24 days now. Currently, we project that dry gas production will average 88.2 bcf/d in October, 87.4 bcf/d in November, and 87.2 bcf/d in December. The aggregate supply of natural gas (production + imports) averaged around 93.0 bcf per day for the week ending October 19 (up 12.0% y-o-y, but down 0.3% w-o-w). Overall, total unadjusted supply/demand balance should be positive at around 119 bcf. The volume is some 20 bcf smaller than a week ago and 10 bcf below 5-year average for this time of the year (see the chart below).
Gulf Coast LNG Heading to Poland Under Long-term Deal –Polish Oil and Gas Co. (PGNiG) and Venture Global has signed 20-year sales and purchase agreements under which the former will receive U.S.-sourced liquefied natural gas (LNG) for domestic customers or for resale, Venture Global reported Wednesday. “These are the first long-term contracts for purchase of LNG from the U.S. announced in Central Europe,” Maciej Woźniak, vice president of PGNiG’s management board for trade, said in a written statement emailed to Rigzone. “The contract conditions in the USA are very attractive. The LNG price is based on the American Henry Hub index along with liquefaction costs.” The agreements will enable PGNiG to purchase LNG on a free on board (FOB) basis when commercial operations begin at the two LNG export facilities Venture Global is developing in South Louisiana, Venture Global stated. The company’s Calcasieu Pass LNG facility near Lake Charles is slated to start commercial operations in 2022 and its Plaquemines LNG project near New Orleans the following year, the company added. Under the deals, PGNiG will purchase 2 million tons per annum (mtpa) of LNG – 1 mtpa from each facility – for two decades. Venture Global stated the FOB arrangement means that it, as the seller, will deliver LNG to a tanker ship at the loading port and that the purchaser PGNiG will freely dispose of the load – including decide on the cargo destination. “Recently signed contracts are a milestone towards building PGNiG’s position in the global liquefied natural gas market,” noted Piotr Woźniak, president of PGNiG’s management board. “Thanks to the FOB formula, we will be able to decide, independently and based on our needs at a given time, whether the purchased LNG load should be directed to Poland or be used for further trading through our London office.” The 2 mtpa of LNG amounts to roughly 2.7 billion cubic meters of natural gas after regasification, Venture Global stated. Based on vessel capacity, that equates to more than 25 cargoes a year, the company added.
Bayou Bridge pipeline meets resistance from the L’eau Est la Vie camp – The swamps of southern Louisiana, a territory of the Atakapa-Ishak tribe, are the grounds of pipeline resistance as communities are rising to stop the Bayou Bridge pipeline (BBP).The 163-mile pipeline would transport crude oil from the Bakken oil fields of North Dakota and connect with the infamous Dakota Access Pipeline (DAPL) system to refineries in St. James Parish, Louisiana. The company behind the BBP, Energy Transfer Partners (ETP), is the same company responsible for the DAPL, which had police violently fend off peaceful Water Protectors at Standing Rock in 2017. The BBP was approved in December that year by the Army Corps of Engineers, and construction began at the end of January 2018. But on February 27, a preliminary injunction was issued to block the completion of an extension of the BBP because the Army Corps of Engineers had not met all the environmental assessment requirements. Despite this injunction, ETP continued construction with plans to complete the pipeline by the end of 2018.Pipeline construction would cut through the southern end of the Atchafalaya Basin, one of the last critical swamp habitats in the world, which is home to more than 65 species of reptiles and amphibians and more than 200 species of birds and fish. The pipeline path would cross 600 acres of wetlands and 700 bodies of water, some of which reportedlyprovide drinking water for around 300,000 families. Geographically speaking, southern Louisiana is greatly threatened by climate change impacts from flooding and intensified hurricanes, and the wetlands that the BBP could potentially destroy are vital sponges for floodwaters. If built, this pipeline would create the carbon equivalent of 30 new coal plants, which is contradictory to current climate change global mandates to reduce carbon emissions.The BBP would eliminate southern Louisiana’s best defense against climate crises while simultaneously contributing to intensified effects of climate change from its carbon emissions.
Oil Majors Offload Gulf of Mexico Fields to Hunt Bigger Finds — Big Oil is giving up looking for singles and doubles in the Gulf of Mexico: Now it’s home runs or bust. Exxon Mobil Corp. and Royal Dutch Shell Plc, the world’s two biggest oil companies, have put a slew of assets in the Gulf up for sale in recent weeks, while Brazil’s state-run Petrobras this week sold the bulk of its production in the region to mid-cap explorer Murphy Oil Corp. The majors are not leaving the Gulf altogether but they are shifting priorities. They’re using oil’s climb to a four-year high above $86 a barrel to offload older assets that are past their peaks to focus on bigger, more profitable discoveries, either in the deepest reaches of the Gulf or unexplored seas elsewhere in the world. The message is clear: Go big or go home. “When oil was in the doldrums, companies were much happier to sit on assets that performed as expected,” said Oma Wilkie, a senior analyst at RS Energy Group. “But with Brent pushing $80, they can hopefully get top dollar for assets that are OK but not the best in the portfolio.” The sales come at a time when production from the Gulf has reached record levels — 1.85 million barrels a day — but has been dwarfed by the growth of onshore shale. The region now makes up just 17 percent of U.S. total production, down from 27 percent a decade ago. Exxon, Shell and Petrobras may have all put ‘for sale’ signs up but their reasons for doing so are different.
‘The Guy Who Defended Company That Caused Worst Oil Spill in US History’ Just Confirmed to Head DOJ’s Environmental Division — Democratic Sens. Joe Manchin (W.Va.) and Claire McCaskill (Mo.) joined with Senate Republicans on Thursday to confirm Jeffrey Bossert Clark – a climate-denying former attorney for the fossil fuel industry – to lead the Justice Department’s Environment and Natural Resources Division. “Clark’s blatant hostility toward environmental protection is good news for polluters, but awful news for the rest of us,” warned Environmental Working Group (EWG) president Ken Cook. “The guy who defended the company that caused the worst oil spill in U.S. history is not likely to aggressively go after corporate environmental outlaws.” The new assistant attorney general’s nomination has been stalled for more than a year due to concerns about his history as a lawyer. Clark has represented B.P. in lawsuits that stemmed from the 2010 Deepwater Horizon oil spill and the U.S. Chamber of Commerce in suits attacking the U.S. government’s authority to craft regulations that aim to cut greenhouse gas emissions.
Texas uses $100m from 2010 oil spill settlement for coast — – Officials say more than $100 million from a settlement after the 2010 Deepwater Horizon oil spill in the Gulf of Mexico has been spent on restoring Texas coastal habitat. The Houston Chronicle reports details were announced Monday night during a public meeting in Galveston. Trustees of the Texas Implementation Group offered the update on how the overall $238 million in damages were being spent.The money comes from a 2016 settlement with BP, which leased the Deepwater Horizon rig that exploded in April 2010. The accident killed 11 workers and dumped millions of barrels of oil into the Gulf.Texas funds so far have been used to restore sea turtle, bird, and oyster coastal and wetland habitats, plus recreational improvements such as artificial reefs for fishing and diving.
LNG Project in South Texas Advances – NextDecade Corp. has secured a draft environmental impact statement (EIS) from the Federal Energy Regulatory Commission (FERC) for its Rio Grande LNG project near Brownsville, Texas, along with its associated Rio Bravo Pipeline, the company reported Friday afternoon. “We appreciate the FERC staff’s continued commitment to the review of our project,” Matt Schatzman, NextDecade’s president and CEO, said in a written statement. “The draft EIS represents a culmination of several years of analysis and evaluation in conjunction with multiple federal, state and local agencies and stakeholders.”FERC, which reviews and permits LNG facilities in the United States, issued the draft EIS as required by the National Environmental Policy Act. The document follows a detailed review of environmental, engineering, social and other aspects of NextDecade’s proposed project. The 27-million-tonne-per-annum Rio Grande LNG export facility would receive natural gas from the Agua Dulce gas hub near Corpus Christi via the company’s 4.5 billion cubic foot per day Rio Bravo Pipeline. FERC will issue a final EIS April 26, 2019, and has established a 90-day Federal Authorization Decision Deadline July 25, 2019, NextDecade stated. Pending a favorable FERC order, NextDecade stated that it expects to make a final investment decision on the project during Third Quarter 2019. In a 2017 interview with Rigzone, NextDecade founder and then-CEO (and current board chair) Kathleen Eisbrenner said the project could produce first LNG in 2022.
1 MMbpd Pipeline to Link Permian to Deepwater Ports – JupiterMLP is building a 670-mile oil pipeline linking the Permian to Texas’ three deepwater ports. JupiterMLP, LLC anticipates a November open season for capacity on the 1 million barrel per day (MMbpd) crude oil pipeline it plans to build from the Permian Basin to Brownsville, Texas, the privately held midstream company announced Wednesday afternoon. Jupiter made the announcement after securing a funding commitment from Charon Systems Advisors that it reported is sufficient to build the approximately 670-mile pipeline, which it expects to become operational in Third Quarter 2020. “With the backing by Charon and the firm commitments that Jupiter has already secured on the Jupiter Pipeline, we will be holding an open season for the remaining capacity in November,” Albert Johnson, president of Jupiter Pipeline LLC, said in a written statement. “We are excited about our investment in Jupiter pipeline along with Jupiter management and our investment partners,” noted Adrayll Askew, partner of Charon. “We are fully committed to Jupiter’s long-term global strategy that focuses on the integration of the midstream supply chain and distribution of Permian crude oil to the world.” According to Jupiter, the pipeline’s Permian Basin origination points will be located near Midland, Pecos and Crane, Texas, and its offtake points will be near Three Rivers, Texas. The company added that it has completed engineering, design and right-of-way planning for the pipeline, which will directly link to Kinder Morgan’s Double Eagle and Crude & Condensate pipeline systems. As designed, the pipeline will be the only such conduit out of the Permian that can access Texas’ three deepwater ports – in Houston, Corpus Christi and Brownsville – and will enjoy direct access to a fully capable very large crude carrier (VLCC) facility, Jupiter added. In May, Jupiter announced that it had received all initial governmental and regulatory permits to load and unload vessels of up to 65,000 deadweight tons or Panamax-sized vessels at its Jupiter Export Terminal. The company is building the crude upgrading, processing and export terminal on a 270-acre site at the Port of Brownsville. Jupiter has already secured permits to construct more than 2.8 million barrels of storage in Brownsville and has additional permits on file to boost its storage capacity to more than 6 million barrels, the company stated Wednesday. In addition, it reported that it is in the final stages of securing a permit to construct a 170,000-barrels per day processing facility to convert light crude into on-spec gasoline and ultralow sulphur diesel.
West Texas pipeline to resume on schedule after spill, Company Says – Energy Transfer Partners LP said on Monday that a West Texas pipeline would resume operations on Saturday as planned after the pipeline spilled water with nontoxic green dye and residual crude oil near Abilene, Texas. The spill went into Button Willow Creek and then into Canyon Rock Lake during a recent test, Energy Transfer Partner said. It did not specify when the spill occurred, and the company could not immediately be reached for further comment. The spill involved an undisclosed amount of water, which contained “a very small amount of residual crude oil,” the Dallas pipeline operator said in an email. The area has been contained, crews have begun cleaning up the spill and no changes have been made to the pipeline’s maintenance schedule, spokeswoman Vicki Granado said in the email. The West Texas Gulf Pipeline is owned by Sunoco Logistics Partners LP, which is owned by Energy Transfer. The pipeline runs from Colorado City, Texas, to Longview, Texas, connecting there to the Mid-Valley long-haul pipeline system that transports crude to refineries in the Midwestern United States.
EPA Weighs Allowing Oil Companies to Pump Wastewater Into Rivers, Streams – For almost as long as there have been oil wells in Texas, drillers have pumped the vast quantities of brackish wastewater that surfaces with the oil into underground wells thousands of feet beneath the earth’s surface. But with concern growing that the underlying geology in the Permian Basin and other shale plays are reaching capacity for disposal wells, the Trump administration is examining whether to adjust decades-old federal clean water regulations to allow drillers to discharge wastewater directly into rivers and streams from which communities draw their water supplies. Technically speaking, drillers are allowed to do this in limited circumstances under federal law, but the process of cleaning salt-, heavy metal- and chemical-laden wastewater to the point it would meet state or federal water standards is so costly that it’s rarely done, experts say. “Technology is changing. At some point, if your disposal options are limited or it becomes so expensive you’re having to truck water to be disposed of several hundred miles away, companies will do it,” said Jared Craighead, legal counsel to Texas Railroad Commissioner Ryan Sitton. “It might not make sense today but maybe in a year or two.” The Environmental Protection Agency is consulting with experts and conducting public meetings around the country toward making a decision next summer, said Lee Forsgren, deputy assistant administrator at EPA’s Office of Water, Tuesday in Washington. “We’re very much in a listening mode now,” he said. The primary question facing the EPA is whether water standards can be adjusted so oil and gas companies can economically treat wastewater to be pumped into the water supply without contaminating drinking water supplies or killing off local wildlife.
DUCs continue climbing in Lower 48 – The number of drilled, but uncompleted wells located in the most productive/busiest basins/plays in the Lower 48 U.S. states continues to rise, up 2.3% from August to September, the Energy Information Administration’s Drilling Productivity Report (DPR) found. The number of so-called DUCs rose by 192 from August to September, even though just three of the seven regions surveyed reported an August-to-September increase, Kallanish Energy finds. The largest number of DUCs was in the Permian Basin, up 194, to 3,722 DUCs in September, from 3,528, the October DPR found. The next-largest increase was in the Anadarko, up 31 DUCs, or 3.1%, to 1,045, from 1,014. Four of the seven major drilling basins/plays reported a drop in DOCs, although the total decrease was just 51. The biggest August-to-September drop was in Appalachia (the Marcellus and Utica Shale plays combined), which reported a 22-DUC drop, to 665, from 687, the October DPR reported.
Enbridge outlines $1.4 billion worst-case scenario spill – A worst-case oil spill on Enbridge’s planned new oil pipeline across northern Minnesota would cost an estimated $1.4 billion, a little more than the price of the company’s mammoth spill in Michigan eight years ago. Enbridge was required to come up with the worst-case scenario by the Minnesota Public Utilities Commission (PUC), which conditionally approved the company’s new Line 3 pipeline in June. Calgary, Alberta-based Enbridge filed the cost estimate Tuesday with the PUC, noting that the worst-case spill would involve pipeline ruptures near the Red, Mississippi or Red Lake rivers. The PUC will use the information in determining Enbridge’s financial liabilities for a major spill. Before the PUC signs off completely on the controversial $2.6 billion Line 3 project, Enbridge has to meet several conditions, and the most critical involves its corporate guarantee and insurance coverage for spills. To calculate the worst case, Enbridge assumed a “full-bore rupture scenario where the pipeline is shut down and isolated after 13 minutes from the release occurring,” the company said in a PUC filing. In that 13 minutes, “a conservative response time,” the break would be detected, pumps would be shut down and valves closed, the filing said. The largest costs would involve mopping up environmental damage, including spill containment site cleanup and remediation. The damage costs incurred by businesses located near a pipeline break also would be significant, as would costs to Enbridge’s reputation, the filing said. “The report confirms Enbridge has the ongoing financial ability to cover cleanup costs in the unlikely event of a worst-case pipeline release in a high consequence area,” the company said in a statement. “This engineering analysis, by design, did not take into account timely response or mitigation efforts.”
Tight Oil, Shale to Drive Majors’ Output to New Highs -In a new report released by Wood Mackenzie, the potential of unconventionals in the Lower 48 is examined by looking at five U.S. majors (BP plc, Chevron Corp., Equinor ASA, Exxon Mobil Corp. and Royal Dutch Shell plc). “Following BP’s $10.5 billion deal with BHP, all of the supermajors have a footprint in the Permian Basin, and are poised to deliver an unprecedented phase of production growth that will see output reach new highs over the next decade,” Roy Martin, research analyst in WoodMac’s corporate upstream team, said in a release. In terms of value and volume, tight oil and shale gas will be essential to the majors’ portfolios. In fact, without their volumes, collective production from the majors would enter long-term decline from 2020, WoodMac finds. By the mid-2020s, U.S. unconventionals will generate $15-$20 billion of yearly cash flow and account for 20 percent of total upstream value. “U.S. unconventionals will drive the majors’ output to new highs,” said Martin. “Their investment in the resource theme is set to nearly double over the next five years, underpinned by tight oil.” “We think the advantages of scale in U.S. unconventionals will continue to manifest themselves as the industry shifts close to a ‘big company’ business – almost resembling conventional oil developments,” he added. The big player here seems to be ExxonMobil, who has the most acreage, biggest resource and highest peak production. Martin said no other major has comparable diversity across the Permian, Bakken, Eagle Ford, Haynesville and Marcellus plays. He also called BP’s deal with BHP “transformational” and makes it possible for BP to overtake Exxon to become the leading shale gas producer.
U.S. Shale’s Glory Days Are Numbered -There are some early signs that the U.S. shale industry is starting to show its age, with depletion rates on the rise.A study from Wood Mackenzie found that some wells in the Permian Wolfcamp were suffering from decline rates at or above 15 percent after five years, much higher than the 5 to 10 percent originally anticipated. “If you were expecting a well to hit the normal 6 or 8 percent after five years, and you start seeing a 12 percent decline, this becomes more of a reserves issue than an economics issue,” said R.T. Dukes, a director at industry consultant Wood Mackenzie Ltd., according to Bloomberg. As a result, “you have to grow activity year over year, or it gets harder and harder to offset declines.”Moreover, shale wells fizzle out much faster than major offshore oil fields, which is significant because the boom in shale drilling over the past few years means that there is more depletion in absolute terms than ever before. A slowdown in drilling will mean that depletion starts to become a serious problem.A separate study from Goldman Sachs takes a deep look at whet


