from the St Louis Fed
— this post authored by Subhayu Bandyopadhyay and Rodrigo Guerrero
Immigration into the U.S. is unevenly distributed across its different states. Although the share of the foreign-born population in the U.S. as a whole is 14.2 percent, that of individual states ranges from a high of 28.1 percent in California to a low of 1.9 percent in West Virginia.[1] These differences factor into policy debates. For example, tax revenue that is collected from immigrants and taxpayer money that is spent on immigrants affect states’ budgets. In this article, we first discuss some factors that can influence the level of immigration to a state; then, we present some facts regarding immigration levels in different states.

State-Level Factors
Immigrant stock in a state is due to both legal and unauthorized immigration. Legal immigration is determined at the national level by the federal government. However, after being admitted into the U.S., an immigrant is free to choose the state of location. In turn, this implies that states do not have control over legal immigration, and their respective legal immigrant shares are determined by their relative desirability in the eyes of an immigrant. States with better job opportunities, greater public amenities, and more favorable social or ethnic networks will attract more immigrants.
Unauthorized immigration, by its very nature, is not directly a policy choice. However, both state and federal policies can influence states’ unauthorized immigrant shares. For example, if there is greater enforcement by the federal government at the border, then unauthorized immigration into the country is reduced; this, in turn, will reduce inflows into the states. Similarly, if one state is stricter than a neighboring state in verifying the immigration status of potential employees, unauthorized immigration to the first state may be discouraged, and the flow might be diverted to the neighboring state.
We used data on foreign-born residents of a state as a proxy for current and past immigration flows. Admittedly, this measure is imperfect because it lumps together naturalized citizens and foreign-born individuals whose parents are both natives, as well as legal and unauthorized immigrants. However, we used the data because of its accessibility and reliability. Indeed, if a state is more attractive to immigrants, one would expect it to get a larger inflow of immigrants, which should be reflected in a correspondingly higher level of foreign-born residents.
States’ Shares
Figure 1 presents the share of foreign-born populations of different U.S. states. The horizontal line, at 14.2 percent, represents the share of the U.S. population that was born abroad. Only 14 states are above this national average. This implies that immigrants favor only a few states; alternatively, a few states are more hospitable than others for immigrants.
Figure 1
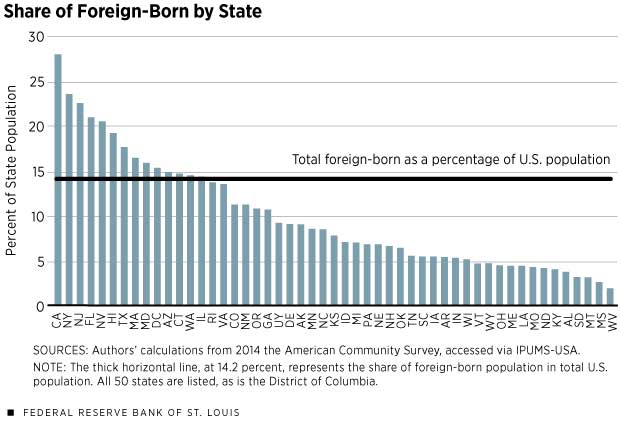
The distribution of foreign-born shares across states might also point toward an accumulation effect: a higher share of foreign-born may lead to a higher immigrant inflow. California and New York are the top two destinations for the foreign-born, while Mississippi and West Virginia have the lowest shares. Most states in the top five destinations either have major urban centers or are relatively close to the border. In contrast, the lowest five tend to be more sparsely populated or are interior states. Although urban centers like New York City or Los Angeles are likely to attract immigrants for a variety of reasons, including ethnic networks on which fresh immigrants can rely, distance from the border also plays a role, especially for immigrants from a neighboring poorer nation like Mexico.
Immigrants’ Home Countries
Figure 2 shows the top origin nations of the immigrants. Mexico is the largest source nation, providing about 4 percent of the U.S. population, followed by India, China and the Philippines. India contributes less than a quarter of the share that Mexico contributes. This overwhelming weight of Mexico stems from its proximity to the United Sates. Canada is also a bordering nation, but it is closer to the U.S. in terms of its level of economic prosperity than is Mexico, and, hence, the incentive for Canadians to migrate to the U.S. is not comparable to that for Mexicans.
Figure 2
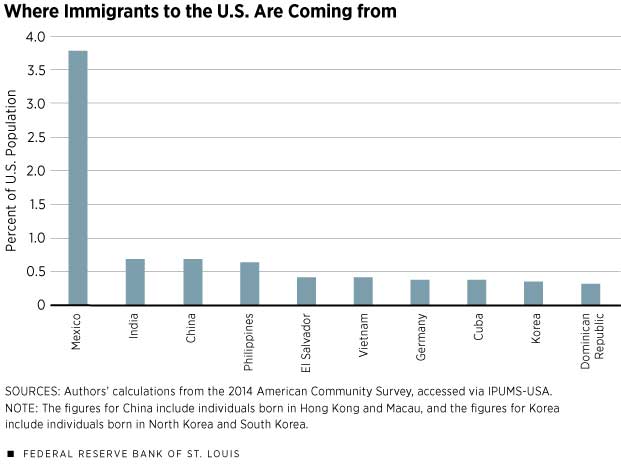
States bordering Mexico (Arizona, California, New Mexico and Texas) all have Mexico as the leading source nation of immigrants. Similarly, Florida shows Cuba as the top source nation because of Florida’s geography and history. On the other hand, New Jersey has India as its largest source nation. This suggests that distance between source nations and potential destination states might be an important factor for countries that are relatively close to the U.S. (e.g., Mexico or Cuba), but not as much for distant countries like India. New Jersey may be drawing people of Indian origin due to economic and social opportunities.
Why One State over Another
A definitive answer is beyond the scope of this article. We offer some correlations – imprecise as they are – of state foreign-born stocks with potential state-level factors that may affect immigration.
The table lists these correlations for Mexico as the source nation and all the U.S. states as potential hosts. Using Mexico as the sole source nation keeps our analysis simple and tractable. Mexico is a reasonable benchmark, given its overwhelming weight as a source of the foreign-born population in the U.S.
Distance between a state and Mexico City is negatively correlated with the state’s Mexican-born share. [2] So, proximity matters. On the other hand, per capita income of a state does not seem to be very indicative of where an immigrant locates. More important is its total income (i.e., gross state product, or GSP) and its total population. Perhaps this is because a sparsely populated state may have high per capita income but may not offer a potential immigrant the same opportunities of life that may be available in a larger and more urban state, where more publicly provided goods like public transportation in urban areas or accessible public education may turn out to be immigrant magnets.
Policy Coordination Is Key
Clearly, immigrants are spread out quite unevenly across different U.S. states and come from many nations. This dispersion presents both challenges to the states and opportunities for them. Accordingly, sensible immigration policy for the nation critically depends on the coordination and cooperation between the federal and state governments.
State Variables That May Influence Where Immigrants Move:
A Case Study Using Mexico
| Mexico-Born Share of State Population | |
|---|---|
| Distance from Mexico City | – 0.35 |
| Population | 0.52 |
| Real gross state product (GSP) | 0.52 |
| Real GSP per capita | – 0.05 |
| Unemployment rate | 0.16 |
SOURCES: Authors’ calculations from the 2000-2014 American Community Survey, the Bureau of Economic Analysis, and the Bureau of Labor Statistics.
NOTE: Correlation is a measure of the linear relationship between two variables and takes on a value between – 1 and 1. A positive value indicates that the two variables tend to move together, while a negative value indicates that they tend to move in opposite directions. The further away the value is from 0, the stronger the relationship, with +/ – 1 representing a perfect correlation, meaning if there is a change in one variable, the other is changed in a fixed proportion. We used Mexico as the source country for this table because it is the leading source nation for U.S. immigration, providing more than one fourth of the foreign-born stock that is in the U.S. This table provides a simple benchmark.
Source
https://www.stlouisfed.org/publications/regional-economist/october-2016/Immigrants-to-the-US-Where-They-Are-Coming-from-and-Where-They-Are-Headed
Endnotes
All the figures presented in this article are authors’ calculations based on the 2014 American Community Survey (ACS), conducted by the Census Bureau and made available via IPUMS-USA. (IPUMS stands for Integrated Public Use Microdata Series.) [back to text]
We estimated the distance between each state and Mexico City using the great-circle distance formula and assuming the Earth is a sphere with a radius of 6,371 kilometers. A state’s latitude and longitude data correspond to an internal point that is at or near the state’s geographic center, as calculated by the Census Bureau. [back to text]
References
IPUMS-USA, University of Minnesota. See www.ipums.org.


