Written by Lance Roberts, Clarity Financial
Earnings Worse Than Expected
Despite hopes by the more mainstream economists that earnings would be improving sooner rather than later, this has yet to be the case.

As Eric Parnell recently noted:
“Roughly two-thirds of the companies in the S&P 500 Index have now reported their latest quarterly earnings. And while the headlines are filled with companies that continue to “beat” expectations, the reality is that the downward revisions in corporate earnings are even worse than what this stock market bear expected this quarter. And the readings for the latest week have almost assured that corporate earnings are going to fall short of the reasonable targets set at the beginning of the quarter.”
However, the only reason that companies are currently beating estimates, is because those estimates had been dramatically lowered since the beginning of this year turning earnings season into a “participation event.” In other words, if you lower the bar enough, eventually everyone “gets a trophy.”
The chart below shows the evolution of earnings expectations since March of 2015, to present with the bottom part of the chart showing forward estimate changes from January, 2016.
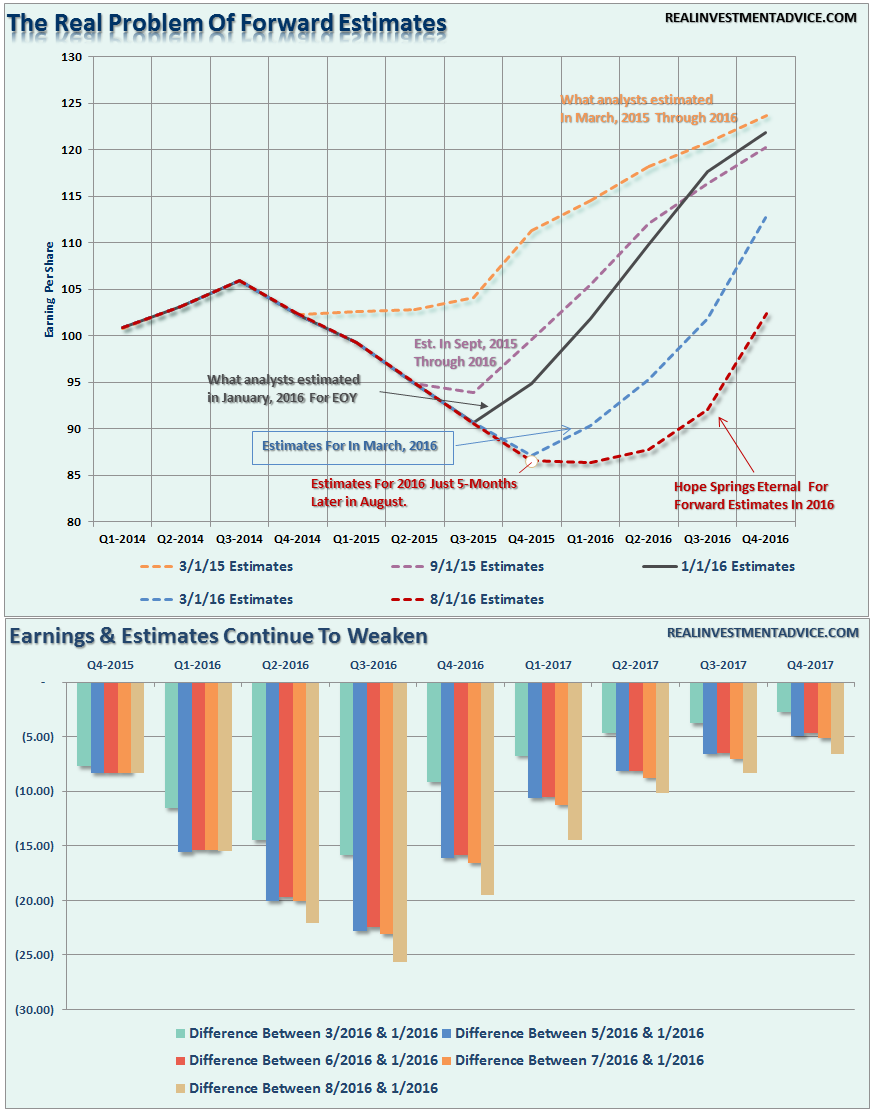
As discussed over the last couple of weeks, the direction of the dollar will be a major determinant as to the realization of those “hockey stick” recovery hopes shown above.
“While earnings are set to decline again this quarter, which will push valuations even further into the proverbial stratosphere, the real risk to watch is the US Dollar. While Central Banks have gone all in, including the BOJ with additional QE measures of $100 billion, to bail out financial markets and banks following the ‘Brexit’ referendum, it could backfire badly if the US dollar rises from foreign inflows. As shown below, a stronger dollar will provide another headwind to already weak earnings and oil prices in the months ahead .“

Unlike the stock market which is pushing extreme overbought levels, the dollar is at an extreme oversold condition and has only started a potential move higher. This is something to pay very close attention to in the months ahead.
With interest rates negative in many areas of the world, the push of capital into the U.S. for a higher return on reserves is very likely which will continue to suppress earnings and economic growth.
As Eric concludes:
“All of this continues to present an increasing dilemma for an already richly valued stock market trading at all-time highs. For with each passing day, stocks are becoming more expensive even if they simply stand still.”
Eventually, valuations will matter.
Potential Short-Term Oil Bounce
At the beginning of July I wrote:
“With oil prices back to extreme overbought conditions, a retracement to $35 or $40/bbl would not be surprising particularly if, and when, the US Dollar strengthens. Remain underweight this sector as valuations for energy stocks have entered into ‘moon shot’ territory.”
That call was quite prescient as shown.
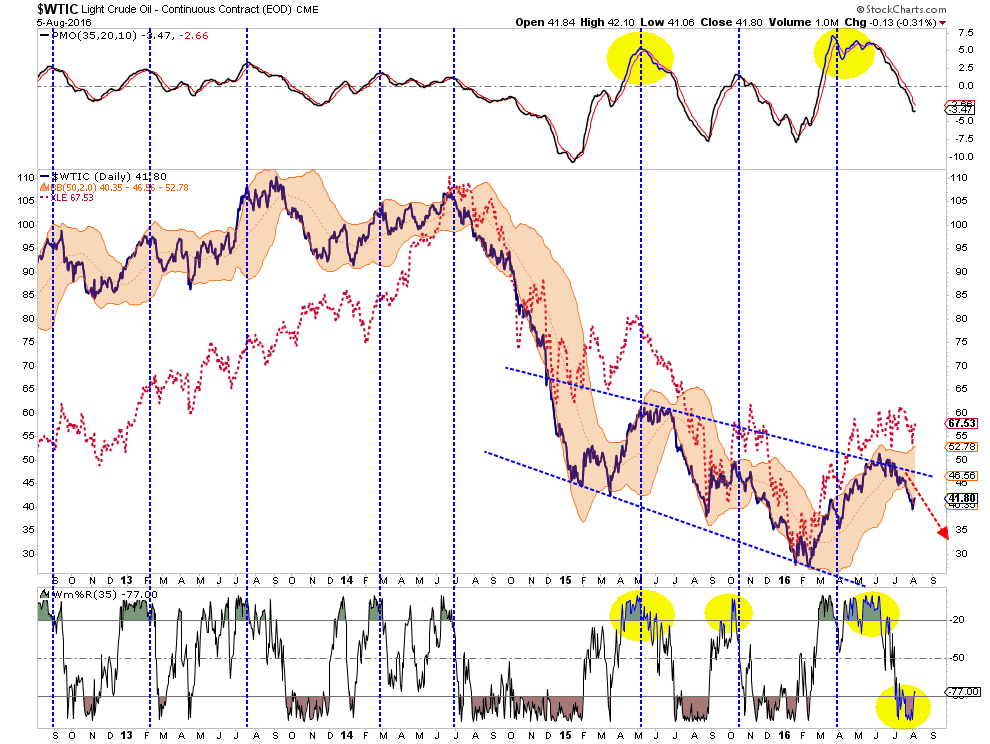
On a very short-term basis, oil has gotten oversold enough for a bounce to $46ish. I would begin reducing exposure to energy at that level as the next retracement lower will likely search for the $30-35 level. I suggest this because, on a weekly basis, oil currently remains trading at levels that have historically noted peaks in price.

Oil, and subsequently energy related stocks, currently remain trading vehicles rather than investments. There is a lot of damage still to come as earnings continue to slump in this sector over the next couple of years as oil prices remain low.
Looking For An Opportunity To Buy Bonds
I discussed previously that interest rates had gotten so oversold (bonds overbought) due to the “Brexit” that a reversal was very possible. As I noted on previously, the rotation from bonds to stocks confirmed the push higher in the markets.
“Much of the sustainability of the rally going forward is dependent upon the ongoing rotations from ‘safety’ back into ‘risk.'”
That occurred as suspected and the “short position” on interest rates using the exchange-traded fund (TBT) at the time has now been closed out. With rates now pushing on the long-term downtrend line, I am now looking for weakness in the bond market to add to existing fixed income holdings for the next decline in rates.
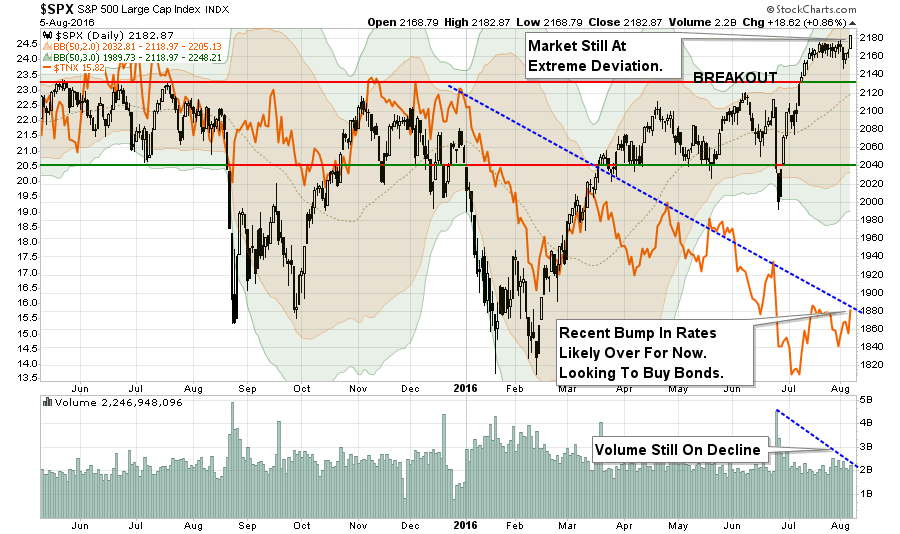
If I am correct, and the markets do experience a short-term correction, or worse, interest rates will likely retest recent lows. One thing is for sure…
“Rates ain’t going significantly higher anytime soon.”
Model Update
S.A.R.M. Sector Analysis & Weighting
The current risk weighting remains at 50% this week but will increase to 75% given the appropriate correction of the overbought condition. With all buy signals currently in place, and the bullish trend intact, this is not a market to bet heavily against…for now. However, it is also not a market to become extremely complacent in either.
Again, we must be given the right “set up” to increase equity allocations. Begin by “averaging up” in existing holdings to match model allocation and weights. When, and IF, the market confirms the continuation of the “bullish trend,” then begin adding new holdings to the model.
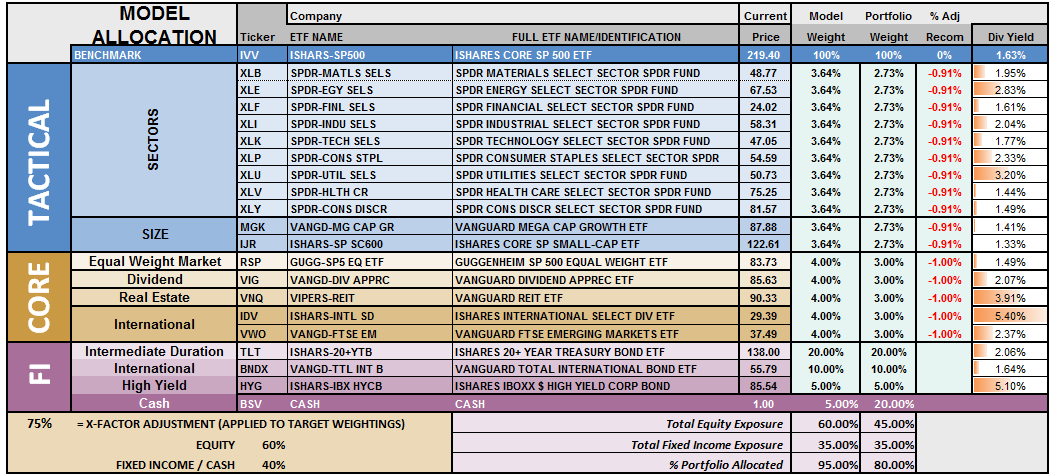
(Note: This is an equally weighted model example and may differ from discussions of overweighting/underweighting specific sectors or holdings.)
Relative performance of each sector of the model as compared to the S&P 500 is shown below. The table compares each position in the model relative to the benchmark over a 1, 4, 12, 24 and 52-week basis.
Historically speaking, sectors that are leading the markets higher continue to do so in the short-term and vice-versa. The relative improvement or weakness of each sector relative to index over time can show where money is flowing into and out of. Normally, these performance changes signal a change that last several weeks.
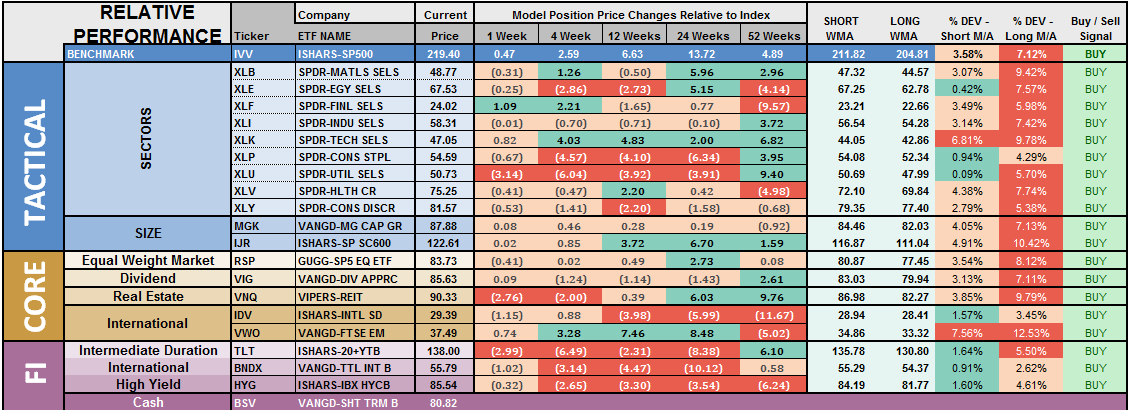
The two charts below graphically show the relationship of each positions performance relative to the S&P 500 Index. If we are trying to “beat the index” over time, we want to overweight sectors/asset classes that are either improving in performance or outperforming the index, and underweight or exclude everything else.
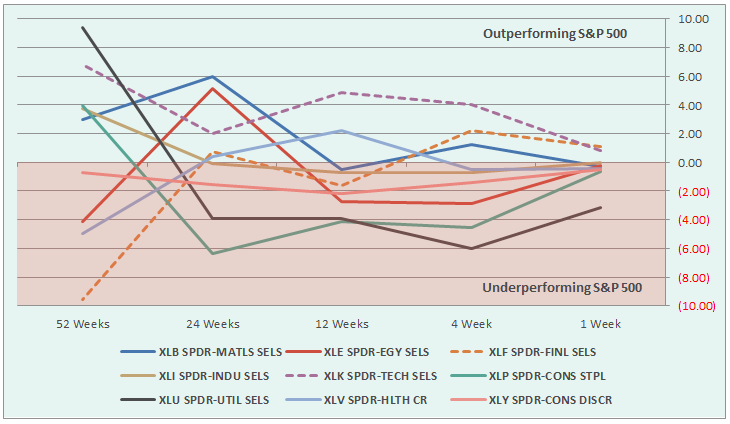
Sectors Currently Outperforming:
Financials
Technology
Sectors Currently Performing In Line
Materials
Industrials
Staples
Healthcare
Energy
Discretionary
Sectors Currently Under Performing
Utilities
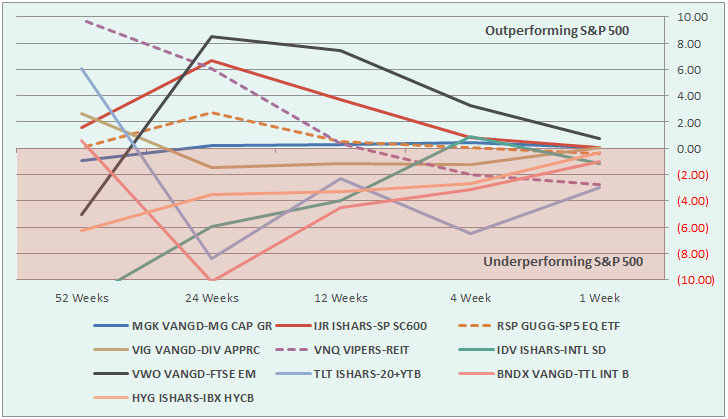
Index/Other Asset Classes Out Performing S&P 500
Emerging Markets (but notice deterioration in relative performance)
Index/Other Asset Classes Performing In-Line With S&P 500
Mid-Caps
Small-Caps
Equal-Weight S&P 500
International Bonds
High-Yield Bonds
Dividend Stocks
International Stocks
Index/Other Asset Classes Under Performing S&P 500
REITs
Bonds (noticeable improvement in performance – watch for opportunity)
The risk-adjusted equally weighted model has been increased to 75%. However, as stated above, a pullback in the markets is needed before making any changes.
Such an increase will change model allocations to:
20% Cash
35% Bonds
45% in Equities.
As always, this is just a guide, not a recommendation. It is completely OKAY if your current allocation to cash is different based on your personal risk tolerance, time frames, and goals.
For longer-term investors, we still need to see improvement in the fundamental and economic backdrop to support the resumption of a long-term bullish trend. Currently, there is no evidence of that occurring.
THE REAL 401k PLAN MANAGER
The Real 401k Plan Manager – A Conservative Strategy For Long-Term Investors
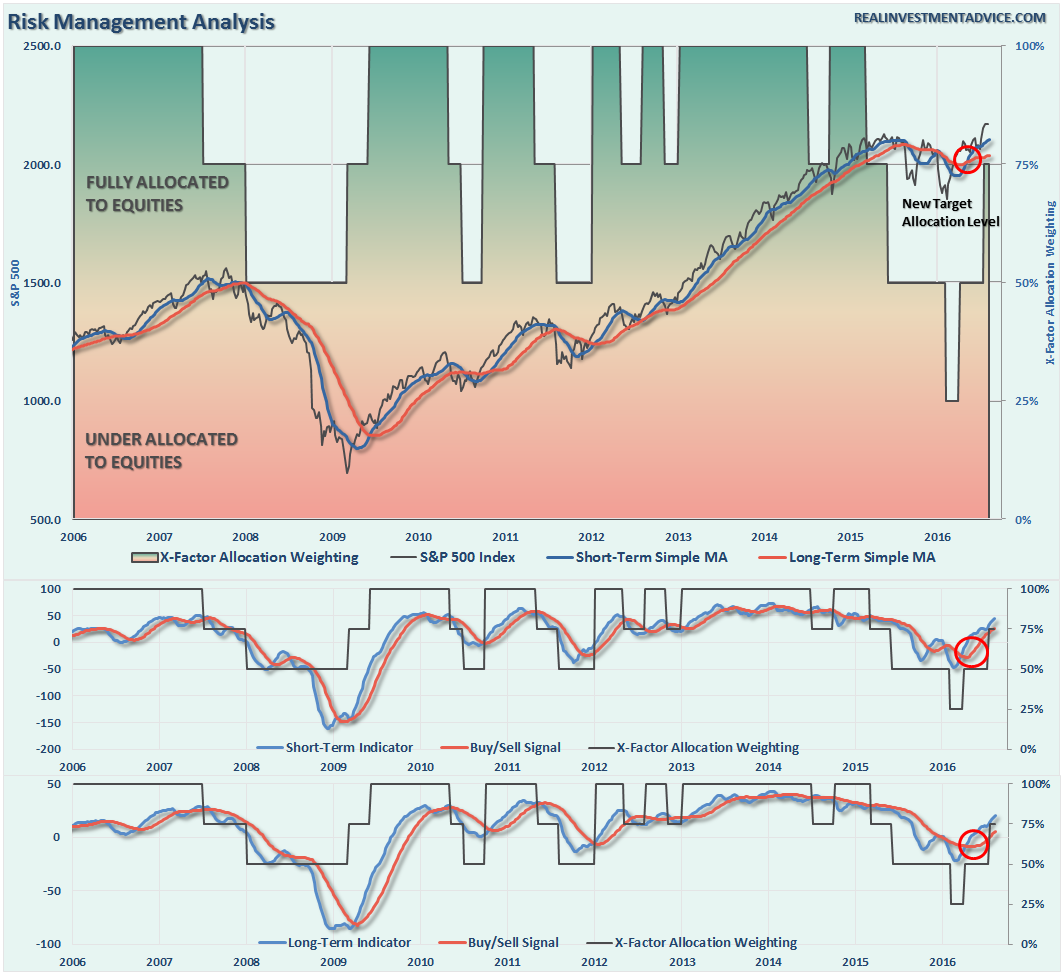
NOTE: I have redesigned the 401k plan manager to accurately reflect the changes in the allocation model over time. I have overlaid the actual model changes on top of the indicators to reflect the timing of the changes relative to the signals.
There are 4-steps to allocation changes based on 25% reduction increments. As noted in the chart above a 100% allocation level is equal to 60% stocks. I never advocate being 100% out of the market as it is far too difficult to reverse course when the market changes from a negative to a positive trend. Emotions keep us from taking the correct action.

Still Excessively Overbought
As I noted last time:
“With the technical underpinnings still bullishly biased at the moment, we are now in the position to increase equity allocations over the next couple of weeks.
However, as is always the case, by the time markets makes a significant technical change, prices are generally at an extreme overbought or oversold condition. This is the case currently with the recent breakout which has created an extreme overbought condition in the short term.”
And…we are still waiting….for the moment. This is where having the patience to wait for the “fat pitch” becomes much more difficult, but more often than not, provides the best results.
As discussed at length in the above missive, we certainly want to prepare ourselves to increase equity exposure in portfolios, however, we must patiently wait for the right conditions to apply those increases. Furthermore, while waiting for the relaxation of prices to make more prudent entries, it also enables investors to bypass potential “head fakes” of market actions.
Review the allocation model adjustments below
Identify the next course of actions in your 401k-plan
Wait to make adjustments until technical conditions improve.
Change allocations to target levels when conditions are right.
If you need help after reading the alert; don’t hesitate to contact me.
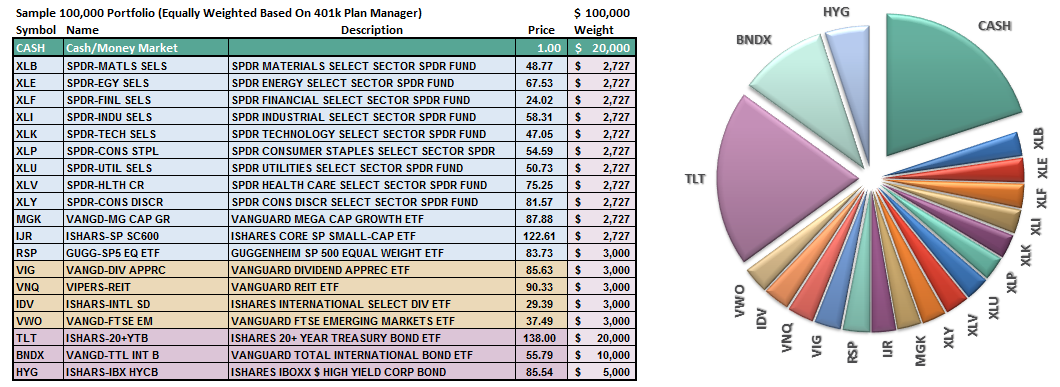
Current 401-k Allocation Model
The 401k plan allocation plan below follows the K.I.S.S. principal. By keeping the allocation extremely simplified it allows for better control of the allocation and a closer tracking to the benchmark objective over time. (If you want to make it more complicated you can, however, statistics show that simply adding more funds does not increase performance to any great degree.)

401k Choice Matching List
The list below shows sample 401k plan funds for each major category. In reality, the majority of funds all track their indices fairly closely. Therefore, if you don’t see your exact fund listed, look for a fund that is similar in nature.


