
The crypto market leader, Bitcoin (BTC), has seen its price surge to reach around $21,100 in the last 24 hours. CoinMarketCap shows that the price of Bitcoin is trading at $20,950 at the time of writing. Bitcoin’s price has strengthened against Ethereum (ETH) over the same period and Bitcoin is now down 0.47% against the altcoin leader.
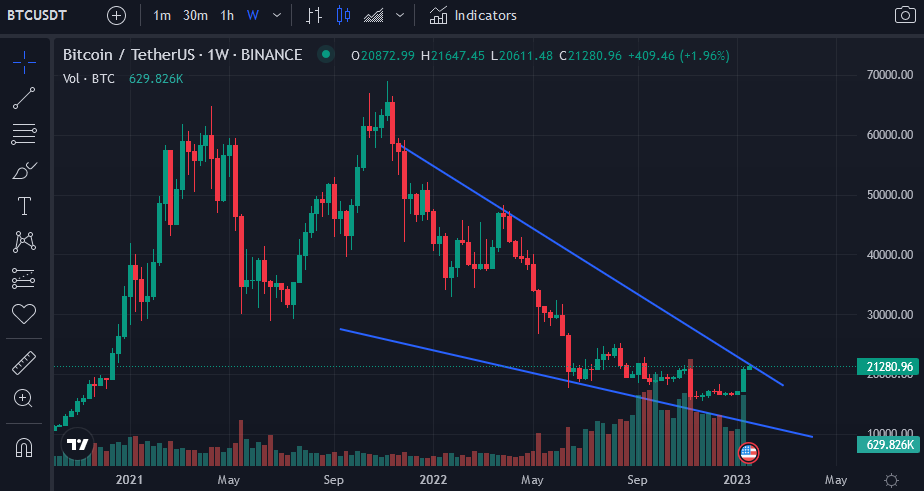
Bitcoin’s price is trying to break out of a weekly falling wedge pattern. Failure to break out of the pattern will result in a sharp drop in Bitcoin’s price.
One crypto analyst, Captain Faibik, tweeted that Bitcoin bulls will have to clear the critical $22,000 resistance level with more buying volume to confirm a break out of the current wedge chart pattern. In the tweet, the analyst highlighted a pair of bullish technical flags that have already been triggered by Bitcoin’s price on the weekly time frame.
The first bullish technical flag that has already been triggered on Bitcoin’s weekly chart is the weekly RSI which has already broken the 2-year downtrend. The second is the Hash Ribbon which flashed as a buy signal.
A dropping wedge chart pattern has formed on BTC’s weekly chart.
In case the bulls can boost Bitcoin’s price out of the critical $22,000 level, then Bitcoin’s price will aim to target the next resistance level at about $24,770. Thereafter, the next target will be $24,921.77.
Buy Bitcoin NowOn the flip side, in case Bitcoin’s price breaks below the falling wedge pattern present on its weekly chart, then it is at risk of dropping to around $13,000. Before it happens, nonetheless, Bitcoin will need to break below the strong support level of $19,300.


