


What am I saying with all this ‘pulse nonsense‘? I am suggesting that the buyers are played out, that prices are overbought, and that we need a real sell-off in order to make stocks attractive again. This rally has been a fake rally, purchased by artificial interest rates, massive margin-buying (more debt) and fueled also by corporate buy-backs … which are all a part of the Bernanke Doctrine of feed the super-rich and starve everyone else. It is shameful Barack Obama has bone along with this. This will tarnish the reputation of his presidency in a way that Bill Clinton’s sell-out to the Wall Street banks tarnished his presidency (much more than Monica Lewinsky and the cigar incident, and the perjury that followed). Clinton essentially betrayed America’s democracy to the rich corporate establishment, leaving America without a political conscience – leaving Goldman Sachs owning all the political power in America. Who was left to speak for the average non-rich American, now that the Democratic Party had sold its soul to the devil?
Clearly, in my mind today, the Devil lives on Wall Street. A very interesting movie that develops this idea is The Devil’s Apprentice, starring America’s greatest actor, Al Pacino. If you have not seen this movie, please see it.
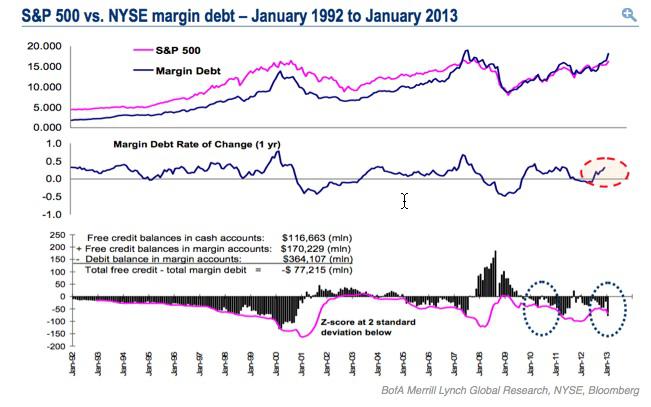
Margin levels are approaching levels last seen (historic highs) in 2009, before the Market Crash. Bank of America analyst, Mary Ann Bartels writes that her margin-based market indicator, based on margin vs. cash levels in margin accounts has given the first market sell signal since 2010. She writes:
Net Free Credits from the NYSE Margin Debt data shown in the chart below is essentially a measure of cash levels in margin accounts. Current levels have fallen to levels that have generated a tactical sell signal based on a 2-standard deviation Z-Score reading.
The last time a sell signal was generated was on April 2010 and the S&P 500 subsequently corrected by 16% in two months. Net free credits for January were at a negative $77.2 million or cash balances are negative and the Z-Score indicates the cash draw down has been excessive. So a contrarian sell signal is given.
Cash balances are plotted as black bars on the bottom graph in the chart below.
Click to enlarge
www.businessinsider.com/first-margin-deb…-3
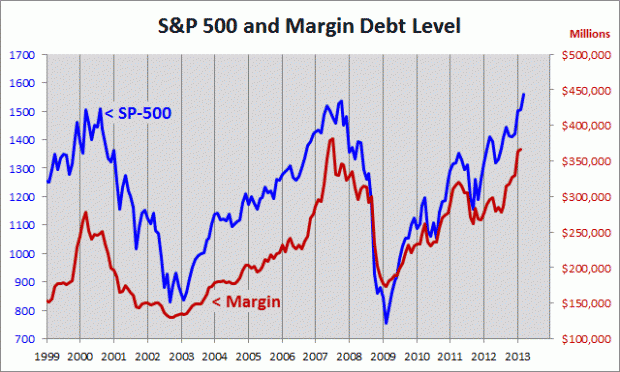
The pictures below show the correspondence between margin-debt and stock price appreciation; and historical margin levels (those who say we are deleveraging should look at this chart) and the student loan debt increase picture before claiming we are winding down our debt – it might also be nice to look at government indebtedness as well – along with unfunded liabilities. Look how all three stock bubbles of this past twelve years coincide with debt-bubbles in margin also: 2001, 2008, 2013.
Click to enlarge
Look how stock margin-debt was not a problem until the last inflation cycle sponsored by FED mania for debt – for enslaving the public with debt.

This picture of margin-debt is just another picture of the debt-inflation bubble engineered by Greenspan and Bernanke, which has endangered the life of the American Democracy.


