by Michael Clark
(This article was originally posted by Seeking Alpha 28 April 2013)
 What do I mean by this? We had a bit of a rally at the end of the week. Some stocks made new highs. Are we not just ready to go higher after a bit of panic-selling spurred by massive liquidation in gold (margin-call on some heavy-hitter, or a central bank?), and horrible earnings coming in from many sources?
Perhaps. It is very hard to short a market when interest rates are at 0% and central banks are feeding the markets with free money and corporations are buying back their own shares financed by free money.
Am I still short this market?
I am cautiously short this market. I have tried to take on Ben Bernanke before; this ended in short-lived tears. Have I not learned anything?
I have recently developed a market indicator that essentially shows the market pulse. And a market that loses its pulse is vulnerable on the downside.
Let’s look at charts of the DJIA during the Great Depression era and see what I mean by a market losing its pulse.
 The Pulse is the red line in the First Pane. It is surrounded by a blue box that is also a kind of pulse measure. A stock that is climbing will show a very active pulse, both in terms of the blue box rising, and with a dancing red pulse.
The Second Pane is also useful in that it is at the tope of the chart when a stock or index is making higher highs and higher lows.
Also the Black line in the Center Pane, CGTS Pre-Basic, is a very useful indicator to keep your eye on. When it tops out, and falls – always ahead of the price itself – one should become cautious.
The Dow Jones Index in 1929 hit the ‘no pulse zone‘ in September, and had a horrible fall – Black October. Note the pulse coming back after the decline. A small pulse is better than no pulse. But a strong pulse, one that carries the red line up toward the top of the blue box is even better.
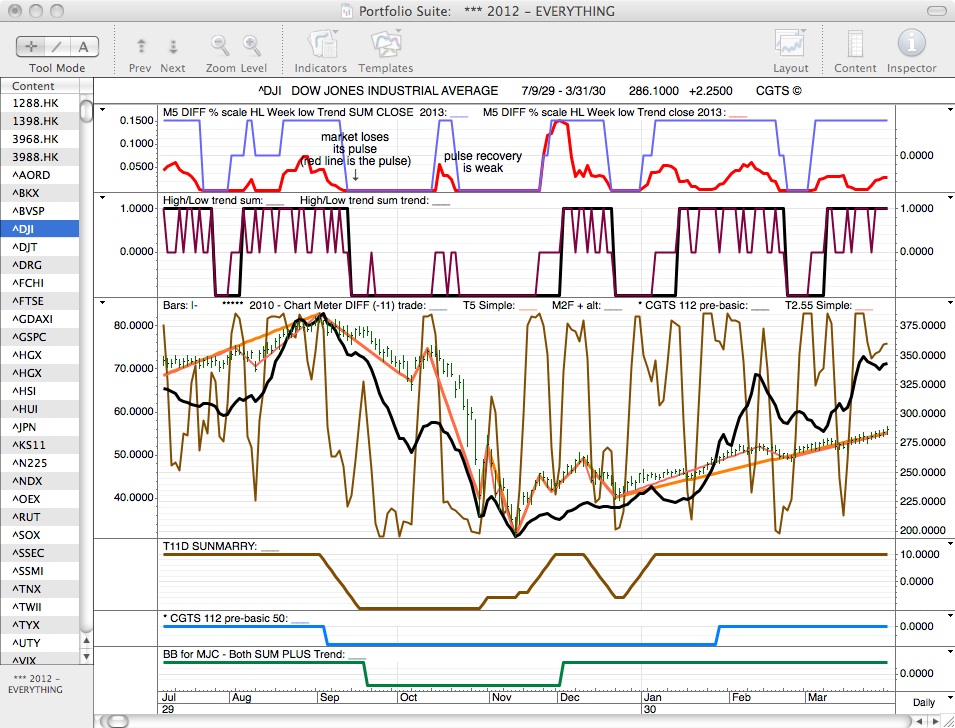
Click to enlarge
This looks like a temporary setback for the Dow. The pulse comes back quickly; and the index is soon again making higher highs and higher lows (Second Pane). However, the pulse soon weakens again; and then disappears. In January 1931, the pulse vanishes again; and then stays gone longer. Our CGTS Indicator (black line, Center Panel) does recover and begin climbing. The pulse follows it up for a time; but then both indicators top out again.
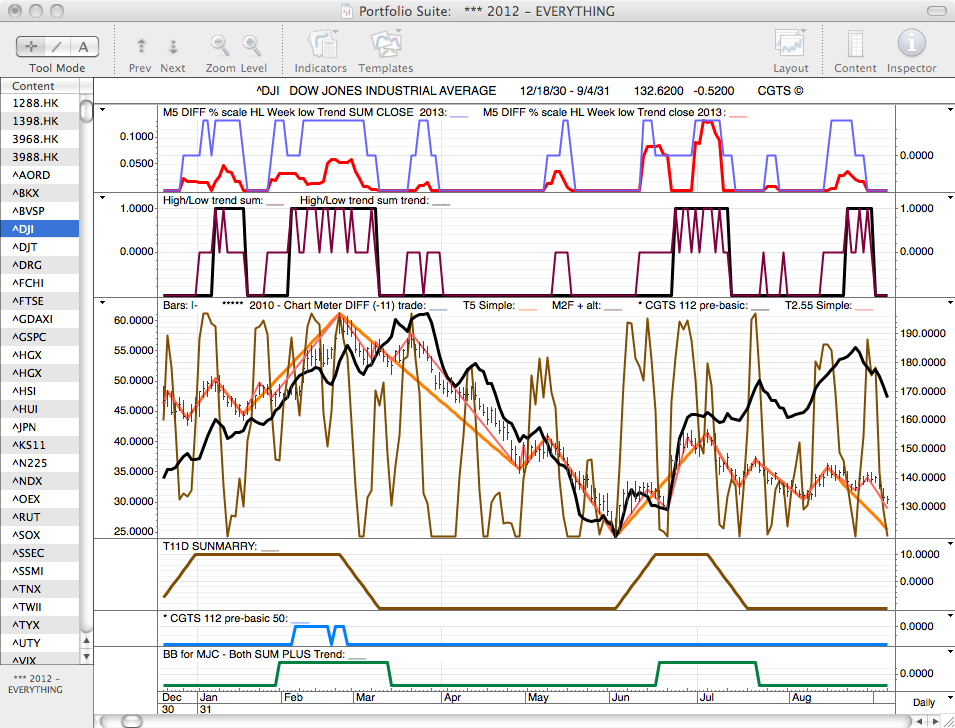
Click to enlarge
In 1932, the same story holds: no pulse, with frantic selling; then an attempted recovery, with a stronger pulse; followed by another vanishing pulse.
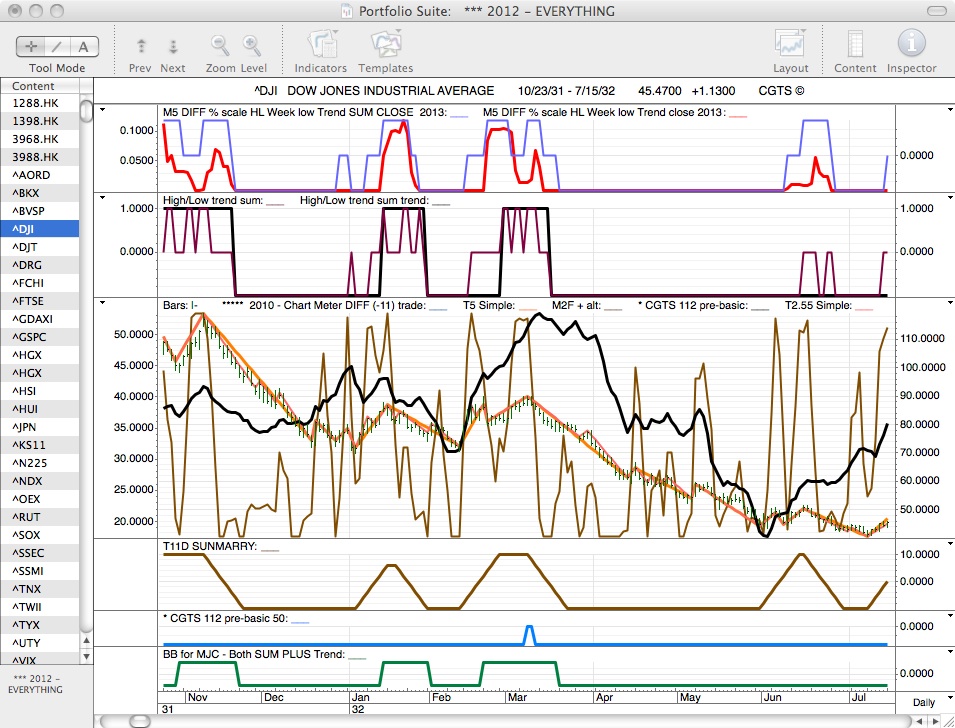
Click to enlarge


