by Lee Adler, Wall Street Examiner
A huge gain in individual income taxes collected in September suggests that the effects of bubble friendly Fed policy are trickling down to the owners of small businesses. Unfortunately, wage and hour data tells us that the trickle is dammed there. Will our dammed nation will be our damnation?
This is an extended free excerpt from the Treasury Update. Subscribers click here to download complete report in pdf format (Professional Edition Subscribers).

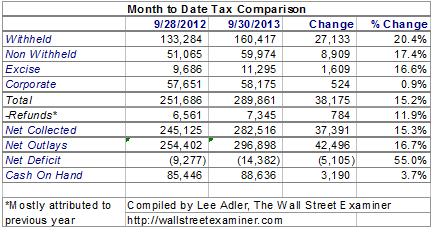
Federal Government Cash Flows – Click to enlarge
As of September 30, end of month withholding tax receipts were 20.4% ahead of last year. Before you say, “Woo!” recognize that in 2012 the last weekday was September 28. Withholding for the last two days of the month came in October. The year to year comparison is therefore skewed. This year September also included some extra collections at the beginning of the month because the last day of collections in August was August 30, which pushed wages earned over that weekend into September collections. That did not happen last year. Therefore this year September had 3 extra collection days relative to September 2012.
The moving total method is a more reliable indicator of the current state of withholding tax collections than month to date due to the calendar anomalies inherent in month to date comparisons.
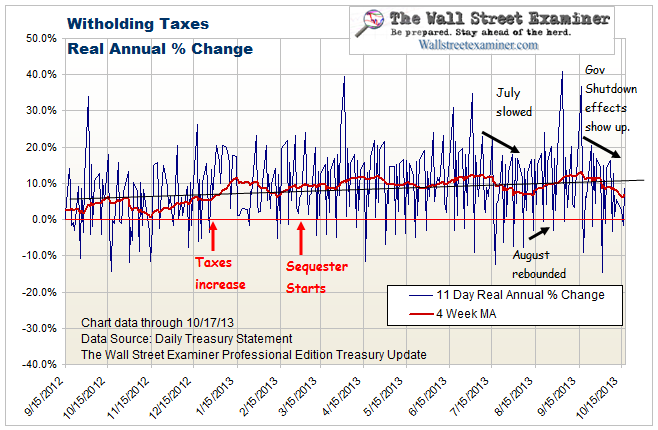
Federal Withholding Tax Collections – Click to enlarge
As of October 3, the 4 week average of the 11 weekday (half month) total of withholding taxes was up 9.8% in nominal terms versus the corresponding period a year ago. That fell off the table from the 11.8% gain the week before. But it compares with a low point of +8.5% August 7-9. The peak was +13.6% at the end of June. This week’s data may mark the beginning of the effect of the government shut down or it may just be a blip. Adjusted for compensation inflation, withholding has fallen below the growth trendline of the past year (charts below), but it’s still above the August trough.
The gain of 9.8% by the moving total method, adjusted for the 2013 tax increase and inflation would mean that the real gain was only about 1.3% give or take a couple of tenths. That’s not much, and it’s much weaker than it was in August.
While excise tax deposits are collected from large businesses throughout the month, smaller businesses are only required to pay quarterly. October 31 is the next quarterly due date for most excise taxes. One of the largest components of excise taxes is the gas tax. The unusually large gain in excise taxes would also have been skewed by the calendar since month end taxes due in September 2012 would have been paid in early October.
The big gain in Non-withheld taxes is interesting because it represents the individual income taxes of small business owners who do not have taxes withheld. Those were due September 16. Therefore these collections were not impacted by the extra days in September. This number is extremely strong. Based on this data, the complaints about small business being beset by regulation, 0-care, and uncertainty do not wash. The increase in individual income taxes suggests that the effects of bubble friendly Fed policy are trickling down to the heads of small businesses.
Unfortunately, wage and hour data tells us that the trickle is dammed at that point. Small businessmen are learning to mimic their big business role models and are squeezing labor hard. This kind of short sighted behavior is what leads to slowing top line growth. Eventually the lemon will be squeezed dry and the economy and business profits will start to contract. There is no happy ending to this story.
As a whole, the tax data are not signs that the economy slowed in the third quarter as many pundits were groaning and moaning throughout the quarter. I also saw no sign of slowing in the first time unemployment claims data or other economic data.
Outlays were up sharply mostly due to the same calendar factors which boosted withholding. Some August outlays were pushed into September this month and last year some September outlays were delayed until October making it appear that September outlays had an enormous increase this year. They were higher, but not by 16.7%.
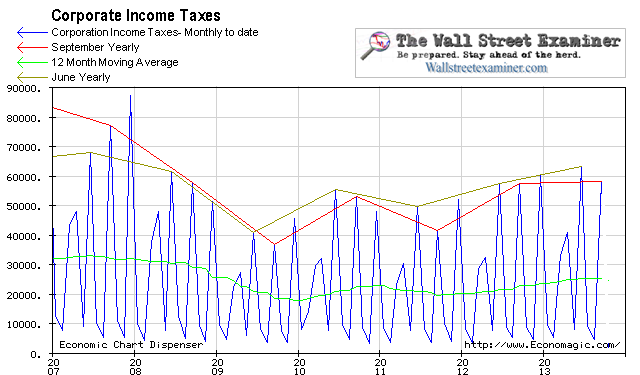
Quarterly corporate taxes are due as of September 16, and they’re up 0.9% versus last year. There has been a clear slowing since the June quarterly tax collections. Businesses may have gone as far as they can go in squeezing labor costs. Profitability from here may depend on top line growth, which has been far slower than the growth in profits since 2009.
Corporate Income Tax Collections – Click to enlarge
There’s also a question as to how far public companies can push reported earnings per share, which have risen by 7 fold since 2009 while taxes on corporate profits have risen by just 55%. This looks like the old two sets of books trick, one for Wall Street and one for Uncle Sam. I’ll let you be the judge of which one more accurately represents the truth.
Click here to download complete report in pdf format (Professional Edition Subscribers) including 36 pages of charts and clear, cutting edge analysis that you can use to gain an edge in the market. Try the Professional Edition risk free for thirty days. If, within that time, you don’t find the information useful, I will give you a full refund. It’s that simple. 30 day risk free trial for new subscribers. Click here for more information.


