Econintersect Climate and Weather Update, 28 July 2014
Written by Sig Silber
Oops, this is not an Astrology column and actually Mercury is back to moving direct and will not resume being retrograde until October (another unfortunately named planet is in retrograde right now) but the weather pattern over the conterminous U.S., otherwise known as CONUS, is retrograde and moving from East to West and North to South unlike what is customary. So why is this happening and what are the impacts?

To understand what has happened and how it will play itself out over the next 6 – 14 days it is useful to look at the forecast maps issued today July 28 by NOAA. Please note these maps auto update daily so the model results may change over the next few days and that will be reflected in these graphics which update automatically. Neither my comments nor the excerpts from the NOAA discussion will update as those were cut and pasted into this article. Keep that in mind if you look at this article sometime in the future. I could have frozen the below maps but that is a bit difficult to do and I see some value in allowing them to update over the next few days.
Temperature Forecast for days 6 – 10:

You can see the remnant of the cold air mass, arriving via Canada but not necessarily originating in Canada, moving south and gradually being absorbed into the overall weather pattern of CONUS.
6 – 10 Day Precipitation Forecast:

And now what they call Week Two which is days 8 – 14. Notice the overlap of days 8, 9, and 10. This reflects the difficulty of precisely timing the movement of highs (ridges) and lows (troughs) which is the primary mechanism for the development of these forecasts.
The 8 – 14 Day Temperature Forecast:

The 8- 14 Day Precipitation Forecast:

And here are excerpts from the explanation provided by NOAA starting with what was said last Wednesday a couple of days after this pattern became clear in the forecast models.
“TODAY’S MODELS REMAIN IN EXCELLENT AGREEMENT WITH RESPECT TO THE FORECAST CIRCULATION OVER NORTH AMERICA. CONFIDENCE ALSO REMAINS HIGH AS THE VARIOUS DYNAMICAL AND STATISTICAL TOOLS ARE IN AGREEMENT ON WHAT SHOULD BE ANOTHER IMPRESSIVELY COOL SUMMER PERIOD OVER THE EAST-CENTRAL. TODAY’S OFFICIAL 500-HPA MANUAL BLEND FOR THE 6-10 DAY PERIOD IS SIMILAR TO YESTERDAY’S, THOUGH THERE IS A SUBTLE RETROGRESSION OF THE HIGH-AMPLITUDE FEATURES ACROSS MUCH OF NORTH AMERICA AND THE WESTERN ATLANTIC.
A HIGH-AMPLITUDE TROUGH PREDICTED OVER THE EASTERN CONUS FAVORS ANOMALOUS NORTHERLY WINDS AND BELOW-NORMAL TEMPERATURES OVER MOST OF THE EASTERN U.S. THE EXTENT OF PROBABILITIES FAVORING BELOW-NORMAL TEMPERATURES IS EVEN HIGHER THAN IN YESTERDAY’S OUTLOOK, WITH THE ANOMALOUS COOL AIR MASS FORECAST TO SETTLE FARTHER SOUTH AND WEST. ANOMALOUS RIDGING COMBINED WITH ANOMALOUS OFFSHORE WINDS STRONGLY FAVOR ABOVE-NORMAL TEMPERATURES FOR THE WESTERN CONUS . BELOW-MEDIAN PRECIPITATION IS FAVORED OVER WESTERN NORTH AMERICA. THIS REGION EXTENDS ALL THE WAY TO THE CENTRAL AND SOUTHERN APPALACHIANS AND IN THE POST-FRONTAL REGION WHERE SURFACE RIDGING IS FORECAST TO NOSE IN FROM THE NORTHWEST. THE FRONT FORECAST TO EXTEND FROM NEAR THE EASTERN SEABOARD TURNING WESTWARD ALONG THE GULF COAST WILL BE A FOCAL POINT FOR PRECIPITATION. THIS FAVORS NEAR – TO ABOVE MEDIAN PRECIPITATION FOR PARTS OF THE EASTERN U.S. EXTENDING WESTWARD TO THE SOUTHERN PLAINS AND PARTS OF THE SOUTHWEST. PROBABILITIES FOR ABOVE-MEDIAN PRECIPITATION ARE AGAIN THE HIGHEST OVER THE SOUTHWEST, WHERE THE STALLED FRONTAL SYSTEM WILL FOCUS PRECIPITATION FOR AN EXTENDED PERIOD OF TIME.”
And here are excerpts from what they say now today on Monday July 28.
6-10 DAY OUTLOOK FOR AUG 03 – 07 2014
THE MODELS CONTINUE TO PREDICT A PERSISTING LONG-WAVE 500-HPA PATTERN OF AN AMPLIFIED TROUGH OVER THE EAST-CENTRAL CONUS, CENTERED OVER THE GREAT LAKES AND EXTENDING TO THE GULF COAST NEAR THE LOWER MISSISSIPPI VALLEY. AN AMPLIFIED RIDGE IS PREDICTED OVER THE NORTHERN ROCKY MOUNTAINS INTO WEST-CENTRAL CANADA. THE CHANCES OF BELOW-NORMAL TEMPERATURES ARE SIGNIFICANTLY ENHANCED FOR MUCH OF THE EASTERN AND CENTRAL CONUS NEAR THE ANOMALOUSLY AMPLIFIED EASTERN TROUGH. PROBABILITIES ARE HIGHEST NEAR AND TO THE NORTH OF AN EXPECTED FRONTAL BOUNDARY, WHERE PRECIPITATION MAY HELP SUPPRESS DAYTIME TEMPERATURES. ABOVE-NORMAL TEMPERATURES ARE FAVORED FOR THE FAR WESTERN CONUS NEAR THE UPPER LEVEL RIDGE. A FAIRLY STRONG GRADIENT IN TEMPERATURE ANOMALIES IS EXPECTED JUST WEST OF THE ROCKIES, LEADING TO HIGH UNCERTAINTY IN TEMPERATURES FOR THE INTERMOUNTAIN WEST. THE PRECIPITATION OUTLOOK FAVORS ABOVE-MEDIAN RAINFALL AMOUNTS ALONG AN EXPECTED MEAN FRONTAL BOUNDARY THAT EXTENDS FROM THE CENTRAL ROCKIES TO THE GULF COAST AND THEN ALONG THE EASTERN SEABOARD. BEHIND THE MEAN FRONTAL BOUNDARY, COOL AND RELATIVELY DRY AIR FOR THE SEASON IS EXPECTED TO ENHANCE CHANCES FOR BELOW-MEDIAN PRECIPITATION AMOUNTS FOR MUCH OF THE EAST-CENTRAL CONUS. NAEFS AND THE GEFS REFORECAST TOOL SHOW ENHANCED CHANCES OF ABOVE-MEDIAN PRECIPITATION AMOUNTS IN PARTS OF THE INTERMOUNTAIN WEST, WITH BELOW-MEDIAN PRECIPITATION FAVORED NEAR THE PACIFIC NORTHWEST COAST.
8-14 DAY OUTLOOK FOR AUG 05 – 11 2014
A SUBSTANTIAL FRACTION OF MODEL ENSEMBLE MEMBERS CONTINUE TO PREDICT AN AMPLIFIED EASTERN TROUGH, WITH MOST MEMBERS RELAXING THE STRENGTH OF THE WESTERN RIDGE, LEADING TO A DISTINCTLY LOWER AMPLITUDE IN THE PREDICTED 8-10 DAY MEAN 500-HPA FLOW PATTERN WHEN COMPARED TO THE 6-10 DAY PERIOD.THE TEMPERATURE AND PRECIPITATION OUTLOOK FOR THE CONUS FOR WEEK-TWO IS QUITE SIMILAR TO THE 6-10 DAY PERIOD, WITH LOWER PROBABILITIES FOR ANOMALIES REFLECTING THE GREATER SPREAD AMONG SOLUTIONS AND THE EXPECTED LOWER AMPLITUDE FLOW PATTERN.”
As you can see there has been basically no change in the forecast even though almost a week has gone by attesting to the very significant impact of this intrusion of colder air which I believe is sent to us all the way from the weather pattern associated with the recent typhoon near Japan, providing a good example of the way weather in distant places impacts the weather in the U.S. It looks like this overall weather pattern has about three weeks to play out.
Lastest El Nino Information
I should have published this last week as it came out on July 17 but I did not notice it immediately.
IRI appears to publish two similar charts, one early in the month based on basically a survey of scientists, and one mid-month that is a pure mathematical analysis of the computer model results. This is the computer model analysis and again shows the decreasing optimism about the duration of this El Nino. It is projected to be a one-year event. The above does not deal with the strength of the El Nino although the individual models from which this was derived does. And below is the set of model runs from which the above is calculated and these show the projected moderate to weak strength of this El Nino.
Notice that essentially all the models start to tail off at the beginning of 2015 which is why I am thinking that this is going to be mainly a Fall El Nino in terms of impacts. But often the impacts lag the ONI Index so I may well be wrong about the timing of the impacts.
In terms of predicting what is going on, I prefer to look at the Hovmoller diagrams, as I think the raw data is easier to relate to than model runs, but many people prefer to look at model runs. This week the only Hovmoller I will present is the situation with the low level Easterlies which seem to me to be the key to how much this El Nino develops at this point in the cycle i.e. late July and whether it will be a true El Nino or an El Nino Modoki.

You can see the latest indication of some strengthening of the westerlies in the Western Pacific which is favorable for El Nino development but which does not tell us how far east this development will extend and I see a tad of blue in the eastern Pacific that NOAA does not mention. In another Hovmoller diagram, I am not showing, one can see that the heat content in the Western Pacific is also consistent with what the above diagram is showing.
Role of Enso in Global Warming
Back to the discussion which I began last week about El Nino as it may or may not impact Global Warming and the related topic that has been labeled “The Hiatus”. Actually we need to talk about the full ENSO Cycle as ENSO is a giant solar battery. What that means is that during certain phases of ENSO, more heat is absorbed by the ocean from solar energy than released and in other phases, more heat is released than absorbed from solar energy. Thus ENSO is a process of absorbing and then releasing energy.
There are a number of physical processes involved but the main one is that during the La Nina phase there is a smaller area of thicker warm water that is driven by the Easterlies over to the Western Pacific Tropical “Warm Pool” and thus there is less surface evaporation and during the El Nino phase, the warm water spreads out to the Central and Eastern Tropics and there is more evaporation i.e. release of heat to the atmosphere. In addition, the ocean behavior is “coupled” with the behavior of the atmosphere so in the different phases (including ENSO Neutral as a phase) there are different amounts and location of convection i.e. clouds, so this changes the receipt, return and trapping of solar energy. Thus there is much to understand.
Graphics, even if they are what is called cartoons because they are simple pictures of what is going on rather than scientific data with quantification, can help in understanding the process. Today I decided to use some graphics from one of Bob Tisdale’s many presentations in this case the full presentation can be found here.
I have somewhat similar graphics that are always available in the addendum to this report where you click to find all the updated maps etc. But these graphics from Bob Tisdale are especially good for addressing the question of how ENSO works as a solar battery.

Here is Bob Tisdale’s more technical discussion of how this battery works.
“Let’s discuss El Niño and La Niña events and examine how and why sunlight and infrared radiation over the tropical Pacific respond as they do to ENSO. First we have to discuss the normal conditions of the tropical Pacific. Normal is also referred to as ENSO-neutral, because El Niño or La Niña conditions do not exist then. During ENSO-neutral conditions, there is a large difference in temperatures between the eastern and western equatorial Pacific. Sunlight warms the waters of the tropical Pacific as they travel from east to west, so that it’s about 7 deg C warmer in the west than in the east. Since the water is warmer in the west near Indonesia, there is more evaporation, more cloud cover and more precipitation there than in the east near South America. Now, during an El Niño, warm water from the surface and below the surface of the west Pacific Warm Pool sloshes east along the equator raising the sea surface temperatures of the eastern tropical Pacific—and the tropical Pacific as a whole. The convection, cloud cover and precipitation accompany the warmer water as it travels east. Obviously, if there are now more clouds than normal in the eastern tropical Pacific during the El Niño, then those clouds are blocking sunlight, or, in other words, downward shortwave radiation decreases due to the increased cloud cover during El Niños. Pavlakis et al (2006) “ENSO surface longwave radiation forcing over the tropical Pacific” has a nice summary of why downward longwave (infrared) radiation increases during an El Niño. They write:
“The DLR (editor’s note: DLR stands for downward longwave) depends mainly on the vertical distributions of temperature and water vapour in the lower troposphere, as well as on the cloud amounts and cloud radiative properties.”
In other words, during an El Niño, downward longwave radiation increases in the eastern tropical Pacific because the sea surface temperatures are warmer, which results in warmer lower troposphere temperatures and more water vapor due to the increase in evaporation, which, in turn, results in increased cloud amounts.
On the other hand, during a La Niña, the trade winds are stronger than normal. This causes more cool water to be upwelled in the eastern tropical Pacific. The cooler water in the east results in less evaporation and cloud cover, which allows more sunlight to warm the tropical Pacific waters as they travel from east to west. The stronger trade winds also push the clouds farther to the west, which also allows more sunlight than normal to warm the tropical Pacific. With respect to infrared radiation, cooler surface temperatures in the east cause cooler lower troposphere temperatures and less water vapor due to the decrease in evaporation, which, in turn, results in decreased cloud amounts—all of which cause less downward longwave (infrared) radiation over the tropical Pacific during La Niñas.”
Again there are many sources where you can learn about how ENSO works but the above is a good discussion of how it might influence (or not influence) global temperatures
Bob Tisdale makes some good points, but there still remains certain key questions:
- Is the behavior of the ENSO Cycle independent of the changing level of greenhouse gases: what I call the Top of the Atmosphere (TOA) theory of Climate Change which is simply that there is a positive balance of solar energy coming in versus solar energy leaving. I could provide references on this, but it is all covered in the IPCC Working Group 1 Report including factors other than GHG which might impact the TOA energy balance. .
- Bob Tisdale claims that ENSO drives the PDO and he may or may not be correct. But there is clearly a correlation between the PDO index and the ratio of El Nino to La Nina events. So the question of whether ENSO drives the PDO or the PDO drives ENSO may not be very significant. But what is significant is the question of whether or not and how might the TOA energy imbalance over time impact the ratio of El Ninos to La Nina events. Is it changing over time? Might the ENSO process itself impact these ratios and how they might change over time? This question includes the apparent non-independence of individual El Nino events and similarly the non-independence of La Nina events i.e. the probability of one phase repeating is higher if that same phase has occurred recently: especially a strong version of it. This echo phenomenon if it is confirmed is a bit of a deviation from the battery concept which implies charging followed by discharge followed by charging etc. Or it means that the battery concept is more complicated than a simple battery.
- The net gain which Tisdale claims of El Nino over the loss from La Nina is according to Bob Tisdale related to a wide variety of ocean currents and wind patterns some of which are described here. So the question is have any of these currents or wind patterns been impacted by the TOA cumulative increase in energy? Or indeed has the process described by Bob Tisdale changed the external drivers of ENSO?
- And finally why has the cooling prior to the Industrial Revolution been reversed since the industrial revolution? This is the central question in my mind. I believe that Bob Tisdale’s analysis is correct but it does not refute the TOA hypothesis. The TOA hypothesis is I believe adequately addressed in the IPCC AR5 WG1 Report.
So my conclusion is that Tisdale’s theory of Global Warming is incomplete, but he has mastered the impact of ENSO and the IPCC would be well advised to incorporate his findings into their models. I suspect they will and this will be apparent in AR6.
Relating ENSO to the Global Warming Hiatus
Understanding ENSO is clearly important in terms of forecasting current and next year’s climate. But it is also important to understand ENSO to the extent it is partially or fully responsible for what has been labeled the “Hiatus” in the rapid rise of surface and troposphere temperatures.
It is interesting to read the two very different explanations for the “Hiatus” in rising temperatures. I began to talk about this last week and hope to complete this complex and contentious discussion this week. It is very important because we all know the IPCC models do not handle what they call “internal variability” very well at this point which makes the models less useful when asking the question what is our climate likely to be like over the next forty years. The IPCC models mainly predict climate at the end of this Century. Whether they do that correctly is a different question than the one I am addressing here although it is not unrelated.
The concept of a Hiatus was really introduced by David Rose in this article. Since it was news, I published a GEI article. At about the same time, Kevin Trenberth of NCAR, published an important article which can be found here and which includes the following graphic.

It clearly shows the slowdown in temperature increase (currently and previously 1977-1985 and 1988-1997). Trenberth has his own explanation for this; an explanation which to me appears to be the explanation that is in the IPCC AR5 WG1. But I am not positive that they simply adopted his explanation as those writing teams are diverse. Nevertheless, the explanation that made sense to Trenberth appears to me to be the explanation that is in the recent report issued by the IPCC.
Tisdale has his own interpretation of what caused this temperature pattern. Some call this the “staircase” explanation.

A longer explanation of Tisdale’s position can be found here. And here is a more recent article on this issue but to me it does not add anything.
As I mentioned, this topic is discussed in great detail in the latest IPCC report: The Scientific Basis for Climate Change called the Working Group I Report of the IPCC Fifth Assessment (AR5). It can be found here.
So it is not like this is an issue I have selected out of the blue nor is it an issue that in my opinion has been adequately resolved. When a problem shows up with data not matching model projections and someone comes up with a hypothesis to explain the oddity of the observations, it is unrealistic to just assume their explanation is the correct answer. And yet it seems that agreeing with or not agreeing with this explanation has become some sort of litmus test for whether a person is a decent human being. Pretty ridiculous if you ask me.
And it gets even more ridiculous when you realize that the support or rejection of the Trenberth hypothesis is generally made by people who have no comprehension of the issues. It is also interesting when the two hypotheses are not that different but differ in ways that may be reconcilable. I provided some graphics on that last week and will not repeat them as this article is already far too long but you can find them here in my article from last week.
I prefer to try to sort out what we might learn from the facts especially when after looking at the facts it kind turns out that everyone may be at least partially correct about the Hiatus. But some explanations may be more correct than others or provide more insight or might be easier to incorporate into models etc.
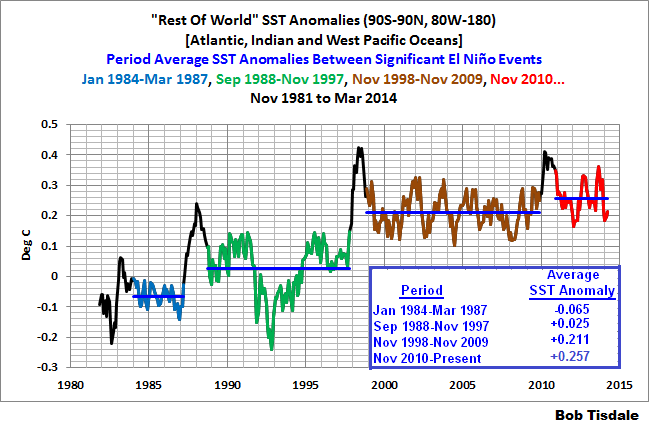
And here is another staircase focused on ocean surface temperatures but not those related to ENSO or the PDO.
What is curious is that the Climate Change defenders use the same analysis technique as does Bob Tisdale i.e. thinking about temperature rise as a staircase where we have periods of stability followed by a move to a higher level but when Tisdale uses that way of looking at things, it causes heartburn.
A possible explanation for this heartburn can be found in this article. It explains how our cultural values influence the way we process data. I have previously raised this issue before here.
- Motivated Numeracy and Enlightened Self-Government (Dan M. Kahan et al, Social Sciences Research Network) Hat tip to Sig Silber. When a set of data said to represent results about something apolitical is reviewed, increasing numeracy correlates with improved understanding of correlations represented. When the same set of data is said to represent results about something that is charged with political dissension, increasing numeracy is correlated to a poorer understanding of the correlations presented. If its political, smart people tend to see more that supports what they believe and less that is contradictory. Here is a link to the full working paper manuscript.
Some of these issues are made additionally complicated by what is called the 1976 Climate Shift. The 1976 Climate shift is described here but the explanation provided in that article is one of many different explanations that you might find in the literature. Tisdale provides an interesting discussion of the 1976 Climate Shift here and an interesting graphic.

What happened is that NOAA changed the reference values for computing Nino 3.4 anomalies i.e. the ONI Index and what you now have according to NOAA is:
“ONI values during 1950-1955 will be based on the 1936-1965 base period, ONI values during 1956-1960 will be based on the 1941 – 1970 period, and so on and so forth.
In real-time operations, the past 30-year base period (e.g. 1981-2010) will continue to be used to compute the departure from average. However, CPC,will create an traditional 30-year base period every 5 years instead of every 10 years (the next update will be at the beginning of 2016). When the 5 year updates occur, the ONI values over the most recent decade will change slightly because of the inclusion of the most recent data.”
This is all explained here. With the revised referenced values you end up with a plot of the ONI Index prepared by Bob Tisdale that looks like this:

It is no wonder that many people have less than full confidence in the data. The data may not be perfect but in many cases the way the data has been manipulated prior to presentation makes its interpretation almost impossible. One thing for sure is that one must be careful not to use a index value as a surrogate for the underlying actual data. The index is used for a particular purpose and it may be very useful for that purpose but if you do not understand how that index is calculated, one can easily misinterpret the interpretation if you use the index for a purpose that it is not the purpose for which the index is intended
Tisdale’s full challenge to Global Warming can be found here but that is not the topic of this discussion. I am not writing about the overall subject of Global Warming but only about the role that ENSO and other ocean cycles might play in Global Warming. Unlike Bob Tisdale, I believe in anthropogenic climate change but I also see the impact of ocean cycles in the progression of that process.
This completes the discussion I wanted to have on ENSO and how it may or may not impact Global Warming. I am not sure that there is more that I can add that would be useful. To me, the two best people to debate this topic are Bob Tisdale and Kevin Trenberth and I have provided links to their primary statements on this issue. So you can pursue this on your own.
Short Digression
I promised not to get into the general topic of Global Warming but I find this graphic by Bob Tisdale too interesting not to include it. Is shows that the increase in ocean surface temperatures has occurred in places other than where ENSO occurs. Not sure how this supports Bob Tisdale’s position but I did find this graphic very interesting.

To me this is an interesting graphic because it suggests that the focus on ENSO or to the extent they impact the Eastern Pacific, the PDO, or the IPO is misplaced. The ocean surface warming has taken place somewhere else than along the Equator or the Eastern Pacific.
I am now going to return to my proper role of explaining how this might impact weather, climate and economics.
Update on the North American Monsoon
The following map is the mid-atmosphere 7-Day chart.

As you can see, the Summer of Retrograde has at least temporarily sent the Four Corner’s High down Mexico Way although it now seems to be attempting to return to a more normal location for this time of the year. But not to worry as the Southwest is now enjoying Midwest weather which is a lot wetter than this area is used to. The Four Corners High moves around a lot and will soon return to a position where it will be more effective at providing a conduit for southern moisture to enter the Southwest U.S. Also with the Four Corners high further south than usual, other weather patterns can impact the Southwest. All of this is I believe a short-term impact that will be history within two or three weeks.
Click here for the latest data from NOAA (National Oceanic and Atmospheric Administration) and other sources on the Econintersect Weather and Climate page.


