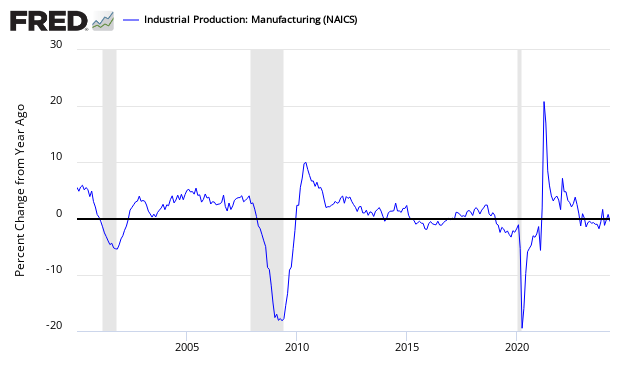
Of the three regional Federal Reserve surveys released to date, all show manufacturing expanding in April 2014.
Fifth District manufacturing activity improved in April, according to the most recent survey by the Federal Reserve Bank of Richmond. Shipments and the volume of new orders increased. Employment rose, while wages advanced at a slower rate. The average workweek was unchanged from a month ago.
Manufacturers looked for stronger business conditions during the next six months, although expectations were below last month’s outlook. Compared to last month’s outlook, survey participants anticipated somewhat slower growth in shipments, new orders, and capacity utilization. Manufacturers also looked for slower growth in employment and wages. In addition, expectations were for little change in the average workweek. They predicted vendor lead times would edge up at about the same pace as March’s outlook.
Current prices of raw materials and finished goods rose at a slower pace in April compared to last month. Manufacturers expected faster growth in prices paid and prices received over the next six months, although their outlook was below last month’s predictions.
Current Activity
The composite index for manufacturing strengthened by 14 points to a reading of 7. The index for new orders increased 19 points and the index for shipments rose 15 points. Those gauges ended at readings of 10 and 6,respectively. In addition,the index for the number of employees gained four points to end at a reading of 4.
The index for order backlogs improved by four points from last month’s reading to −9. The capacity utilization index moved to a flat reading of 1 from −14. Vendor lead time shortened slightly, shifting the index to 3 from a reading of 6.
Finished goods inventories built up at a slightly faster pace compared to a month ago. Raw materials inventories grew more slowly compared to last month. Those indexes finished at 15 and 7, respectively.
Read entire source document from Richmond Fed
Summary of all Federal Reserve Districts Manufacturing:
Richmond Fed (hyperlink to reports):
/images/z richmond_man.PNG
Kansas Fed (hyperlink to reports):
/images/z kansas_man.PNG
Dallas Fed (hyperlink to reports):
/images/z dallas_man.PNG
Philly Fed (hyperlink to reports):
/images/z philly fed1.PNG
New York Fed (hyperlink to reports):
/images/z empire1.PNG
Federal Reserve Industrial Production – Actual Data (hyperlink to report)

Holding this and other survey’s Econintersect follows accountable for their predictions, the following graph compares the hard data from Industrial Products manufacturing subindex (dark blue bar) and US Census manufacturing shipments (lighter blue bar) to the Richmond Fed Survey (dark green bar).
Comparing Surveys to Hard Data
![]()


/images/z survey1.png
In the above graphic, hard data is the long bars, and surveys are the short bars. The arrows on the left side are the key to growth or contraction.


