This is the first manufacturing survey in March which shows contraction. Please see below.
TENTH DISTRICT MANUFACTURING SURVEY FELL AT A SLOWER RATE
The Federal Reserve Bank of Kansas City released the March Manufacturing Survey today. According to Chad Wilkerson, vice president and economist at the Federal Reserve Bank of Kansas City, the survey revealed that Tenth District manufacturing activity fell at a slower rate, but producers were considerably more optimistic about future months.
“Factory activity rebounded somewhat in March, although overall levels still remain sluggish. Contacts continued to cite uncertainty about healthcare costs and the overall economy as reasons for lower growth,” said Wilkerson. “However, the outlook for future activity was notably more positive than in previous months.”
Summary of all Federal Reserve Districts Manufacturing:
Richmond Fed (hyperlink to reports):
/images/z richmond_man.PNG
Kansas Fed (hyperlink to reports):
/images/z kansas_man.PNG
Dallas Fed (hyperlink to reports):
/images/z dallas_man.PNG
Philly Fed (hyperlink to reports):
/images/z philly fed1.PNG
New York Fed (hyperlink to reports):
/images/z empire1.PNG
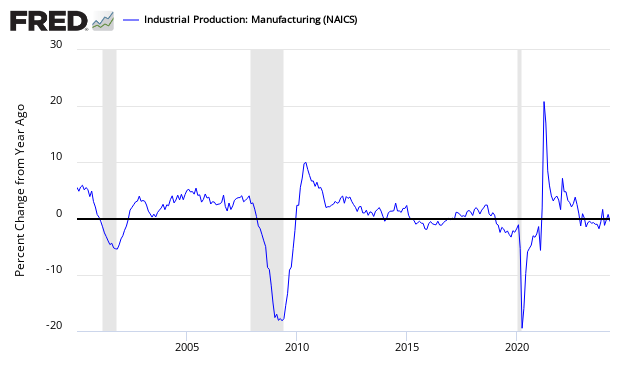
Federal Reserve Industrial Production – Actual Data (hyperlink to report)

Holding this and other survey’s Econintersect follows accountable for their predictions, the following graph compares the hard data from Industrial Products manufacturing subindex (dark blue bar) and US Census manufacturing shipments (lighter blue bar) to the Kansas City Survey (pea-green bar).
Comparing Surveys to Hard Data
![]()


/images/z survey1.png
In the above graphic, hard data is the long bars, and surveys are the short bars. The arrows on the left side are the key to growth or contraction.


