by James D. Hamilton, Econbrowser.com
Appeared originally at Econbrowser 01 March 2015
The yield on a 10-year Treasury inflation protected security was negative through much of 2012 and 2013, and remains today below 0.25%. Have we entered a new era in which a real rate near zero is the new normal? That’s the subject of a new paper that I just completed with Ethan Harris, head of global economics research at Bank of America Merrill Lynch, Jan Hatzius chief economist of Goldman Sachs, and Kenneth West professor of economics at the University of Wisconsin, which we presented at the U.S. Monetary Policy Forum annual conference in New York on Friday.

For the project we assembled annual data on the interest rate set by the central bank (or close substitute) along with inflation estimates for 20 different countries going back in some cases to 1800, along with more detailed quarterly data since 1970. We constructed a proxy for expected inflation using autoregressions estimated over rolling windows. The figure below plots the resulting annual series for the ex-ante real interest rates for eight of the countries we looked at.

Ex-ante real interest rates for Australia, Denmark, France, Netherlands, Norway, Spain, Great Britain, and the United States, 1858-2014.
Source: Hamilton, Harris, Hatzius, and West (2015).
We found little support in these data for two of the popular conceptions many people have about real interest rates. First, although it is often assumed in theoretical models that there is some long-run constant value toward which the real interest rate eventually returns, our long-run data lead us to reject that hypothesis, consistent with other studies of postwar data by Caporale and Grier (2000), Bai and Perron (2003), and Rapach and Wohar (2005). For most countries, real rates were significantly higher before World War I than they have been since. The world wars were associated with big negative real rates, spectacularly so for countries like Germany, Japan, Italy, and Finland (not shown in the figure above).
We also found little support for the popular assumption that the long-run economic growth rate is the primary factor driving changes in the equilibrium real interest rate over time. The graph below summarizes the U.S. experience over the last 7 economic expansions. The figure plots the average annual real GDP growth rate from business cycle peak to peak on the vertical axis and the average real interest rate on the horizontal axis. The correlation is actually negative, contrary to the popular assumption that a higher long-run GDP growth rate would be associated with a higher long-run equilibrium real rate, though we could get a modestly positive correlation if we threw out the brief expansion ending in 1981:Q3.
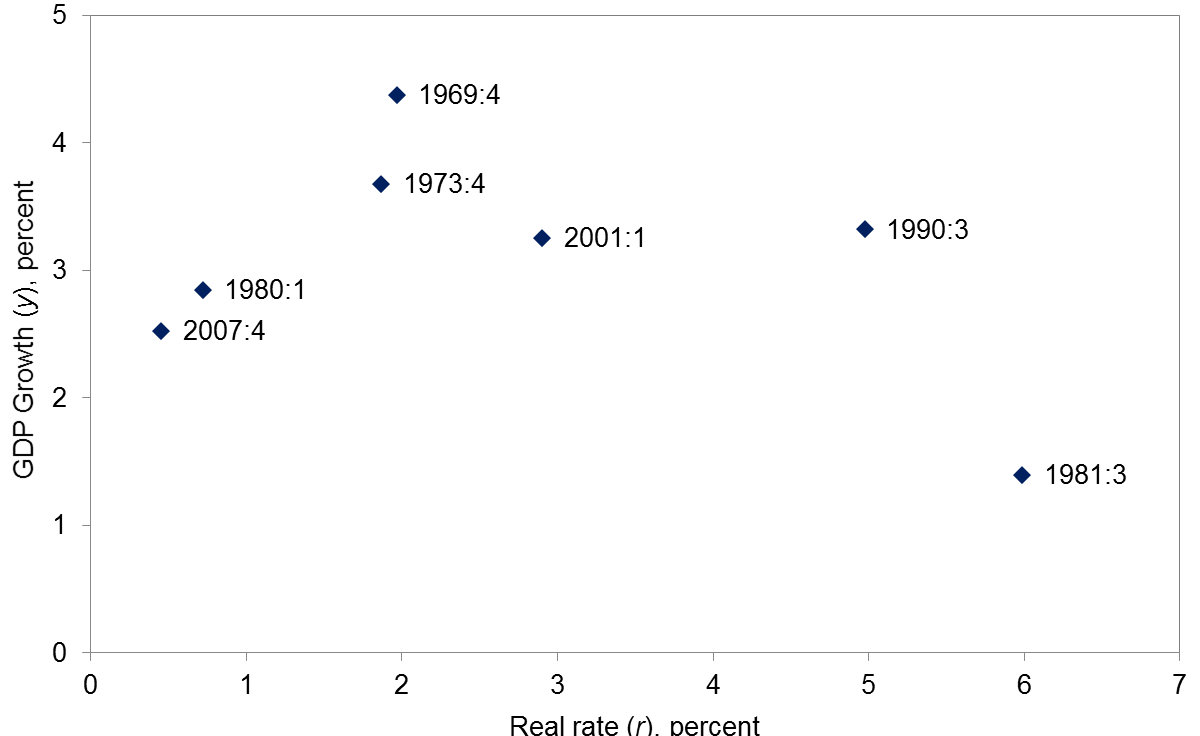
Peak-to-peak average U.S. real GDP growth versus average ex-ante real interest rate, quarterly data 1969:Q4-2007:Q4.
Source: Hamilton, Harris, Hatzius, and West (2015).
Using the longer annual data set, we found a positive correlation between the growth rate and real interest rate across business cycles, (correlation of +0.23 and R2 of 0.05). But this correlation would become -0.23 if we dropped the cycles ending in 1920 and 1948.
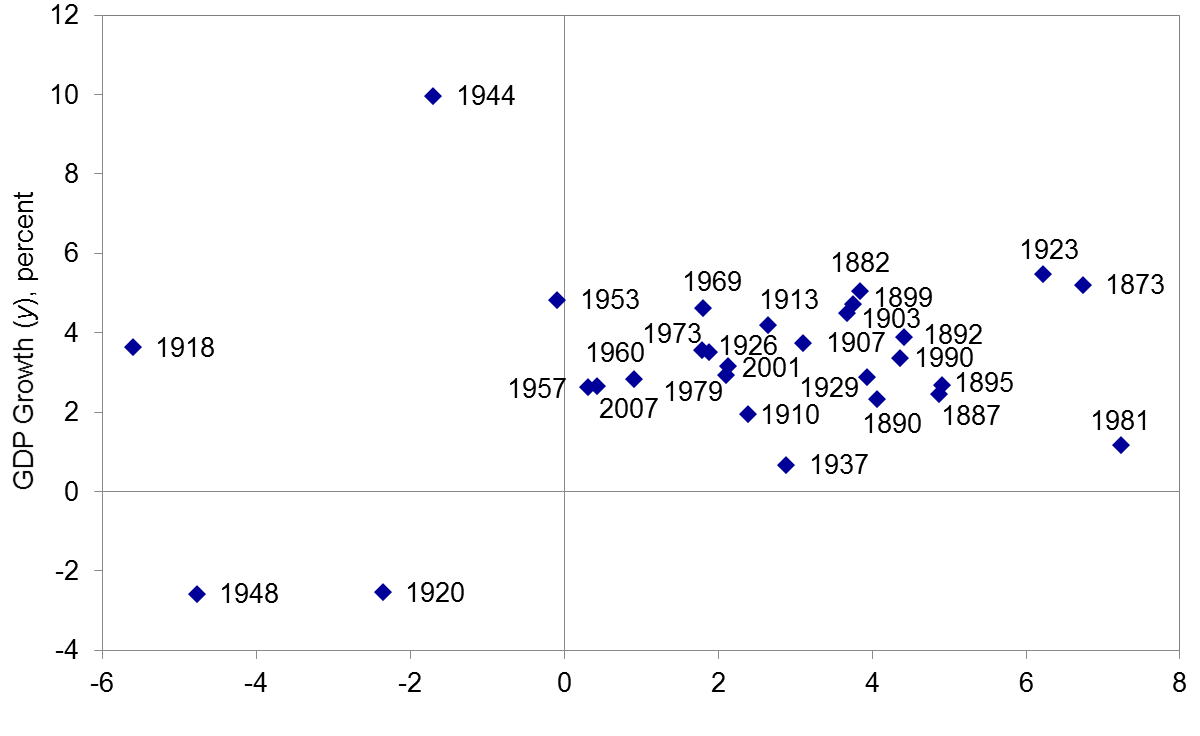
Peak-to-peak average U.S. real GDP growth versus average ex-ante real interest rate, annual data, 1873-2007.
Source: Hamilton, Harris, Hatzius, and West (2015).
If we look at cross-sectional evidence of 30-year averages of growth rates and real rates across countries, we find a correlation of 0.42 (R2 = 0.18). But this correlation would become negative if Australia had not been included. We come away from our investigation quite skeptical of any analysis that puts growth of actual or potential output at the center of long-run real interest rate determination.
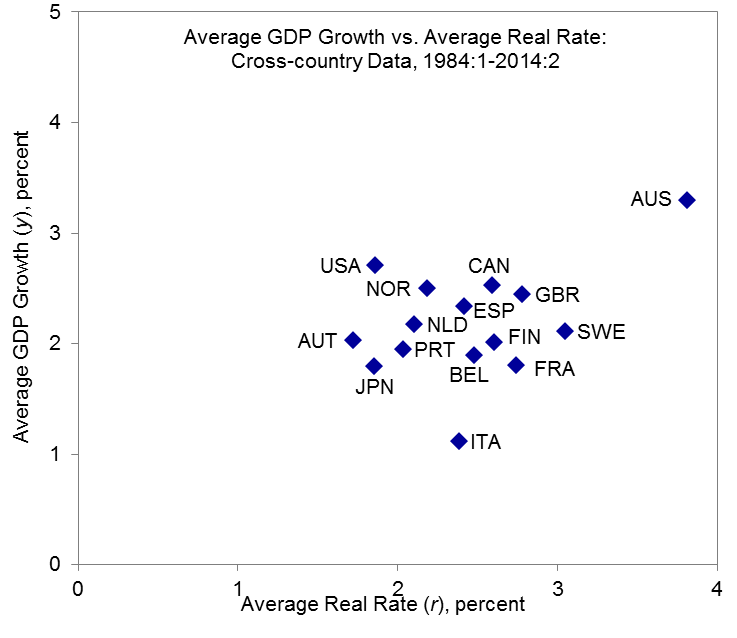
Cross-country scatterplot of average real GDP growth rate over 1984:Q1 to 2014:Q2 (vertical axis) and ex ante real rate.
Source: Hamilton, Harris, Hatzius, and West (2015).
Our paper provides a detailed narrative discussion of what seems to explain changes in long-term averages of the real interest rate over time. We conclude that changes in personal discount rates, financial regulation, trends in inflation, bubbles and cyclical headwinds have had important effects on the average real rate observed over any given decade. We examine the secular stagnation hypothesis in detail. On balance, we find it unpersuasive, concluding that it confuses a delayed recovery with chronically weak aggregate demand.
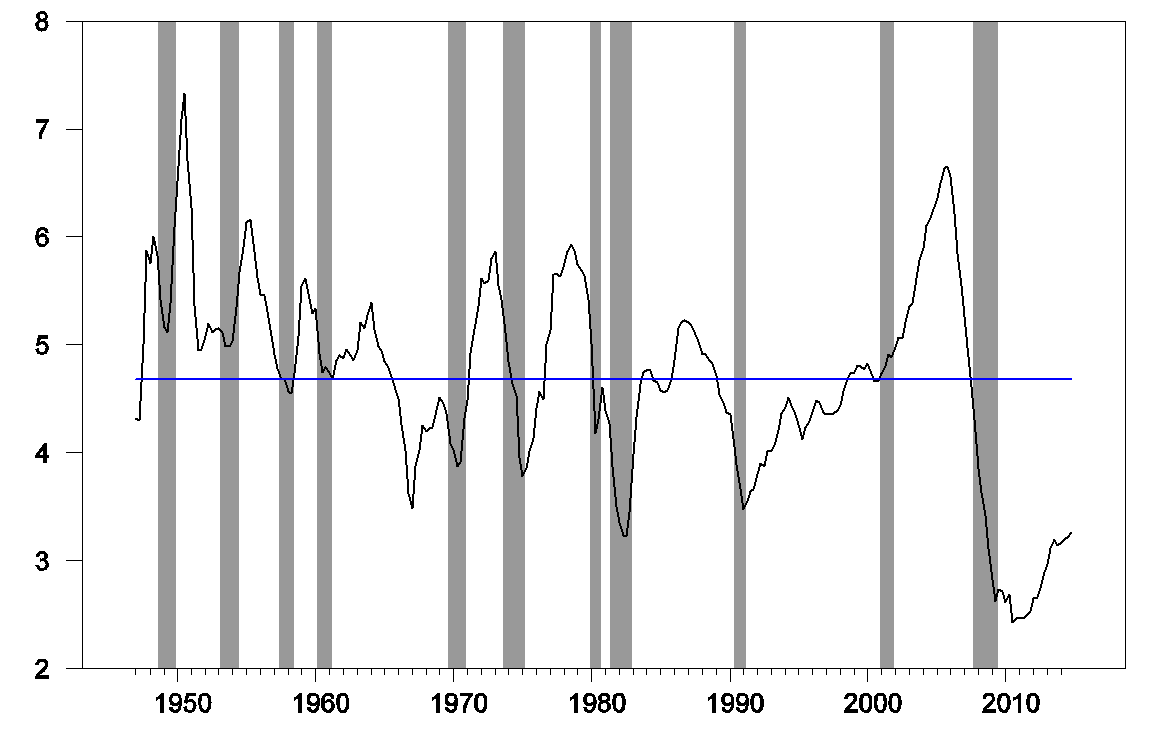
One point that is often lost in discussions of these issues is the role of the monetary tightening cycle. As seen in the figure below, the gap between the nominal fed funds rate and the trailing one-year core inflation rate became quite high at the peak of each of the previous 5 monetary tightening cycles.
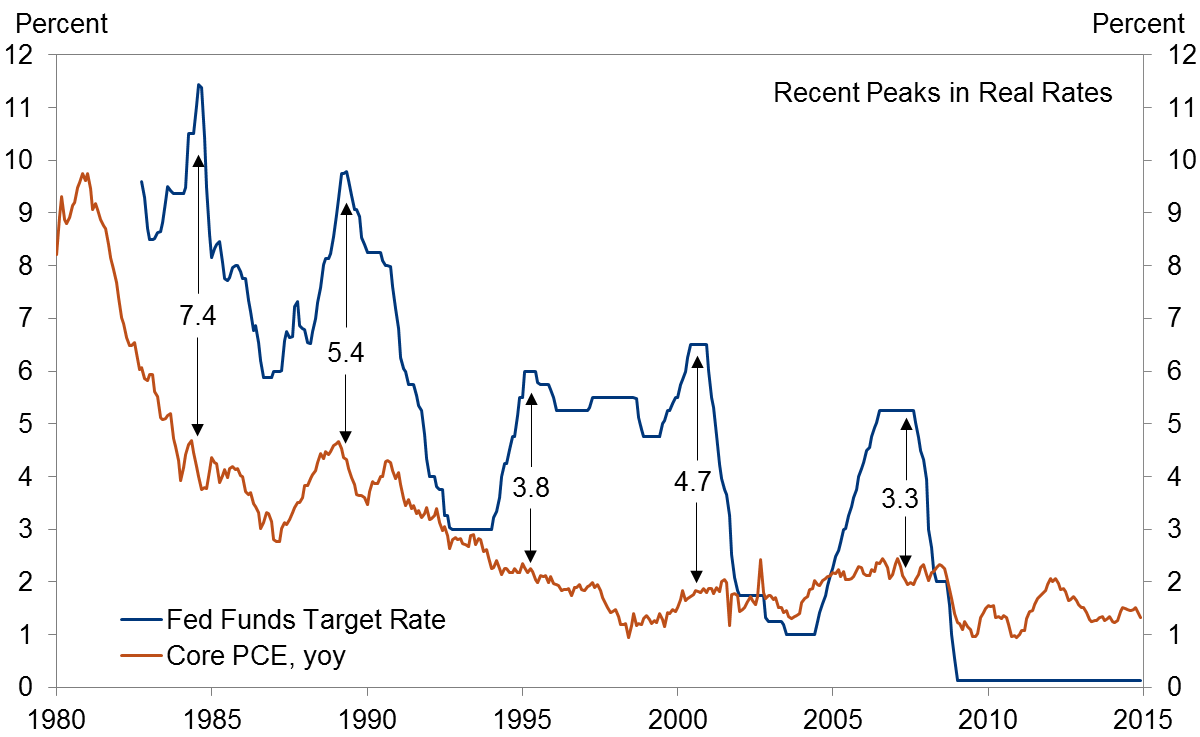
Nominal fed funds target (blue) and year-over-year change in core PCE deflator (red), 1980:M1-2014:M12.
Source: Hamilton, Harris, Hatzius, and West (2015).
Nevertheless, if one were to look at the size of that gap at the point when output equaled potential GDP– a point we have yet to reach in the current cycle– the real interest rate at that point would have still appeared to be quite low in several of those episodes.
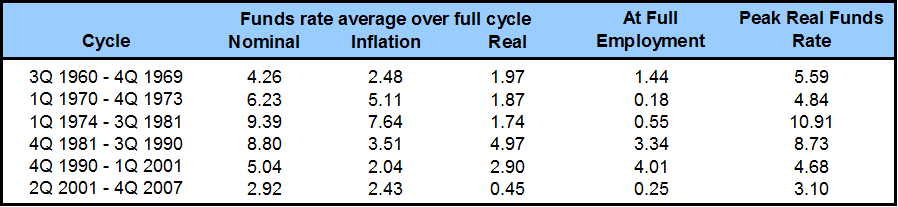
Nominal rates, inflation rates, and ex-ante real rates over postwar business expansions.
Source: Hamilton, Harris, Hatzius, and West (2015).
It’s worth remembering that recoveries from financial crises often take many years. Based on indicators such as housing investment as a percent of GDP, there is still significant potential for cyclical expansion in the U.S. Our paper reviews a great deal of evidence that leads us to conclude that those who see the current situation as a long-term condition for the United States are simply over-weighting the most recent data from an economic recovery that is still far from complete.
Black: path for fed funds rate implied by median forecast of FOMC members; blue: path for fed funds rate that would be optimal if Fed officials may have overestimated or underestimated r* by 150 basis points.
Source: Hamilton, Harris, Hatzius, and West (2015).
We found what appears to be a stable statistical relation in our long-run data set in the form of a cointegrating relation between the U.S. ex-ante real interest rate (plotted in black in the figure below) and a measure that is similar to the median of 30-year-moving average real rates across the world (shown in blue). When the U.S. is below the long-run world rate, as it is now, we’d expect the U.S. rate to rise.
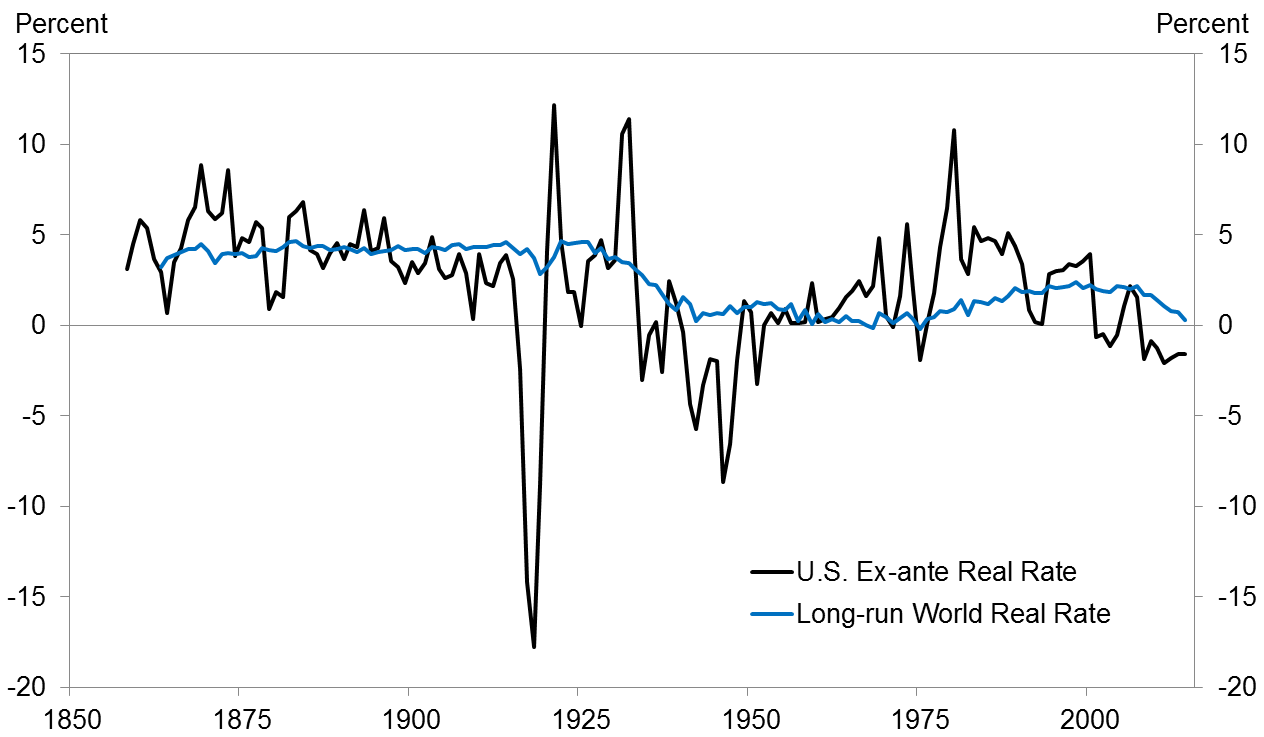
U.S. real rate and long-run world rate, 1858-2014.
Source: Hamilton, Harris, Hatzius, and West (2015).
We also calculated the current forecast implied by that cointegrating relation, which is shown in the figure below. We can have confidence that the U.S. and world rates will eventually converge to each other, but the exact value to which they will converge is subject to growing uncertainty the farther into the future we try to project, as a necessary consequence of the permanent and sometimes dramatic shocks to world equilibrium real rates that characterize the historical data.
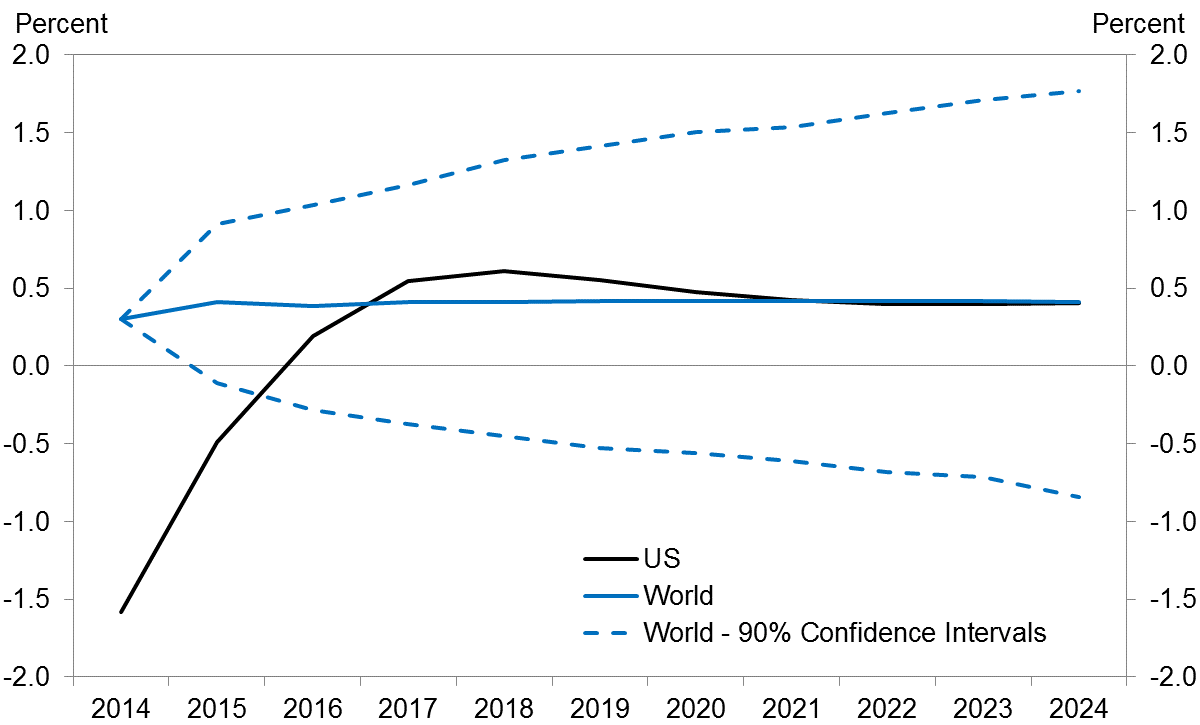
Current and projected values for the short-run U.S. ex-ante real rate (in black) and long-run world rate (in blue) along with 90% confidence intervals for the latter.
Source: Hamilton, Harris, Hatzius, and West (2015).
Finally, our paper discusses the implications of these findings for monetary policy. Orphanides and Williams have noted that if the central bank does not know the true value of long-run equilibrium magnitudes like the real interest rate, it pays to incorporate more inertia in the conduct of monetary policy. We perform some simulations using the FRB/US model to gauge the relevance of this concern in the current setting. We conclude that, given that we do not know the equilibrium real rate, there may be benefits to waiting to raise the nominal rate until we actually see some evidence of labor market pressure and increases in inflation. Relative to the “shallow glide path” for the funds rate that has featured prominently in recent Fed communications, our findings suggest that the funds rate should start to rise later but– provided the recovery does gather pace and inflation picks up– somewhat more steeply.
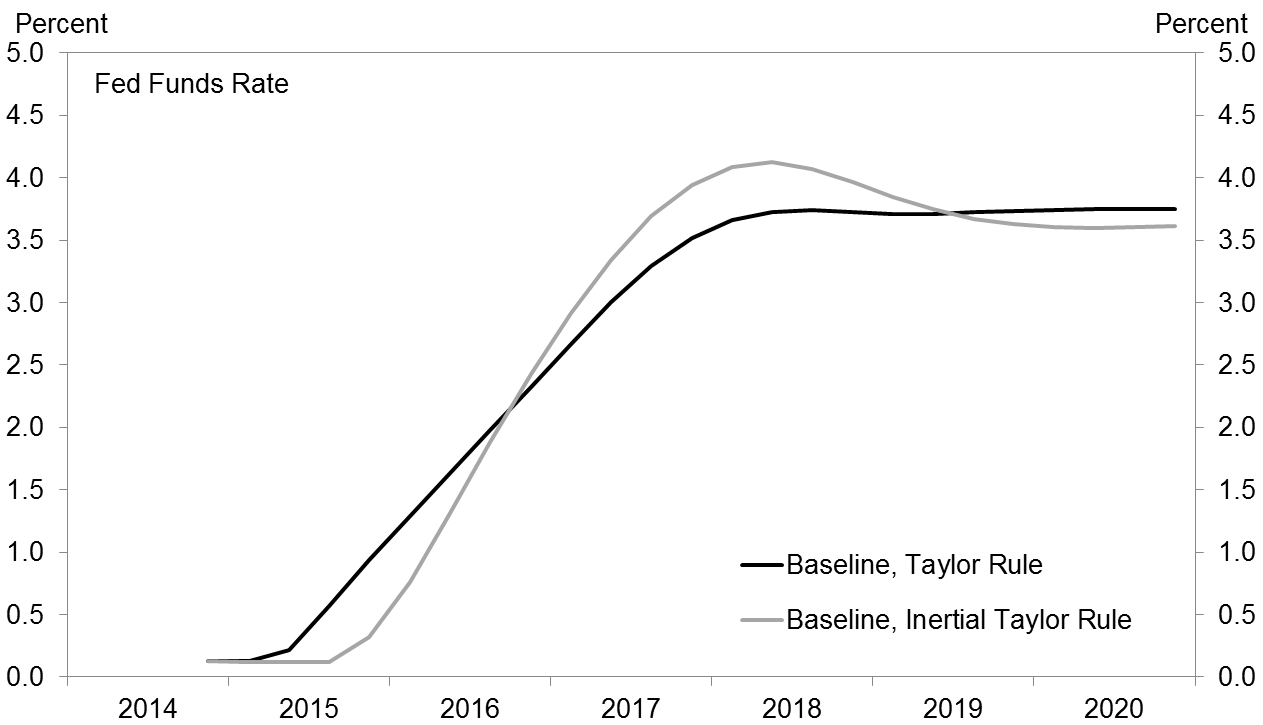
Black: path for fed funds rate implied by median forecast of FOMC members; blue: path for fed funds rate that would be optimal if Fed officials may have overestimated or underestimated r* by 150 basis points.
Source: Hamilton, Harris, Hatzius, and West (2015).


