by James D. Hamilton, Econbrowser.com
Appeared originally at Econbrowser 24 August 2014.
Roger Farmer has taken a new look at an issue concerning the Federal Reserve’s program of large-scale asset purchases (referred to in the popular press as “quantitative easing”) that I’ve been discussing on Econbrowser and in my research with University of Chicago Professor Cynthia Wu for some time.

One theory of how LSAP might affect interest rates is that if the Fed takes a large enough volume of long-term securities out of the hands of private investors, the drop in net supply could in principle lower the yields on those securities. In the years since the collapse of Lehman in September 2008, the Fed’s total assets more than quadrupled, and the Fed’s share of the total Treasury debt that was held in the form of longer-term securities increased significantly.
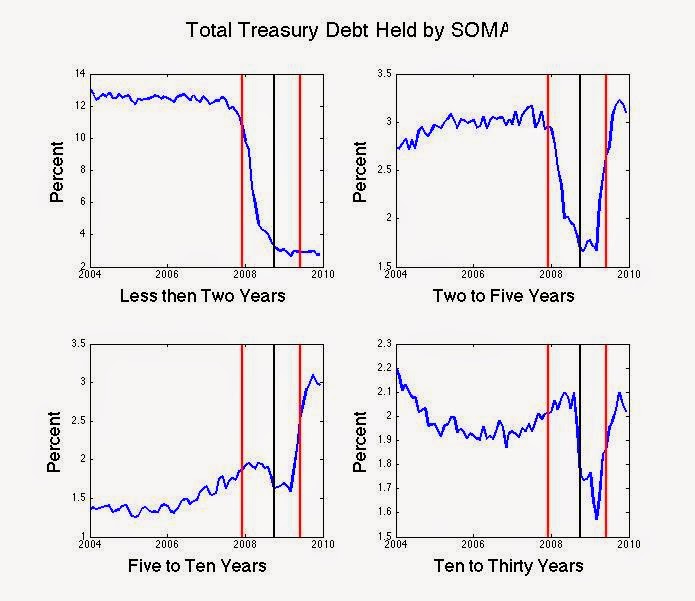
Percent of total Treasury debt held by the Federal Reserve in different maturity categories. Red lines mark beginning and end of the recession, black line marks Sept 2008.
Source: Roger Farmer.
But at the same time that the Fed was buying long-term Treasury debt in order to take these securities out of the hands of private investors, the Treasury was significantly increasing the fraction of debt that it issued that came in the form of longer maturities. The net result was that the fraction of Treasury debt that was of 2-10 year duration and that was held outside of the Federal Reserve actually increased significantly, despite the Fed’s bond-buying efforts. Thus according to one theory of how LSAP might affect the economy, all the Fed’s LSAP accomplished was to incompletely offset a contractionary impulse originating from the Treasury’s separate maturity issuance decisions.
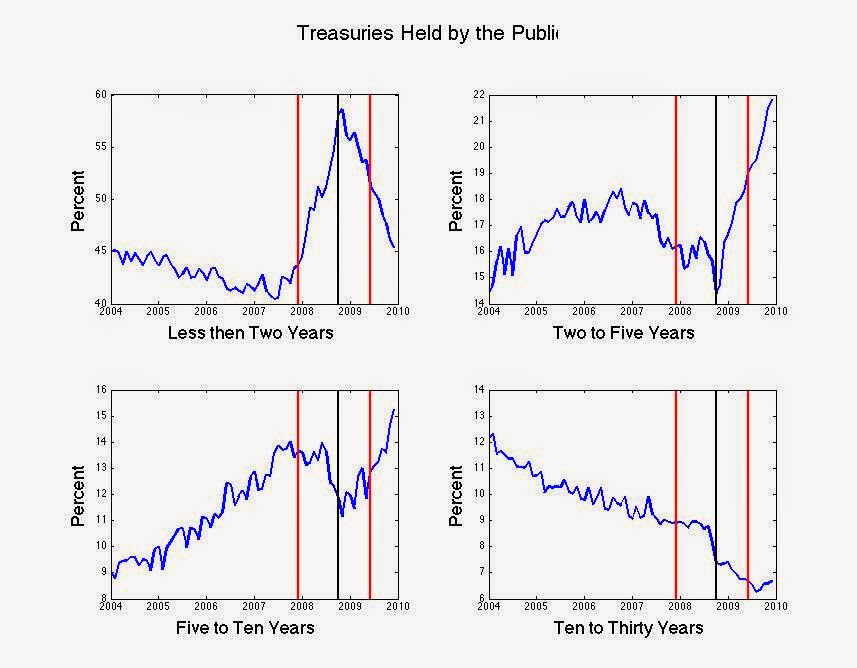
Percent of total Treasury debt held by the public in different maturity categories. Red lines mark beginning and end of the recession, black line marks Sept 2008.
Source: Roger Farmer.
A number of researchers have documented that on the days that changes in LSAP policy were announced there were noticeable changes in long-term interest rates; see for example Christensen and Rudebusch (2012). This evidence suggests that LSAP did indeed matter for yields. Notwithstanding, at the Fed’s Jackson Hole conference two years ago, Columbia Professor Michael Woodford noted that the net move in long-term interest rates over the entire duration of these programs provided little evidence to convince the skeptics. The 10-year yield actually rose between the beginning and end of the Fed’s first bond-buying program (LSAP1). The common interpretation is that some of the declines in the yield prior to the first purchases were actually a response to announcements and anticipation that the program was coming. Even so, any effects during the year of the program were evidently outweighed by other factors influencing bond yields that were changing at the same time. Nor are effects during the actual period when the Fed was engaged in its second bond-buying program (LSAP2) nor its deliberate effort to extend the maturity of its portfolio (MEP) particularly easy to spot in a long-term graph.
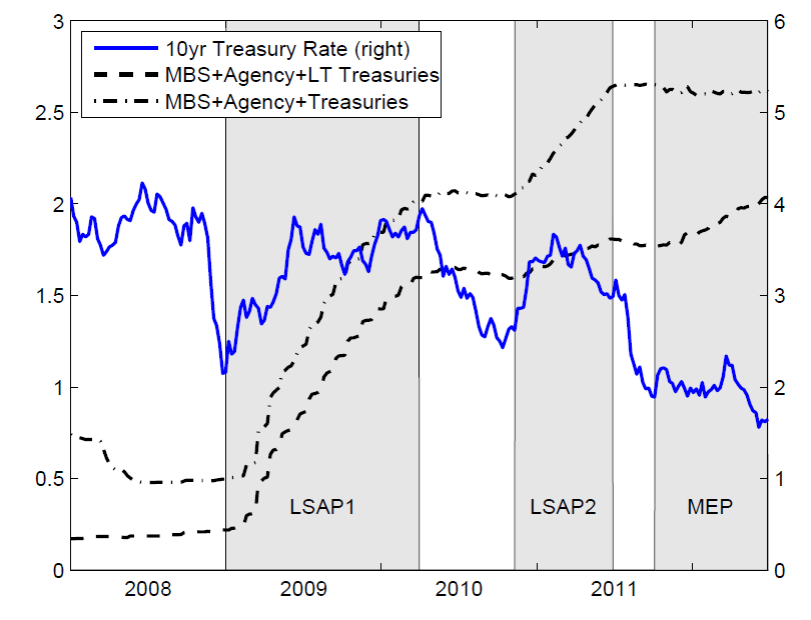
Yield on 10-year U.S. Treasury bonds, Jan 1, 2008 to Aug 11, 2012. LSAP1: Jan 5, 2009 through March 31, 2010; LSAP2:
Nov 12, 2010 through June 30, 2011; MEP: October 3, 2011 through last date in figure.
Source: Woodford (2012).
The market’s response in the minutes following new announcements about the Fed’s bond-buying program make it hard to deny there is some effect. For example, last year yields rose sharply attributed in part to speculation that the Fed would soon announce a slowdown in the rate of bond purchases, which some observers described as the market’s taper tantrum. Nevertheless, developments in addition to speculation about the Fed’s LSAP plans also contributed to the rise in rates at that time.
The natural reconciliation of this evidence is that it was not the bond purchases themselves that moved the market, but instead it’s what the purchases signaled in terms of future Fed decisions on short-term rates. Federal Reserve Bank of San Francisco researchers Michel Bauer and Glenn Rudebusch have provided some interesting evidence consistent with that interpretation.
My view is that LSAP did have an effect, but that it was primarily through this signaling channel rather than a direct impact on bond markets of the Fed’s purchases of long-term Treasury securities.


