Written by Steven Hansen
Too often I disagree with the RESULTS of the methodology used to analyze data releases. There is no methodology which is perfect – and for this reason I believe the less you screw with the raw data – the more consistent the results for baselining, comparing, and trending.

This week there was one confusing data release – retail sales – where the headlines continue to show worsening retail sales. Honestly, I really never will understand the seasonal adjusting analysis by the US Census. The unadjusted data clearly shows fairly strong retail sales.
Unadjusted Retail Sales by Month and by Year

And if one looks at percent growth year-over-year – February was a very good month.
Advance Retail Sales Year-over-Year Change – Unadjusted (blue line), Unadjusted with Inflation Adjustment (red line), and 3 Month Rolling Average of Unadjusted (yellow line)

Pay attention to the rolling average (yellow line in the above graph) – it shows improvement. One month of data can be an anomaly – but averaging data over time smooths out the unusual impacts (such as weather). Still, the rolling averages are still below the levels seen in 2014, and the results are not showing good times are here again.
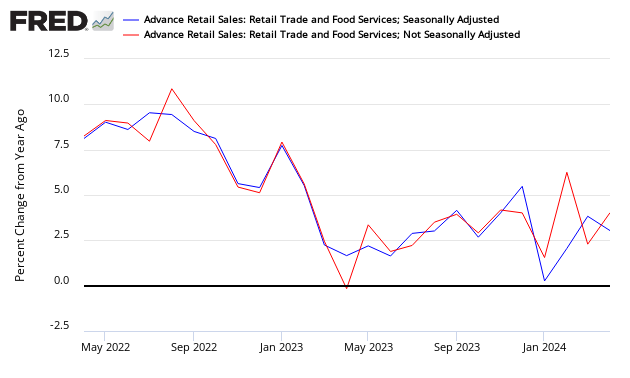
Even when looking at the year-over-year growth of the adjusted headline data and the unadjusted data, both show improvement year-over-year.
Comparison of the Year-over-Year Census Seasonally Adjusted Retail Sales (blue line) and Econintersect’s Unadjusted Retail Sales (red line)
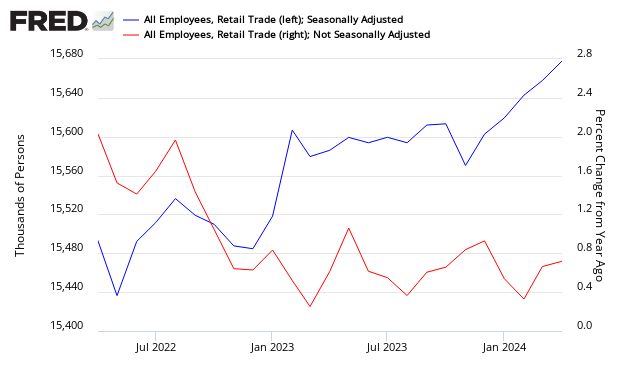
And to to continue to drive home the point that only US Census sees a decline in growth – here is employment data for the retail sector:
Retail Employment – Total Seasonally Adjusted (blue line, left axis) and Year-over-Year Change Unadjusted (red line, right axis)
I would not go to the bank with retail sales data in any event. The data will be adjusted for the next few months (which could adjust away some of the increase). Even though retail sales is very important to an economy based on consumption, this data point is not reliable, especially in real time, UNLESS confirmed by other data points.
The economy does not move at the same speed in all sectors, and I see a pigs breakfast of differing rates of growth – currently some sectors are contracting.
The evidence is that retail sales improved in February – contrary to the headlines. Is it a big deal? You be the judge.
Other Economic News this Week:
The Econintersect Economic Index for March 2016 marginally improved but remains relatively weak. The index continues at one of the lowest values since the end of the Great Recession. It remains to be seen if this improvement is a reversal of the long term decline of our index since late 2014.
Current ECRI WLI Growth Index

The market expectations (from Bloomberg) were 265,000 to 279,000 (consensus 270,000), and the Department of Labor reported 265,000 new claims. The more important (because of the volatility in the weekly reported claims and seasonality errors in adjusting the data) 4 week moving average moved from 267,250 (reported last week as 267,500) to 268,000. The rolling averages generally have been equal to or under 300,000 since August 2014.
Weekly Initial Unemployment Claims – 4 Week Average – Seasonally Adjusted – 2011 (red line), 2012 (green line), 2013 (blue line), 2014 (orange line), 2015 (violet line)

Bankruptcies this Week: ESP Resources (f/k/a/ Pantera Petroleum), Xenonics Holdings (Chapter 7), New Source Energy, Westech Capital (f/k/a Tejas),


