Written by Steven Hansen
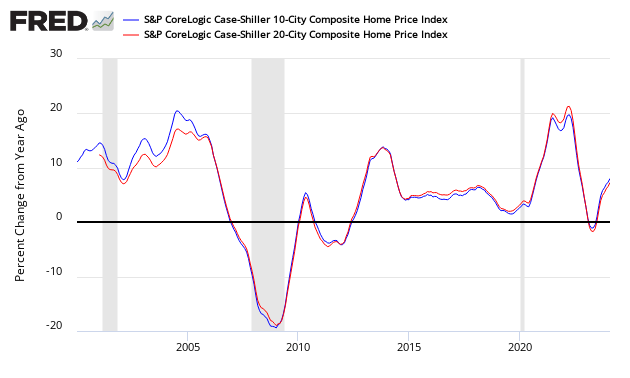
The non-seasonally adjusted Case-Shiller home price index (20 cities) for March 2014 (released today) rate of growth again declined slightly but showed the 22nd consecutive monthly year-over-year gain in housing prices since the end of the housing stimulus in 2010.
- 20 city unadjusted home price rate of growth decelerated 0.5% month-over-month. [note that headline unadjusted month-over-month change was +0.9% – Econintersect uses the change in year-over-year growth from month-to-month to calculate the change in rate of growth]
- Home prices increased 12.4% year-over-year (20 cities).
- The market had expected a year-over-year increase for the 20 city unadjusted index of 11.6% to 12.9% (consensus 11.9%) versus the 12.4% reported.
- Case-Shiller continues to show the highest year-over-year home price gains of any home price index.
S&P/Case-Shiller Home Price Indices Year-over-Year Change

Comparing all the home price indices, it needs to be understood each of the indices uses a unique methodology in compiling their index – and no index is perfect. The National Association of Realtors normally shows exaggerated movements which likely is due to inclusion of more higher value homes.
Comparison of Home Price Indices – Case-Shiller 3 Month Average (blue line, left axis), CoreLogic (green line, left axis) and National Association of Realtors 3 Month Average (red line, right axis)
/images/z existing3.PNG
The way to understand the dynamics of home prices is to watch the direction of the rate of change. Here home price growth is now decelerating.
Year-over-Year Price Change Home Price Indices – Case-Shiller 3 Month Average (blue bar), CoreLogic (yellow bar) and National Association of Realtors 3 Month Average (red bar)
/images/z existing5.PNG
There are some differences between the indices on the rate of “recovery” of home prices.
A synopsis of Authors of the Leading Indices:
Case Shiller’s David M. Blitzer, Chairman of the Index Committee at S&P Indices:
The year-over-year changes suggest that prices are rising more slowly. Annual price increases for the two Composites have slowed in the last four months and 13 cities saw annual price changes moderate in March. The National Index also showed decelerating gains in the last quarter. Among those markets seeing substantial slowdowns in price gains were some of the leading boom-bust markets including Las Vegas, Los Angeles, Phoenix, San Francisco and Tampa.
Despite signs of decelerating prices, all cities were higher than a year ago and all but New York were higher in March than in February. However, only Denver and Dallas have set new post-crisis highs and they experienced relatively lower peak levels than other cities. Four locations are fairly close to their previous highs: Boston (8%), Charlotte (9%), Portland (13%) and San Francisco (15%).
Housing indicators remain mixed. April housing starts recovered the drop in March but virtually all the gain was in apartment construction, not single family homes. New home sales also rebounded from recent weakness but remain soft. Mortgage rates are near a seven month low but recent comments from the Fed point to bank lending standards as a problem. Other comments include arguments that student loan debt is preventing many potential first time buyers from entering the housing market.
CoreLogic believes home price growth is weakening (March Data). Per Mark Fleming, chief economist for CoreLogic and Anand Nallathambi, president and CEO of CoreLogic:
March data on new and existing home sales was weaker than expected and is a cause for concern as we enter the spring buying season. Interest rate-disenfranchised potential sellers are adding to the existing shadow inventory, while buyers who can’t find what they want to buy are on the sidelines creating a new kind of ‘shadow demand.’ This supply and demand imbalance continues to drive home prices higher, even though transaction volumes are lower than expected.
Home prices continue to rise across the nation, but affordability, tight credit and supply concerns are becoming an increasing drag on purchase market activity. In many markets – especially major metro areas like Los Angeles, Atlanta and New York – home prices are being driven up at double-digit rates fueled by a lack of inventory and record levels of cash purchases.
The National Association of Realtors live in their own world of hype (April 2014 data). Per Lawrence Yun , NAR chief economist and Steve Brown, NAR President:
Lawrence Yun, NAR chief economist, expected the improvement. “Some growth was inevitable after sub-par housing activity in the first quarter, but improved inventory is expanding choices and sales should generally trend upward from this point,” he said. “Annual home sales, however, due to a sluggish first quarter, will likely be lower than last year.” “We’ll continue to see a balancing act between housing inventory and price growth, which remains stronger than normal simply because there have not been enough sellers in many areas. More inventory and increased new-home construction will help to foster healthy market conditions,” Yun added.
NAR President Steve Brown said there was some heating of the market last month. “The typical time on market shrunk in April, with four out of 10 homes selling in less than a month,” he said. “Homes that show well and are properly priced tend to sell the fastest. More housing inventory gives buyers better choices, and takes the pressure off of the buying process, which is a welcome sign, especially for first-time buyers.”
Black Knight Financial Services (formerly known as Lender Processing Services) March 2014 home price index up 1.0% for the Month; Up 7.0% Year-over-Year.

Econintersect publishes knowledgeable views of the housing market.
Caveats on the Use of Home Price Indices
The housing price decline seen since 2005 varies by zip code – and seems to have ended somewhere around the beginning of the 2Q2012. Every area of the country has differing characteristics. Since January 2006, the housing declines in Charlotte and Denver are well less than 10%, while Las Vegas home prices had declined almost 60%.
Each home price index uses a different methodology – and this creates slightly different answers. There is some evidence in various home price indices that home prices are beginning to stabilize – the evidence is also in this post. Please see the post Economic Headwinds from Real Estate Moderate.
The most broadly based index is the US Federal Housing Finance Agency’s House Price Index (HPI) – a quarterly broad measure of the movement of single-family house prices. This index is a weighted, repeat-sales index on the same properties in 363 metro centers, compared to the 20 cities Case-Shiller.
The US Federal Housing Finance Agency also has an index (HPIPONM226S) based on 6,000,000 same home sales – a much broader index than Case-Shiller. Also, there is a big difference between home prices and owner’s equity (OEHRENWBSHNO) which has been included on the graph below.
Comparing Various Home Price Indices to Owner’s Equity (blue line)


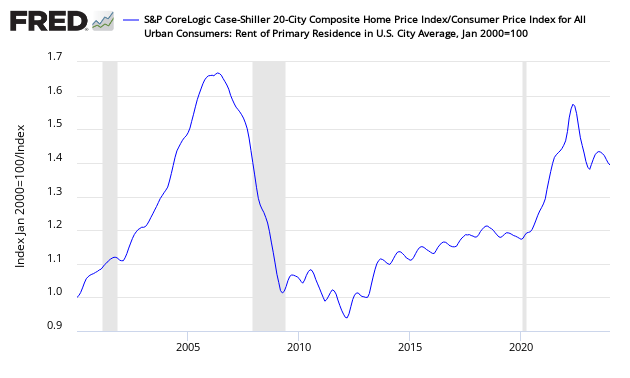
With rents increasing and home prices declining – the affordability factor favoring rental vs owning is reversing. Rising rents are shifting the balance.
Price to Rent Ratio – Indexed on January 2000 – Based on Case-Shiller 20 cities index ratio to CPI Rent Index

Related Articles
Old Analysis Blog | New Analysis Blog |
| Housing Sales and Prices | Housing Sales and Prices |


