Written by Steven Hansen
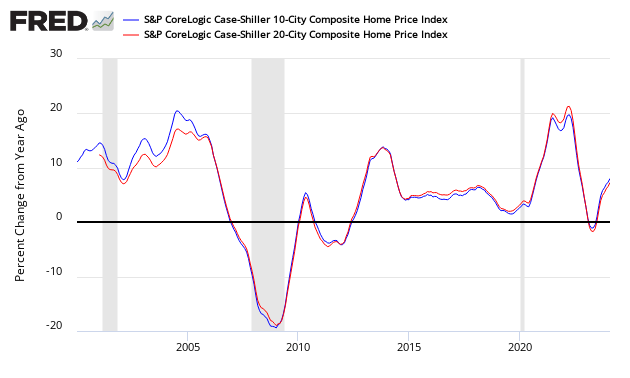
The non-seasonally adjusted Case-Shiller home price index (20 cities) for January 2014 (released today) declined again slightly but showed the 20th consecutive monthly year-over-year gain in housing prices since the end of the housing stimulus in 2010.
- Home price rate of growth decelerated 0.1% month-over-month.
- Home prices increased 13.2% year-over-year (20 cities).
- The market had expected a year-over-year increase of 11.2% to 13.8% (consensus 13.3) versus the 13.2% reported.
- Case-Shiller continues to show the highest year-over-year home price gains of any home price index.
S&P/Case-Shiller Home Price Indices Year-over-Year Change

Comparing all the home price indices, it needs to be understood each of the indices uses a unique methodology in compiling their index – and no index is perfect. The National Association of Realtors normally shows exaggerated movements which likely is due to inclusion of more higher value homes.
Comparison of Home Price Indices – Case-Shiller 3 Month Average (blue line, left axis), CoreLogic (green line, left axis) and National Association of Realtors 3 Month Average (red line, right axis)
/images/z existing3.PNG
The way to understand the dynamics of home prices is to watch the direction of the rate of change. Here almost universally – home price growth is now decelerating.
Year-over-Year Price Change Home Price Indices – Case-Shiller 3 Month Average (blue bar), CoreLogic (yellow bar) and National Association of Realtors 3 Month Average (red bar)
/images/z existing5.PNG
There are some differences between the indices on the rate of “recovery” of home prices. However, the trend for over a year has been an improving home market.
A synopsis of Authors of the Leading Indices:
Case Shiller’s David M. Blitzer, Chairman of the Index Committee at S&P Indices:
The housing recovery may have taken a breather due to the cold weather. Twelve cities reported declining prices in January vs. December; eight of those were worse than the month before. From the bottom in 2012, prices are up 23% and the housing market is showing signs of moving forward with more normal price increases.
The Sun Belt showed the five highest monthly returns. Las Vegas was the leader with an increase of 1.1% followed by Miami at +0.7%. San Diego showed its best January performance of 0.6% since 2004. San Francisco and Tampa trailed closely at +0.5% and +0.4%. Elsewhere, New York and Washington D.C. stood out as they continued to improve and posted their highest year-over-year returns since 2006. Dallas and Denver are the only cities to have reached new record peaks while Detroit remains the only city with home prices below those of 14 years ago.
Expectations and recent data point to continued home price gains for 2014. Although most analysts do not expect the same rapid increases we saw last year, the consensus is for moderating gains. Existing home sales declined slightly in February and are at their lowest level since July 2012.
CoreLogic is also upbeat because of the price growth (January Data). Per Mark Fleming, chief economist for CoreLogic and Anand Nallathambi, president and CEO of CoreLogic:
Polar vortices and a string of snow storms did not manage to weaken house price appreciation in January. The last time January month-over-month and year-over-year price appreciation was this strong was at the height of the housing bubble in 2006.
Excluding distressed sales, all 50 states and the District of Columbia showed year-over-year home price appreciation for January. Nationwide price growth like this should continue as the market comes out of hibernation for the spring buying season.
The National Association of Realtors are blaming everything for the deteriorating home sales data (February 2014 data). Per Lawrence Yun , NAR chief economist:
We had ongoing unusual weather disruptions across much of the country last month, with the continuing frictions of constrained inventory, restrictive mortgage lending standards and housing affordability less favorable than a year ago. Some transactions are simply being delayed, so there should be some improvement in the months ahead. With an expected pickup in job creation, home sales should trend up modestly over the course of the year.
NAR President Steve Brown, co-owner of Irongate, Inc., Realtors® in Dayton, Ohio, said student debt appears to be a factor in the weak level of first-time buyers. “The biggest problems for first-time buyers are tight credit and limited inventory in the lower price ranges,” he said. “However, 20 percent of buyers under the age of 33, the prime group of first-time buyers, delayed their purchase because of outstanding debt. In our recent consumer survey, 56 percent of younger buyers who took longer to save for a downpayment identified student debt as the biggest obstacle.”
Black Knight Financial Services(formerly known as Lender Processing Services) January 2014 home price index up 0.0% for the Month; Up 8.0% Year-over-Year.

Econintersect publishes knowledgeable views of the housing market.
Caveats on the Use of Home Price Indices
The housing price decline seen since 2005 varies by zip code – and seems to have ended somewhere around the beginning of the 2Q2012. Every area of the country has differing characteristics. Since January 2006, the housing declines in Charlotte and Denver are well less than 10%, while Las Vegas home prices had declined almost 60%.
Each home price index uses a different methodology – and this creates slightly different answers. There is some evidence in various home price indices that home prices are beginning to stabilize – the evidence is also in this post. Please see the post Economic Headwinds from Real Estate Moderate.
The most broadly based index is the US Federal Housing Finance Agency’s House Price Index (HPI) – a quarterly broad measure of the movement of single-family house prices. This index is a weighted, repeat-sales index on the same properties in 363 metro centers, compared to the 20 cities Case-Shiller.
The US Federal Housing Finance Agency also has an index (HPIPONM226S) based on 6,000,000 same home sales – a much broader index than Case-Shiller. Also, there is a big difference between home prices and owner’s equity (OEHRENWBSHNO) which has been included on the graph below.
Comparing Various Home Price Indices to Owner’s Equity (blue line)


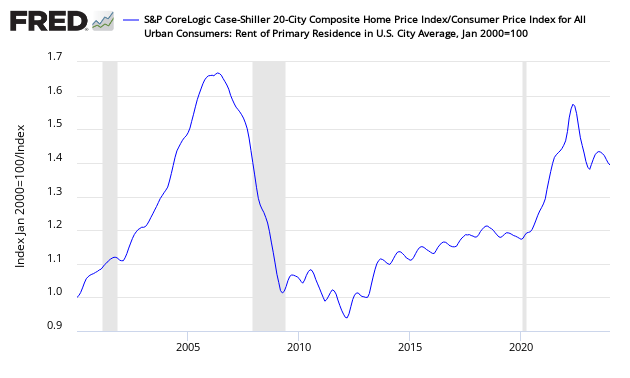
With rents increasing and home prices declining – the affordability factor favoring rental vs owning is reversing. Rising rents are shifting the balance.
Price to Rent Ratio – Indexed on January 2000 – Based on Case-Shiller 20 cities index ratio to CPI Rent Index

Related Articles
Old Analysis Blog | New Analysis Blog |
| Housing Sales and Prices | Housing Sales and Prices |


