by Jill Mislinski, Advisor Perspectives/dshort.com
The University of Michigan Final Consumer Sentiment for March came in at 96.9, up from the February Final reading of 96.3. Investing.com had forecast 97.6.

Surveys of Consumers chief economist, Richard Curtin, makes the following comments:
The continued strength in consumer sentiment has been due to optimistic views on three critical components: higher incomes and wealth, more favorable job prospects, and low inflation expectations. All of these factors, however, have been influenced by partisanship. Democrats expect an imminent recession, higher unemployment, lower income gains, and more rapid inflation, while Republicans anticipate a new era of robust growth in incomes, job prospects, and lower inflation. It is a rare situation that combines increasing optimism, which promotes spending, and rising uncertainty which makes consumers more cautious spenders. The high prevailing level of sentiment reflects the use of changed evaluative criteria. Like economists who have lowered growth prospects, consumers have done the same, and have thus judged lower rates of growth more favorably than they would have in an earlier era. While the partisan divide will likely recede in the months ahead, consumers’ new evaluative standards will resist change. In an earlier era, growth of 3.0% was below average and a cause for concern, now growth above 2.5% represents an optimistic outlook. Overall, the data indicate both rising optimism as well as rising uncertainty due to the partisan divide. The data indicate that real consumer spending will advance by 2.7% in 2017, but those gains will be uneven over time and across products.
See the chart below for a long-term perspective on this widely watched indicator. Recessions and real GDP are included to help us evaluate the correlation between the Michigan Consumer Sentiment Index and the broader economy.
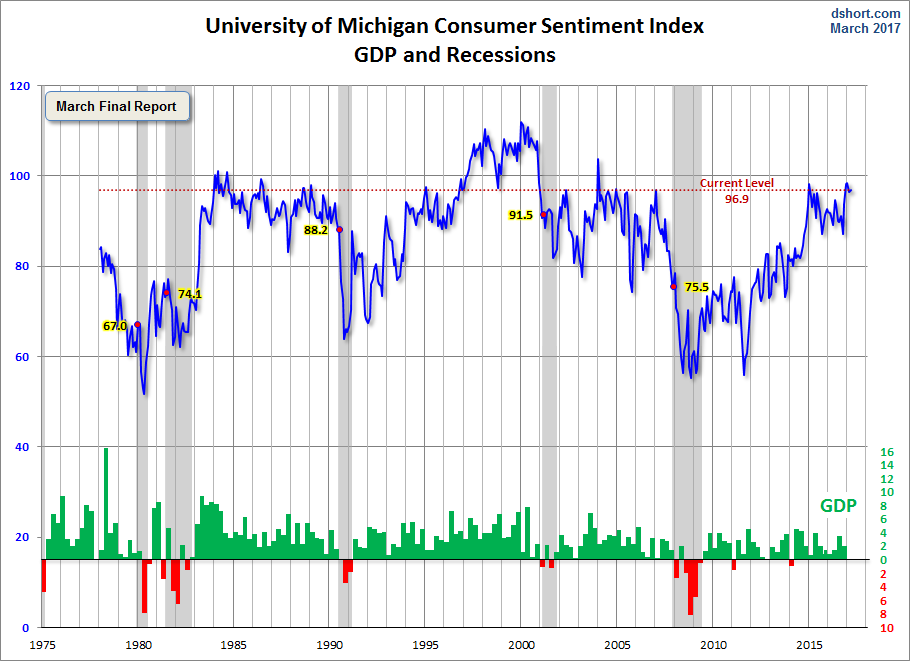
To put today’s report into the larger historical context since its beginning in 1978, consumer sentiment is 13.3 percent above the average reading (arithmetic mean) and 14.6 percent above the geometric mean. The current index level is at the 85th percentile of the 471 monthly data points in this series.
The Michigan average since its inception is 85.6. During non-recessionary years the average is 87.7. The average during the five recessions is 69.3. So the latest sentiment number puts us 27.6 points above the average recession mindset and 9.2 points below the non-recession average.
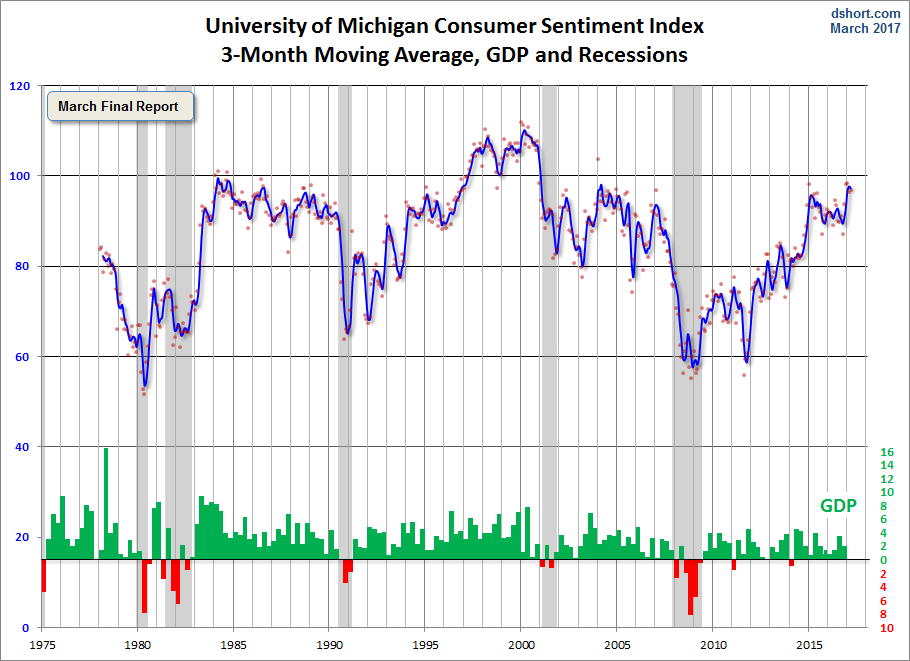
Note that this indicator is somewhat volatile, with a 3.0 point absolute average monthly change. The latest data point saw a 0.6 percent change from the previous month. For a visual sense of the volatility, here is a chart with the monthly data and a three-month moving average.
For the sake of comparison, here is a chart of the Conference Board’s Consumer Confidence Index (monthly update here). The Conference Board Index is the more volatile of the two, but the broad pattern and general trends have been remarkably similar to the Michigan Index.

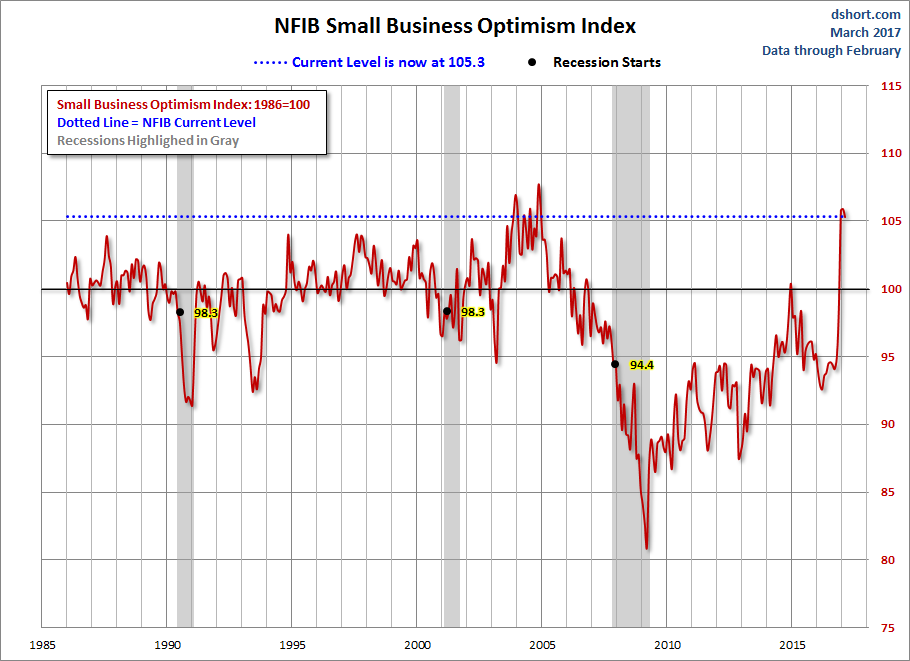
And finally, the prevailing mood of the Michigan survey is also similar to the mood of small business owners, as captured by the NFIB Business Optimism Index (monthly update here).
The general trend in the Michigan Sentiment Index since the Financial Crisis lows has been one of slow improvement.The survey findings since December 2015 saw gradual decline followed by a bounceback later in the year with its interim peak in January of 2017.
Caveats on the Use of University of Michigan Consumer Sentiment
This survey is quantitatively derived from a fairly complex questionnaire (sample here) via a monthly telephone survey. According to Bloomberg:
This release is frequently released early. It can come out as early as 9:55am EST. The official release time is 10:00. Base year 1966=100. A survey of consumer attitudes concerning both the present situation as well as expectations regarding economic conditions conducted by the University of Michigan. For the preliminary release approximately three hundred consumers are surveyed while five hundred are interviewed for the final figure. The level of consumer sentiment is related to the strength of consumer spending. Please note that this report is released twice per month. The first is a preliminary figure while the second is the final (revised) figure.
This is a survey, a quantification of opinion rather than facts and data. The question – does sentiment lead or truly correlate to any economic activity? Since 1990, there seems to be a loose general correlation to real household income growth.

include(“/home/aleta/public_html/files/ad_openx.htm”); ?>


