


Written by Sig Silber
We published the NOAA Long-Term Forecast Part I on October 15, 2020. Here we compare the NOAA forecast for Alaska and CONUS with the JAMSTEC forecast. It is easier to see the disagreements by comparing the maps which we show side by side in a table with a summary of the comparison. Obviously, the further out you look, the less confidence you have in the forecasts and thus the differences in the forecasts. Also provided are the JAMSTEC World Forecasts. In Part I, we showed the differences in the assumptions with respect to ENSO and I have repeated them in this article. We have no way of knowing for sure but it seems like JAMSTEC is showing the Jet Steam to be farther north than NOAA has it. This impacts the forecasts for the Northern Tier of CONUS.

Please share this article – Go to the very top of the page, right-hand side for social media buttons. Please feel free to send this article to anyone who you think might find it interesting and or useful.
C. Comparison of the NOAA and JAMSTEC Forecasts
Below is the comparison of the NOAA and JAMSTEC temperature and precipitation forecast maps for three time-periods and from left to right the NOAA forecast for Alaska and CONUS (the contiguous mid-latitude U.S) and then JAMSTEC for North America (which includes Canada and Mexico). The NOAA forecast maps can be clicked on to enlarge. The JAMSTEC maps in the table are not set up to be clicked on to enlarge (because we have no larger version of them). We have concluded that these smaller images work fine for comparison purposes. Later in the article, we show the World Forecasts.
JAMSTEC works with three-month seasons: Winter: DJF, Spring: MAM, and Summer JJA. Out of each three months, there is one where the months in the two forecasts align perfectly for the first time period. This is not one of those months so for the first period we are comparing DJF for both JAMSTEC and NOAA. It is not ideal but I doubt that it makes a big difference. NDJ is well discussed in our earlier report.
In addition to the value of comparing the JAMSTEC and NOAA forecasts, the JAMSTEC forecast by showing North America provides more context for the Alaska and CONUS Forecasts as the temperature and precipitation patterns cover North America, not just Alaska and CONUS.
Map Comparisons and our Comments
Temperature
| NOAA Alaska Plus CONUS | JAMSTEC North America | |
WINTER DJF 2020-2021 |  |  |
SPRING MAM 2021 |  |  |
Summer JJA 2021 |  | |
Precipitation
| NOAA Alaska Plus CONUS | JAMSTEC North America | |
Winter DJF 2000-2001 |  |  |
SPRING MAM 2021 |  |  |
Summer JJA 2021 |  |  |
JAMSTEC World Forecasts
This month our comments are taken directly from the JAMSTEC discussion. Now that JAMSTEC has a number of models, we are not exactly sure of the best one to display and the forecasts vary somewhat model to model. We are using their newest model and the version which does not average the result with the original model. We assume that the JAMSTEC discussion considers their various models and provides their assessment having considered their full suite of models. The wording in the JAMSTEC discussion is stilted possibly because it is a translation from the Japanese version.
Winter which is DJF 2020-2021
| Temperature |
 |
| Precipitation |
 |
Spring which is MAM 2001
 |
| Precipitation |
 |
And Summer which is JJA 2021
| Temperature |
 |
| Precipitation |
 |
D. Conclusion
As usual, there is a disagreement between NOAA and JAMSTEC. If we were looking at North America as a whole, the disagreement would be less than when we look at only CONUS as some of the features shown by NOAA to be in CONUS are shown by JAMSTEC to be a bit farther north.
It is difficult to relate the differences in the forecast to differences in assumptions on ENSO. But JAMSTEC tends to consider other factors that may not be considered by NOAA. On the other hand, the new versions of the JAMSTEC model are early in their usage and may not have been fully calibrated. I do not think I have gone into it in detail but when it comes to models we need to recognize that there are limitations and NOAA and JAMSTEC use very different approaches which I have summarized in the below table.
| Shorter Term | Intermediate-Term | |
| NOAA | Deterministic | Statistical |
| JAMSTEC | Deterministic | Deterministic (may also use statistical methods) |
| Assessment | Generally Considered to be reliable for 14 to 28 days | Errors build up in deterministic models and statistical models generally have insufficient historical data to be reliable |
So it is kind of a pick your poison choice. But both agencies have great skill at employing approaches that have inherent limitations.
E. Additional Information
JAMSTEC Discussion
We provided the full NOAA Discussion in Part I. The much shorter JAMSTEC Discussion was published on October 15, 2020 and we included it in Part I but we are repeating it here also.
Oct. 15, 2020 Prediction from 1st Oct., 2020 ENSO forecast:
Observation shows that the La Niña continues to develop. The SINTEX-F predicts that this La Niña will be more La Niña Modoki-like and will persist in this year. Then, it will start to decay from early 2021. We need to be careful of its impact as it may be different from that of a canonical La Niña.
Indian Ocean forecast:
Observation shows that the tropical Indian Ocean is warmer-than-normal at present. The ensemble mean prediction suggests that the present condition will return to a neutral state in winter.
Regional forecast:
On a seasonal scale, the SINTEX-F predicts that most part of the globe will experience a warmer-than-normal condition in boreal winter except for northern Brazil, southern Australia Indochina Peninsula, and India. In boreal spring, the model predicts the persistence of a similar condition.
As regards to the seasonally averaged rainfall in boreal winter, a drier-than-normal condition is predicted for U.S.A., Mexico, La Plata Basin, southern Africa, Turkey, and southern China. In contrast, western Canada, Brazil, Australia, Philippines, and Indonesia will experience a wetter-than-normal condition. In boreal spring, a wetter-than-normal condition is predicted for Canada, Brazil, Indochina Peninsula, and Philippines. In contrast, most part of U.S.A., La Plata Basin, some part of East Africa, eastern China, and Indonesia will experience a drier-than-normal condition.
The model predicts most part of Japan will experience warmer-than-normal condition in winter and spring as a seasonal average. As regards to the seasonally averaged rainfall, most part of Japan will experience a drier-than-normal condition in winter. In spring, northern and southern parts of Japan will experience slightly wetter-than-normal conditions.
ENSO Phase
We showed these in Part I but are repeating them here.
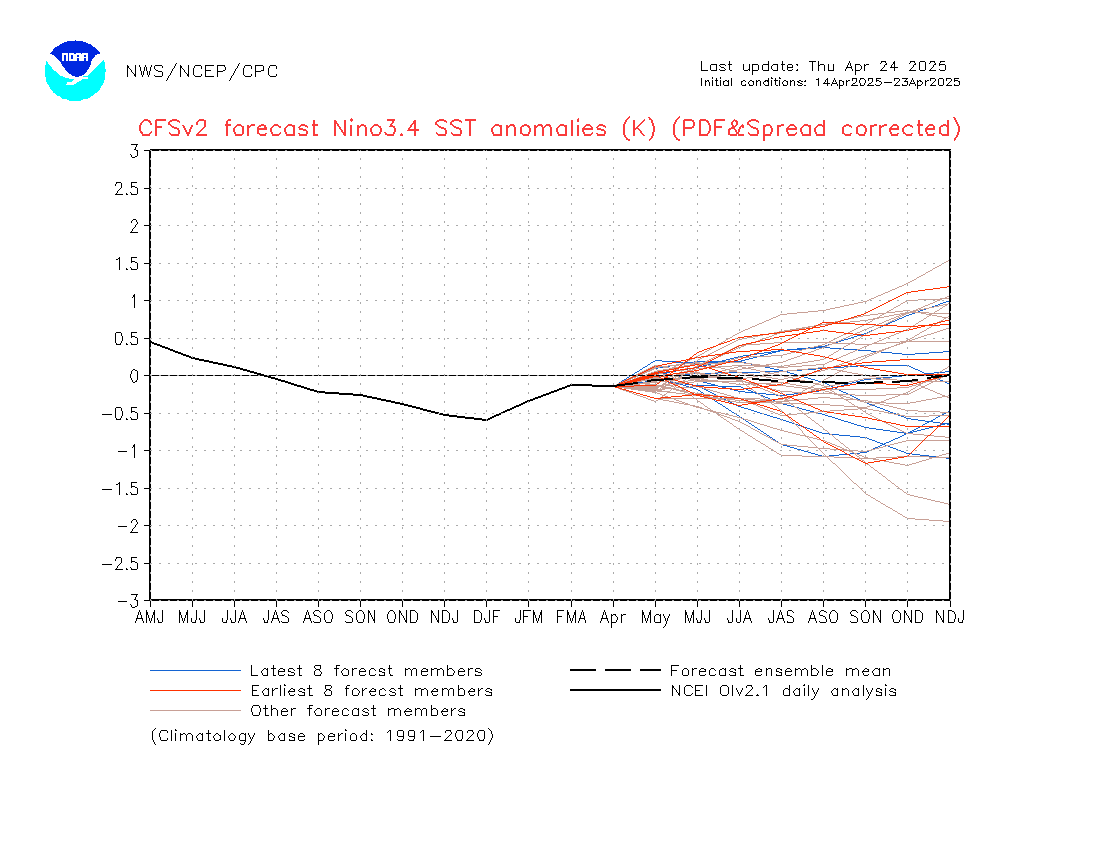
Comparison models would include those used by JAMSTEC and NOAA. But let us first start with NOAA. This first graph is not a forecast of the NINO 3.4 level but the probabilities of that level being in the La Nina range (the blue bar) versus neutral (grey) or El Nino (red). There are also lines which I gather forecast what impact there will be on the climate. Those lines look screwed up to me. I should go back to Part I to verify that NOAA is saying but this graphic is saying that NINO 3.4 will signal La Nina into FMA and it will be 50:50 for MAM which is Spring. But FMA includes 2/3 of Spring and the climate impact lags the change in NINO 3.4 because Nino 3.4 is measured along the Equator in the Pacific so there is a delay for it to impact CONUS weather.
Here is exactly what NOAA said:
Based on the latest observations and model forecasts as of early October, the official CPC/IRI ENSO outlook favors La Nina conditions persisting through the Northern Hemisphere winter into Spring 2021 with La Nina conditions remaining the most likely ENSO phase through FMA 2021.

NOAA has their own proprietary model which they rarely use. It is not exactly clear why they shun their own model.
Then we look at the JAMSTEC model.

But then we look at the JAMSTEC Modoki Index

And the Australian BOM

Here is another graphic which is the current view (the view NOAA had when they issued their forecast on October 15, 2020) of the subsurface along the Equator.
| Last Month | This Month |
 |  |
Now let us look at the SOI which is used to confirm the La Nina. I did not present this graphic in Part I.

From the BOM Glossary
The Southern Oscillation Index, or SOI, gives an indication of the development and intensity of El Niño or La Niña events in the Pacific Ocean. The SOI is calculated using the pressure differences between Tahiti and Darwin.
Sustained negative values of the SOI below −7 often indicate El Niño episodes. These negative values are usually accompanied by sustained warming of the central and eastern tropical Pacific Ocean, a decrease in the strength of the Pacific Trade Winds, and a reduction in winter and spring rainfall over much of eastern Australia and the Top End. You can read more about historical El Niño events and their effect on Australia in the Detailed analysis of past El Niño events.
Sustainted positive values of the SOI above +7 are typical of a La Niña episode. They are associated with stronger Pacific trade winds and warmer sea temperatures to the north of Australia. Waters in the central and eastern tropical Pacific Ocean become cooler during this time. Together these give an increased probability that eastern and northern Australia will be wetter than normal. You can read more about historical La Niña events and their effect on Australia in the Detailed analysis of past La Niña events.
I have not frozen the SOI graphic so we will be able to track the SOI in this article.

La Nina Modoki
There is not a lot of information on this. There appear to be impacts on China and Australia. But how about the U.S.? This is the closest I could find.
This abstract (link for full report) might be informative
Abstract
The present work identifies two types of La Niña based on the spatial distribution of sea surface temperature (SST) anomaly. In contrast to the eastern Pacific (EP) La Niña event, a new type of La Niña (central Pacific, or CP La Niña) is featured by the SST cooling center over the CP. These two types of La Niña exhibit a fundamental difference in SST anomaly evolution: the EP La Niña shows a westward propagation feature while the CP La Niña exhibits a standing feature over the CP. The two types of La Niña can give rise to a significantly different teleconnection around the globe. As a response to the EP La Niña, the North Atlantic (NA)-Western European (WE) region experiences the atmospheric anomaly resembling a negative North Atlantic Oscillation (NAO) pattern accompanied by a weakening Atlantic jet. It leads to a cooler and drier than normal winter over Western Europe. However, the CP La Niña has a roughly opposing impact on the NA-WE climate. A positive NAO-like climate anomaly is observed with a strengthening Atlantic jet, and there appears a warmer and wetter than normal winter over Western Europe. Modeling experiments indicate that the above contrasting atmospheric anomalies are mainly attributed to the different SST cooling patterns for the two types of La Niña. Mixing up their signals would lead to difficulty in seasonal prediction of regional climate. Since the La Niña-related SST anomaly is clearly observed during the developing autumn, the associated winter climate anomalies over Western Europe could be predicted a season in advance.
The key sentence from the above is: “And there appears a warmer and wetter than normal winter over Western Europe.” Is this reflected in the JAMSTEC maps? Quite frankly I was not able to tell. It was not clear cut one way or the other.


