Written by Steven Hansen
The U.S. new cases 7-day rolling average is 8.8 % HIGHER than the 7-day rolling average one week ago. U.S. deaths due to coronavirus are now 1.4 % LOWER than the rolling average one week ago. At the end of this post is a set of interactive graphs and tables for the world and individual States – as well as today’s headlines which include;
- New coronavirus cases this week worsened in the U.S. – and even more globally.
- Coronavirus deaths this week modestly improved in the U.S. and globally.
- Coronavirus infection fatality rate this week modestly improved in the U.S. and globally.
- This Overlooked Variable Is the Key to the Pandemic
- European leaders face off against regions as a second wave engulfs continent
- How the Sturgis Motorcycle Rally may have spread coronavirus across the Upper Midwest
- As the Coronavirus Surges, a New Culprit Emerges: Pandemic Fatigue
- Frozen food package polluted by living coronavirus could cause infection, China’s CDC says

The recent worsening of the trendlines for new cases should be attributed to going back to college/university, cooler weather causing more indoor activities, and continued loosening of regulations designed to slow the coronavirus spread.
My continuing advice is to continue to wash your hands, wear masks, and maintain social distancing. No handwashing, mask, or social distancing will guarantee you do not get infected – but it sure as hell lowers the risk in all situations – and evidence to-date shows a lower severity of COVID-19. In addition, certain activities are believed to carry a higher risk – like being inside in air conditioning and removing your mask (such as restaurants, around your children/grandchildren, bars, and gyms). It is all about viral load – and outdoor activities are generally very safe.
The daily number of new cases in the U.S. is remaining stubbornly and embarrassedly high.
The following graphs show the 7-day rolling average for new coronavirus cases and deaths have been updated through 18 October 2020:


z coronavirus.png
Coronavirus Statistics For 18 October 2020 |
| U.S. Only | Global | U.S Percentage of Total | ||||
| Today*** | Cumulative | Today*** | Cumulative | Today | Cumulative | |
| New Confirmed Cases | 55,400 | 8,110,000 | 349,667 | 39,770,000 | 15.8% | 20.4% |
| Deaths** | 690 | 219,289 | 5,519 | 1,110,000 | 15.5% | 19.8% |
| Mortality Rate | 1.2% | 2.7% | 1.6% | 2.8% | ||
total COVID-19 Tests per 1,000 people | 1.05* | 392.45* | ||||
Source: EU CDC – The data insignificantly varies from the data produced by Johns Hopkins
* as of 13 Oct 2020
** evidently several States included “probable” deaths today in the number
*** red color indicates record number
This Past Week In Review
A brief summary of the news was that the U.S. and the world is into a second (or third wave) wave of coronavirus infections. The good news is that deaths have not increased even though the surge in infections began at the beginning of September. It could be that the coronavirus is less deadly combined with better treatment of those infected.
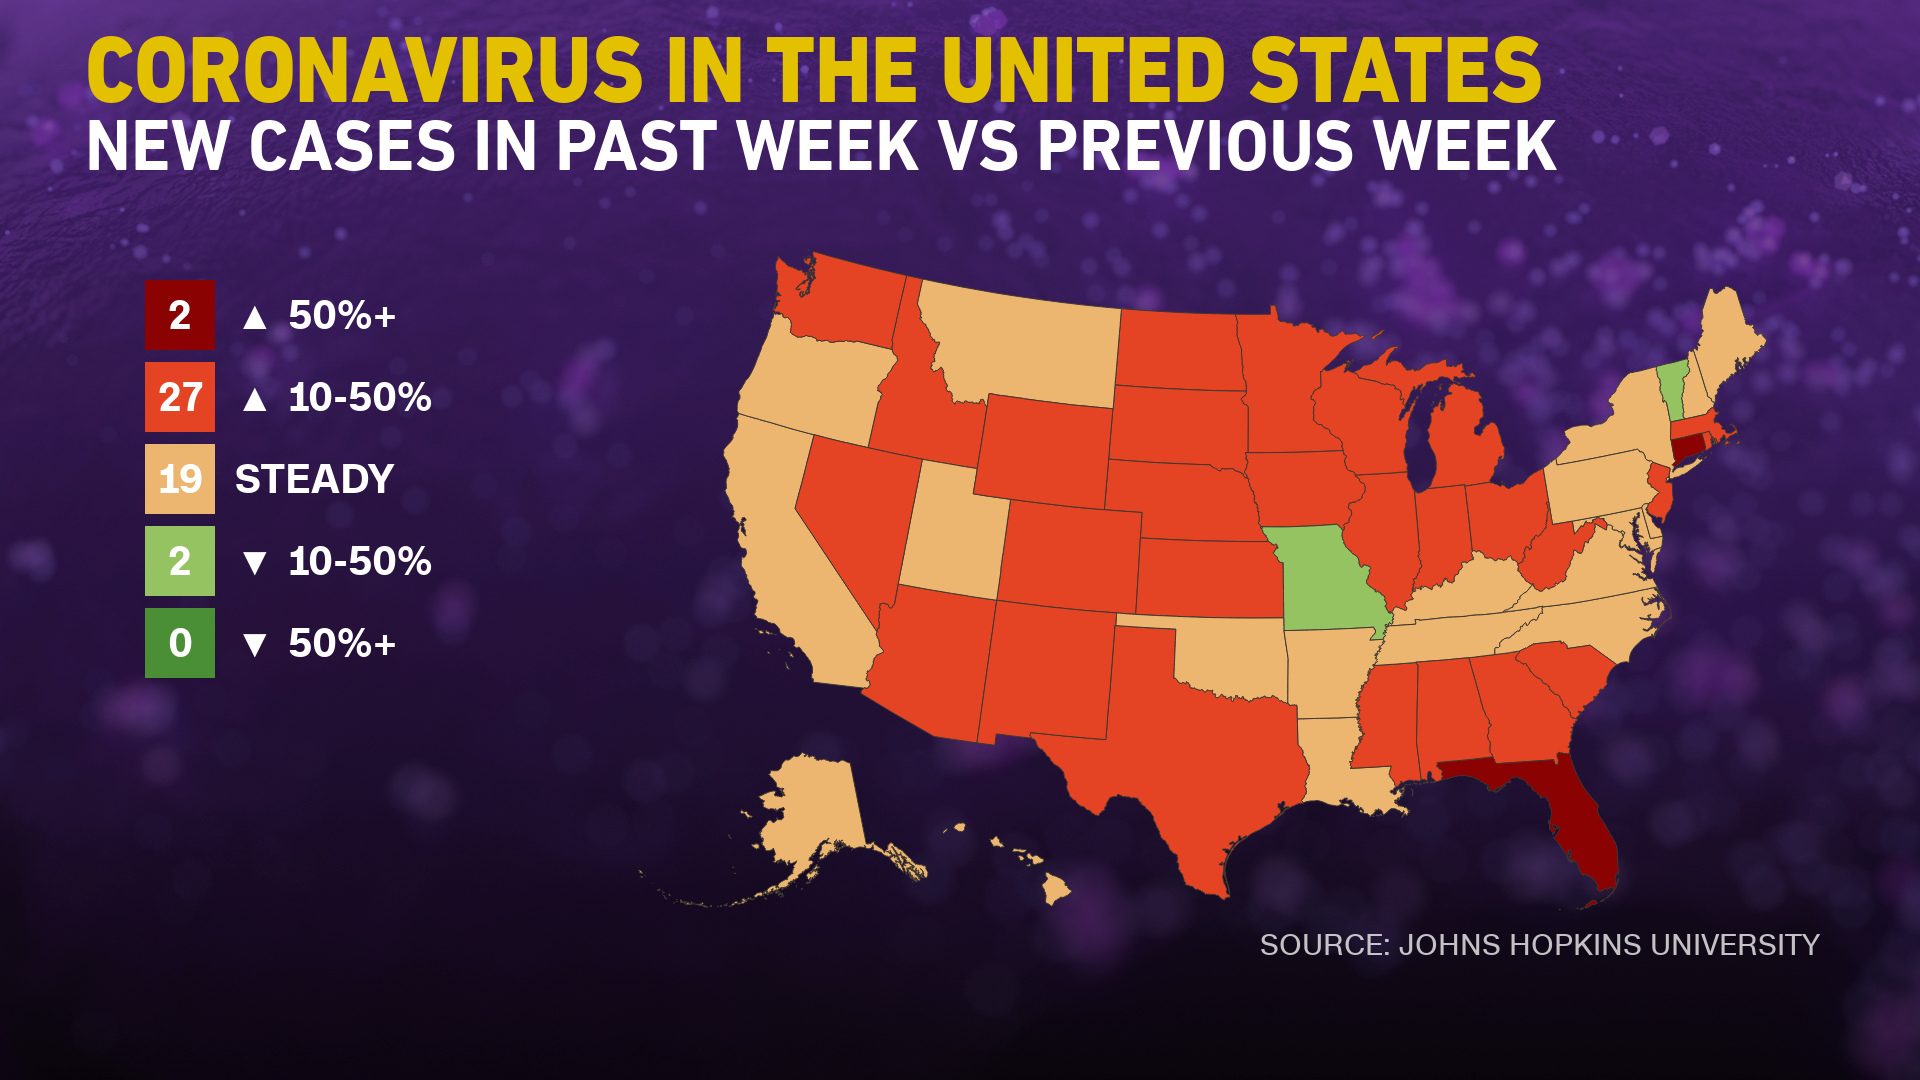
New coronavirus cases worsened in the U.S. – and even more globally.

Here’s a state-by-state look at coronavirus cases across the US:
Coronavirus deaths modestly improved in the U.S. and globally.

Coronavirus infection fatality rate modestly improved in the U.S. and globally.

Econintersect also published today two summary posts for the news in this past week:
The Death Count Attributable To Coronavirus Is Logical and Correct
I have been asked several times if the number of deaths attributed to coronavirus is correct. We all read the news, and there are anecdotal instances of hospitals claiming a death was due to coronavirus to rake in more monies.
Honestly, I can understand the skepticism of the death counts as we can see the politicization of the pandemic – and the biased reporting of mass media. It is hard to believe much anymore as journalism has returned to the yellow journalism of the 1890s. The “news” we read today is exaggerated, biased, politicized, interwoven with opinion, fact cherry-picked, and sensationalized. I can think of no U.S. news source which is not “yellow” – the difference between news sources is only in degrees and the bias they are projecting.
I have from time-to-time validated that the Johns Hopkins [and also the EU CDC] death counts are correct. The CDC has a page dedicated to Excess Deaths Associated with COVID-19. The number of excess deaths is defined as follows;
Number of excess deaths: A range of estimates for the number of excess deaths was calculated as the difference between the observed count and one of two thresholds (either the average expected count or the upper bound threshold), by week and jurisdiction. Negative values, where the observed count fell below the threshold, were set to zero.
The following CDC interactive graph illustrates the excess deaths.
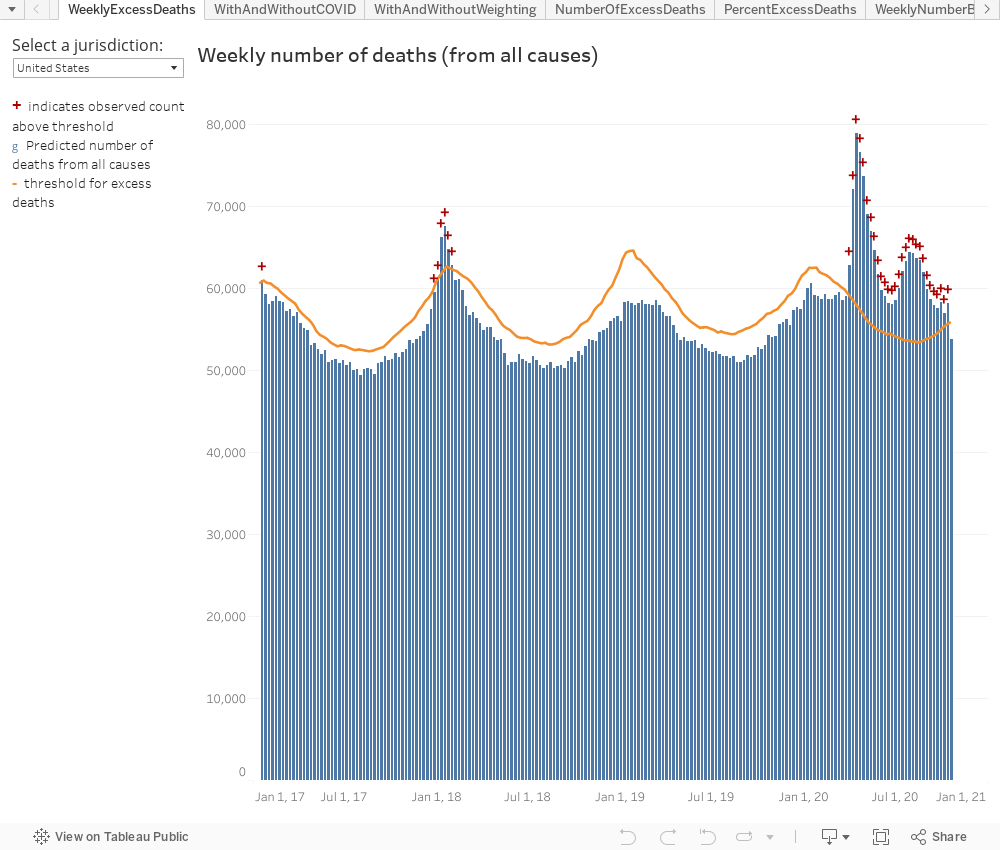
For me, it is easier to put things into context when I can graphically display the data. Still not convinced the CDC is playing with the data?
We can go U.S. Census to obtain death counts from all causes.
Year | Total Deaths |
| 2017 | 2,813,503 |
| 2018 | 2,839,205 |
| 2019 | 2,852,609 |
Notice that the rise in deaths every year since 2017 range from 10,000 to about 25,000. So in 2020, any excess deaths over 25,000 from the 2019 numbers are likely due to coronavirus.
Year | Total Deaths |
| 2019 | 2,181,412 |
| 2020 | 2,427,881 |
| excess deaths | 246,496 |
| death growth adjustment due to population growth | 25,000 |
| adjusted excess deaths | 221,469 |
| Current EU CDC deaths attributed to Covid | 219,289 |
The death numbers correlate comparing calculated excess deaths and the headline deaths attributable to coronavirus. The death-counts-to-date headlined by the CDC, Johns Hopkins, and the EU CDC are reasonable and representative in showing the impact of the pandemic.
Coronavirus News You May Have Missed
This Overlooked Variable Is the Key to the Pandemic – The Atlantic
Why, in the spring of 2020, did so few cities account for a substantial portion of global deaths, while many others with similar density, weather, age distribution, and travel patterns were spared? What can we really learn from Sweden, hailed as a great success by some because of its low case counts and deaths as the rest of Europe experiences a second wave, and as a big failure by others because it did not lock down and suffered excessive death rates earlier in the pandemic? Why did widespread predictions of catastrophe in Japan not bear out? The baffling examples go on.
… By now many people have heard about R0—the basic reproductive number of a pathogen, a measure of its contagiousness on average. But unless you’ve been reading scientific journals, you’re less likely to have encountered k, the measure of its dispersion. The definition of k is a mouthful, but it’s simply a way of asking whether a virus spreads in a steady manner or in big bursts, whereby one person infects many, all at once. After nine months of collecting epidemiological data, we know that this is an overdispersed pathogen, meaning that it tends to spread in clusters, but this knowledge has not yet fully entered our way of thinking about the pandemic—or our preventive practices.
… Unfortunately, averages aren’t always useful for understanding the distribution of a phenomenon, especially if it has widely varying behavior. If Amazon’s CEO, Jeff Bezos, walks into a bar with 100 regular people in it, the average wealth in that bar suddenly exceeds $1 billion. If I also walk into that bar, not much will change. Clearly, the average is not that useful a number to understand the distribution of wealth in that bar, or how to change it. Sometimes, the mean is not the message. Meanwhile, if the bar has a person infected with COVID-19, and if it is also poorly ventilated and loud, causing people to speak loudly at close range, almost everyone in the room could potentially be infected—a pattern that’s been observed many times since the pandemic begin, and that is similarly not captured by R. That’s where the dispersion comes in.
… Using genomic analysis, researchers in New Zealand looked at more than half the confirmed cases in the country and found a staggering 277 separate introductions in the early months, but also that only 19 percent of introductions led to more than one additional case. A recent review shows that this may even be true in congregate living spaces, such as nursing homes, and that multiple introductions may be necessary before an outbreak takes off. Meanwhile, in Daegu, South Korea, just one woman, dubbed Patient 31, generated more than 5,000 known cases in a megachurch cluster.
… Could we get back to a much more normal life by focusing on limiting the conditions for super-spreading events, aggressively engaging in cluster-busting, and deploying cheap, rapid mass tests—that is, once we get our case numbers down to low enough numbers to carry out such a strategy? (Many places with low community transmission could start immediately.) Once we look for and see the forest, it becomes easier to find our way out.
[editor’s note: this post deserves a full read]
European leaders face off against regions as a second wave engulfs continent – CNN
As coronavirus cases spike across the continent, European governments are facing a new obstacle in their efforts to enforce restrictions — with several major cities and regions fighting back against instructions to lock down in recent days.
Cities in the UK, France, Spain are resisting centralized efforts to impose tighter regulations, with days of tense negotiations ongoing as infections increase.
In the northern English city of Manchester, UK Prime Minister Boris Johnson has become engulfed in a row with local mayor Andy Burnham over whether to move the city from the UK’s second tier of restrictions to its most severe third tier.
… And in Germany, a slew of court orders are causing trouble for Angela Merkel’s government as she attempts to battle a rising load of cases.
Most prominently, a Berlin court sided against the government and with a group of business owners on Friday, suspending late-night curfews on bars and restaurants in the city.
How the Sturgis Motorcycle Rally may have spread coronavirus across the Upper Midwest – Washington Post
Within weeks of the gathering that drew nearly half a million bikers, the Dakotas, along with Wyoming, Minnesota and Montana, were leading the nation in new coronavirus infections per capita.
Within weeks of the gathering, the Dakotas, along with Wyoming, Minnesota and Montana, were leading the nation in new coronavirus infections per capita. The surge was especially pronounced in North and South Dakota, where cases and hospitalization rates continued their juggernaut rise into October. Experts say they will never be able to determine how many of those cases originated at the 10-day rally, given the failure of state and local health officials to identify and monitor attendees returning home, or to trace chains of transmission after people got sick. Some, however, believe the nearly 500,000-person gathering played a role in the outbreak now consuming the Upper Midwest.
More than 330 coronavirus cases and one death were directly linked to the rally as of mid-September, according to a Washington Post survey of health departments in 23 states that provided information. But experts say that tally represents just the tip of the iceberg, since contact tracing often doesn’t capture the source of an infection, and asymptomatic spread goes unnoticed.
In many ways, Sturgis is an object lesson in the patchwork U.S. response to a virus that has proved remarkably adept at exploiting such gaps to become resurgent. While some states and localities banned even relatively small groups of people, others, like South Dakota, imposed no restrictions — in this case allowing the largest gathering of people in the United States and perhaps anywhere in the world amid the pandemic and creating huge vulnerabilities as tens of thousands of attendees traveled back home to every state in the nation.
Many went unmasked to an event public health officials pleaded with them to skip, putting themselves and others at risk, because they were skeptical about the risks, or felt the entreaties infringed on their personal liberties. Rallygoers jammed bars, restaurants, tattoo parlors and concert venues; South Dakota officials later identified four such businesses as sites of potential exposure after learning that infected people had visited them.
[editor’s note: this post deserves a full read – please remember that this post connects only the dots to support their headline position, much of their “facts” are anecdotal or circumstantial, and there can be other explanations. There is NO question in my mind that large gathering – even outdoor ones – should be curtailed until more confirmed facts about the way the coronavirus spreads.]
As the Coronavirus Surges, a New Culprit Emerges: Pandemic Fatigue – New York Times
The virus has taken different paths through these countries as leaders have tried to tamp down the spread with a range of restrictions. Shared, though, is a public weariness and a growing tendency to risk the dangers of the coronavirus, out of desire or necessity: With no end in sight, many people are flocking to bars, family parties, bowling alleys and sporting events much as they did before the virus hit, and others must return to school or work as communities seek to resuscitate economies. And in sharp contrast to the spring, the rituals of hope and unity that helped people endure the first surge of the virus have given way to exhaustion and frustration.
“People are done putting hearts on their windows and teddy bears out for scavenger hunts,” said Katie Rosenberg, the mayor of Wausau, Wis., a city of 38,000 where a hospital has opened an extra unit to treat Covid-19 patients. “They have had enough.”
… In parts of the world where the virus is resurging, the outbreaks and a rising sense of apathy are colliding, making for a dangerous combination. Health officials say the growing impatience is a new challenge as they try to slow the latest outbreaks, and it threatens to exacerbate what they fear is turning into a devastating autumn
… In some parts of the world, behavior has changed and containment efforts have been tough and effective. Infections have stayed relatively low for months in places like South Korea, Japan, New Zealand, Australia and China, where the virus first spread. After a dozen cases were detected in the Chinese city of Qingdao, the authorities sought this past week to test all of its 9.5 million residents.
“We have very little backlash here against these types of measures,” said Siddharth Sridhar, an assistant professor of microbiology at the University of Hong Kong. “If anything, there’s a lot of pushback against governments for not doing enough to contain the virus.”
The response in the United States and much of Europe has been far different. While residents willingly banded together in the spring, time has given rise to frustration and revolt.
Frozen food package polluted by living coronavirus could cause infection, China’s CDC says – Yahoo
China’s disease control authority said on Saturday that contact with frozen food packaging contaminated by living new coronavirus could cause infection.
The conclusion came as the Chinese Center for Disease Control and Prevention (CDC) detected and isolated living coronavirus on the outer packaging of frozen cod during efforts to trace the virus in an outbreak reported last week in the city of Qingdao, the agency said on its website.
The finding, a world first, suggests it is possible for the virus to be conveyed over long distances via frozen goods, it said.
Two dock workers in Qingdao who were initially diagnosed as asymptomatic infections in September brought the virus to a chest hospital during quarantine due to insufficient disinfection and protection, leading to another 12 infections linked to the hospital, authorities said last week.
However, the CDC’s latest statement does not show solid proof that the two workers in Qingdao caught the virus from the packaging directly, rather than contracting the virus from somewhere else and then contaminating the food packaging they handled, said Jin Dong-Yan, a virology professor at the University of Hong Kong.
The CDC said no instance had been found of any consumer contracting the virus by having contact with frozen food and the risk of this happening remained very low.
The following are foreign headlines with hyperlinks to the posts
Slovakia’s PM demands mass testing of entire population for Covid-19
Coronavirus: Empty streets in France as curfew enforced
Senior Palestinian Official Saeb Erekat Transferred to Israeli Hospital for Treatment
The following are additional national and state headlines with hyperlinks to the posts
Appalachian Town Must ‘Wait And Wait’ As Pandemic Puts Plastics Plant On Hold
NY wedding with 10,000 attendees shut down amid COVID-19
Twitter Removes WH Adviser’s Tweet Saying Masks Don’t Prevent COVID-19
Georgia, on Cusp of COVID Surge, Grapples With Long Voting Lines, Delays
Wisc. Official Who Fought Mask Mandate Gets COVID Ahead of Trump Rally
Women’s Marches Spark Accusations of COVID Hypocrisy From All Directions
NEW MEXICO SEES 101% SURGE IN HOSPITALIZATIONS
A frozen yogurt shop in Colorado offered maskless customers a 10 percent discount. Uproar ensued.
Coronavirus outbreak detected at Waldo County [Maine] church
Today’s Posts On Econintersect Showing Impact Of The Pandemic With Hyperlinks
A Bridge To Economic Recovery: Be Aware Of Financial Stability Risks
Two Quite Different Paths For U.S. Unemployment
How Financially Fit Are American Retirees?
Coronavirus Disease Weekly News 17October 2020
Coronavirus Economic Weekly News 17October 2020
Warning to Readers
The amount of politically biased articles on the internet continues to increase. And studies and opinions of the experts continue to contradict other studies and expert opinions. Honestly, it is difficult to believe anything anymore. A study usually cannot establish cause and effect – but only correlation. Be very careful what you believe about this pandemic.

I assemble this coronavirus update daily – sifting through the posts on the internet. I try to avoid politically slanted posts (mostly from CNN, New York Times, and the Washington Post) and can usually find unslanted posts on that subject from other sources on the internet. I wait to publish posts on subjects that I cannot validate across several sources. But after all this extra work, I do not know if I have conveyed the REAL facts. It is my job to provide information so that you have the facts necessary – and then it is up to readers to draw conclusions.
Coronavirus INTERACTIVE Charts
include($_SERVER[‘DOCUMENT_ROOT’].’/pages/coronavirus.htm’); ?>
Analyst Opinion of Coronavirus Data
There are several takeaways that need to be understood when viewing coronavirus statistical data:
- The global counts are suspect for a variety of reasons including political. Even the U.S. count has issues as it is possible that as much as half the population has had coronavirus and was asymptomatic. It would be a far better metric using a random sampling of the population weekly. In short, we do not understand the size of the error in the tracking numbers.
- Just because some of the methodology used in aggregating the data in the U.S. is flawed – as long as the flaw is uniformly applied – you establish a baseline. This is why it is dangerous to compare two countries as they likely use different methodologies to determine who has (and who died) from coronavirus.
- COVID-19 and the flu are different but can have similar symptoms. For sure, COVID-19 so far is much more deadly than the flu. [click here to compare symptoms]
- From an industrial engineering point of view, one can argue that it is best to flatten the curve only to the point that the health care system is barely able to cope. This solution only works if-and-only-if one can catch this coronavirus once and develops immunity. In the case of COVID-19, herd immunity may need to be in the 80% to 85% range. WHO warns that few have developed antibodies to COVID-19. At this point, herd immunity does not look like an option although there is now a discussion of whether T-Cells play a part in immunity [which means one might have immunity without antibodies]
- Older population countries will have a higher death rate.
- There are at least 8 strains of the coronavirus. New York may have a deadlier strain imported from Europe, compared to less deadly viruses elsewhere in the United States.
- Each publication uses different cutoff times for its coronavirus statistics. Our data uses 11:00 am London time. Also, there is an unexplained variation in the total numbers both globally and in the U.S.
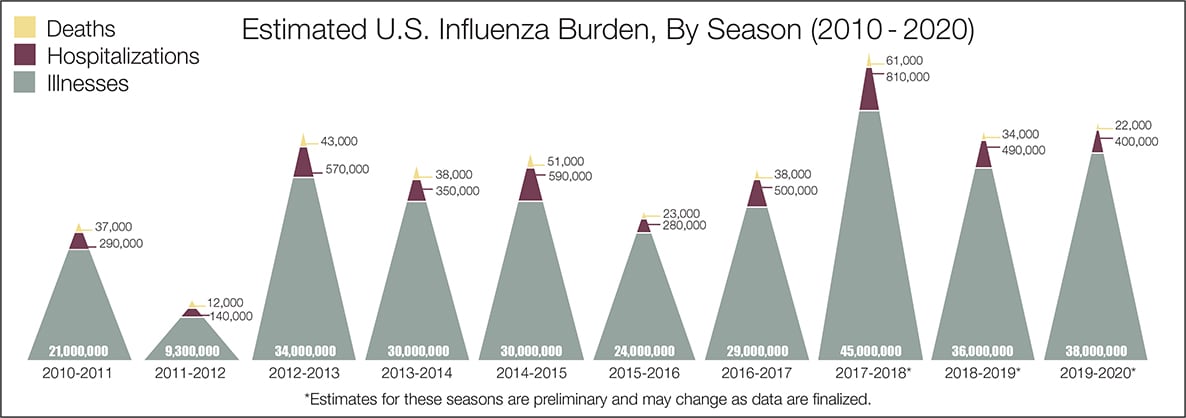
- The real question remains if the U.S. is over-reacting to this virus. The following graphic from the CDC puts the annual flu burden in perspective [click on image to enlarge]. Note that using this data is dangerous as the actual flu cases are estimated and not counted – nobody knows how accurate these guesses are.
What we do not know about the coronavirus [actually there is little scientifically proven information]. Most of our knowledge is anecdotal, from studies with limited subjects, or from studies without peer review.
- How many people have been infected as many do not show symptoms?
- Masks do work.
- Do we develop lasting immunity to the coronavirus? Another coronavirus – the simple cold – does not develop long term immunity.
- To what degree do people who never develop symptoms contribute to transmission?
- The US has scaled up coronavirus testing – and the accuracy of the tests has been improving. However, if one loses immunity – the coronavirus testing value is reduced.
- Can children widely spread coronavirus? [current thinking is that they are becoming a major source of the pandemic spread]
- Why have some places avoided big coronavirus outbreaks – and others hit hard?
- What effect will the weather have? At this point, it does not seem hot weather slows this coronavirus down – and it seems air conditioning contributes to its spread.
- Outdoor activities seem to be a lower risk than indoor activities.
- Can the world really push out an effective vaccine in 12 to 18 months?
- Will other medical treatments for Covid-19 ease symptoms and reduce deaths? So far only one drug (remdesivir) is approved for treatment.
- A current scientific understanding of the way the coronavirus works can be found [here].
Heavy breakouts of coronavirus have hit farm workers. Farmworkers are essential to the food supply. They cannot shelter at home. Consider:
- they have high rates of the respiratory disease [occupational hazard]
- they travel on crowded buses chartered by their employers
- few have health insurance
- they cannot social distance and live two to four to a room – and they eat together
- some reports say half are undocumented
- they are low paid and cannot afford not to work – so they will go to work sick
- they do not have access to sanitation when working
- a coronavirus outbreak among farmworkers can potentially shutter entire farm
The bottom line is that COVID-19 so far has been shown to be much more deadly than the data on the flu. Using CDC data, the flu has a mortality rate between 0.06 % and 0.11 % Vs. the coronavirus which to date has a mortality rate of 4 % [the 4% is the average of overall statistics – however in the last few months it has been hovering around 1.0%] – which makes it between 10 and 80 times more deadly. The reason for ranges:
Because influenza surveillance does not capture all cases of flu that occur in the U.S., CDC provides these estimated ranges to better reflect the larger burden of influenza.
There will be a commission set up after this pandemic ends to find fault [it is easy to find fault when a once-in-a-lifetime event occurs] and to produce recommendations for the next time a pandemic happens. Those that hate President Trump will conclude the virus is his fault.
Resources:
- Get the latest public health information from CDC: https://www.coronavirus.gov .
- Get the latest research from NIH: https://www.nih.gov/coronavirus.
- Find NCBI SARS-CoV-2 literature, sequence, and clinical content: https://www.ncbi.nlm.nih.gov/sars-cov-2/.
- List of studies: https://icite.od.nih.gov/covid19/search/#search:searchId=5ee124ed70bb967c49672dad
include(“/home/aleta/public_html/files/ad_openx.htm”); ?>


