
Written by Sig Silber
New areas this week include some interesting data on wages in the agriculture sector. Also, we have the latest information on the soil moisture situation (covered every two weeks). All of this and much more is in this week’s report. This includes, of course, the weekly United States Drought Monitor which is showing a very low level of drought. Since we published on a Friday, the article includes a 28-day weather forecast. Tomorrow we report on NOAA’s update of their December forecast. How will it compare to the Early Outlook for December? Tomorrow we will all find out.

Please share this article – Go to the very top of the page, right-hand side, for social media buttons. Please feel free to send this article to anyone who you think might benefit from reading it.
Directory
Readers can scan through this article or jump to where they want to go via the links to the right. Directory links are under construction. Check back for completion. |
|
Focus on the Dakotas.


Was drought an issue? We are going to look at six-month change maps.
North Dakota

South Dakota

Can the Dakotas recover?
Some think so. Listen to this interview by Troy Knecht a South Dakota farmer which I found in this article. Our farmers and the folks processing farm products are very innovative and determined. But I certainly would not want to eat any of that corn but it is not meant for the table but as ethanol or animal consumption.
Soil Moisture Analysis
 |
 |
 |
 |
Wages in Agriculture from NASS Executive Briefings

Wages by Region

Wages by job category

And shifting to the Alaska and CONUS Intermediate-Term Weather Forecast
First Temperature
 |
|
|
|


And then Precipitation
|
|
|


Here is the discussion that was released with the Week 3 – 4 forecast today.
Week 3-4 Forecast Discussion Valid Sat Dec 14 2019-Fri Dec 27 2019
ENSO-neutral conditions continue across the Equatorial Pacific, with a robust Pacific Rossby wave and the ongoing strong positive phase of the Indian Ocean Dipole (IOD) dominating the global tropical convective field. Dynamical model MJO index forecasts suggest the potential for renewed MJO activity, with the enhanced phase crossing the Indian Ocean during Week-2. Lagged midlatitude teleconnections to an Indian Ocean MJO event favor a continuation of the positive AO/NAO height anomaly structure currently seen in the Week-2 guidance. Dynamical and statistical model guidance is broadly consistent with this pattern during the upcoming Week 3-4 period.
Dynamical model 500-hPa height anomaly forecasts from the CFS, ECMWF, and JMA are generally consistent with above-normal heights across the midlatitudes consistent with a positive AO structure and troughing over the North Atlantic and/or Greenland consistent with a positive NAO structure. The ECMWF has the weakest anomaly field, while the JMA maintains the strongest anomalies, with considerable anomalous ridging over the Eastern U.S. While there are differences in the placement of the ridges and troughs among the tools that impact their respective forecasts, the takeaway is that none of the guidance supports widespread arctic airmass intrusions into the U.S., and a progressive pattern is more likely than persistent blocks.
The overall temperature outlook is based on a consensus of the dynamical and statistical tools. Most guidance indicates the highest probabilities for above-average temperatures exist over the northern Mississippi Valley, extending southwest across the central U.S. The CPC Autoblend outlook also shows enhanced chances for above-average temperatures across New England and the mid-Atlantic, but there is considerable uncertainty in the guidance, with the SubX multi-model ensemble showing enhanced chances for below-average temperatures. Given the anticipated progressive pattern with brief cold outbreaks followed by warm air advection regimes, equal chances for below- and above-average temperatures are maintained across New England. The only location where below-average temperatures are favored is across the Great Basin, where above-average snowpack conditions may help keep temperatures lower than average in the absence of favored ridging. The temperature outlook across Alaska is similar to the previous week, with above-average temperatures favored across the western and northern areas due to above-normal sea surface temperatures, but an absence of a clear signal across the remainder of the state.
There is considerable uncertainty in the precipitation outlook. While the autoblend shows near to below-median precipitation across the West, largely due to contributions from long term trends in the MLR statistical tool, guidance from the CFS and ECMWF depicts enhanced chances for above-median precipitation across the Southwest, and below-median precipitation across the Northwest. The JMA flips this pattern, while the SubX multi-model ensemble favors a middle ground, with enhanced precipitation across northern California and the Great Basin. For this outlook, the CFS and ECMWF solutions are favored, and above- (below-) median precipitation chances are favored across the Southwest (Northwest and Alaska Panhandle). Additionally, dynamical models, particularly the ECMWF, suggest a mean storm track across the central U.S. into the western Great Lakes region. There is no clear signal favoring above- or below-median precipitation across Alaska or the Eastern CONUS.
Similar to previous weeks, persistent above-normal surrounding SST anomalies indicate that above-normal temperatures are likely for Hawaii with probabilities near 90 percent. Above median precipitation continue to be favored for the Hawaiian Islands by the ECMWF and SubX MME, with probabilities increasing towards the northwest.


Current Drought Conditions
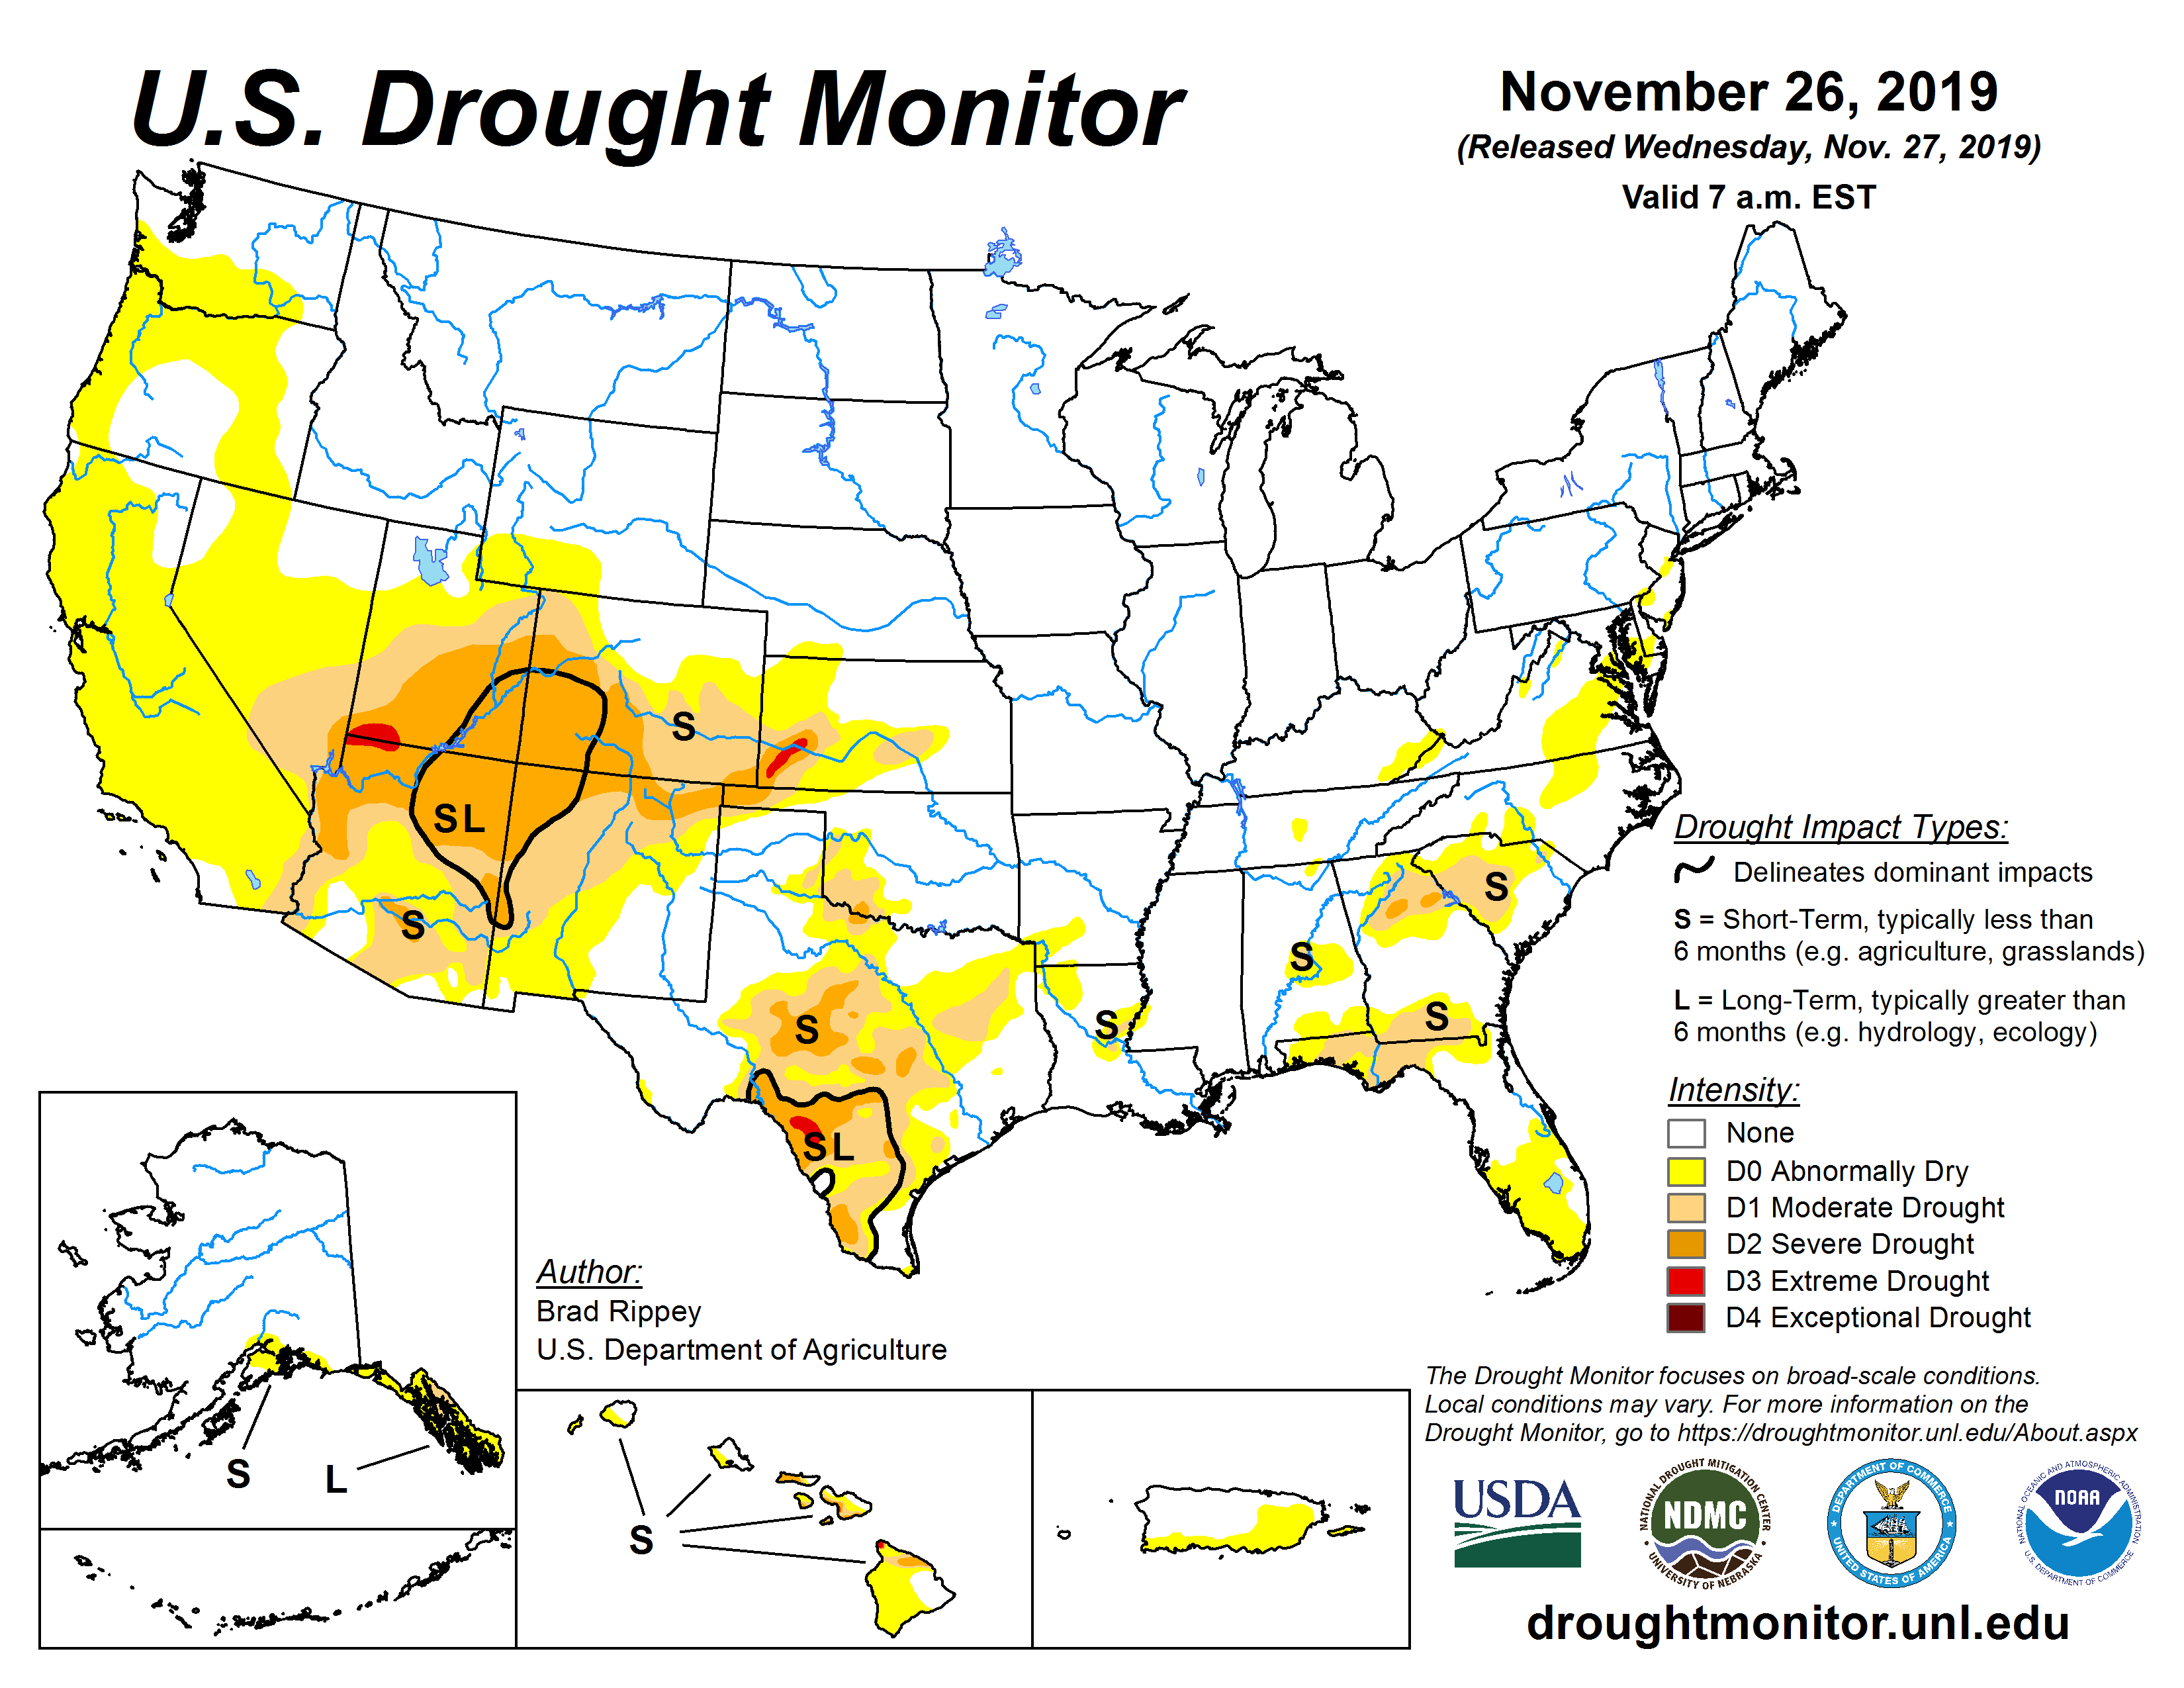
Now we take a look at Thursday’s U.S. Drought Monitor Report.
The U.S. Drought Monitor is a comprehensive way of understanding the drought situation for the U.S. It is issued every Thursday and reflects the conditions as of the prior Tuesday. Drought is defined as a moisture deficit bad enough to have social, environmental or economic effects. Thus, more factors than recent precipitation are considered and more information on how it is done is found at the end of this report.
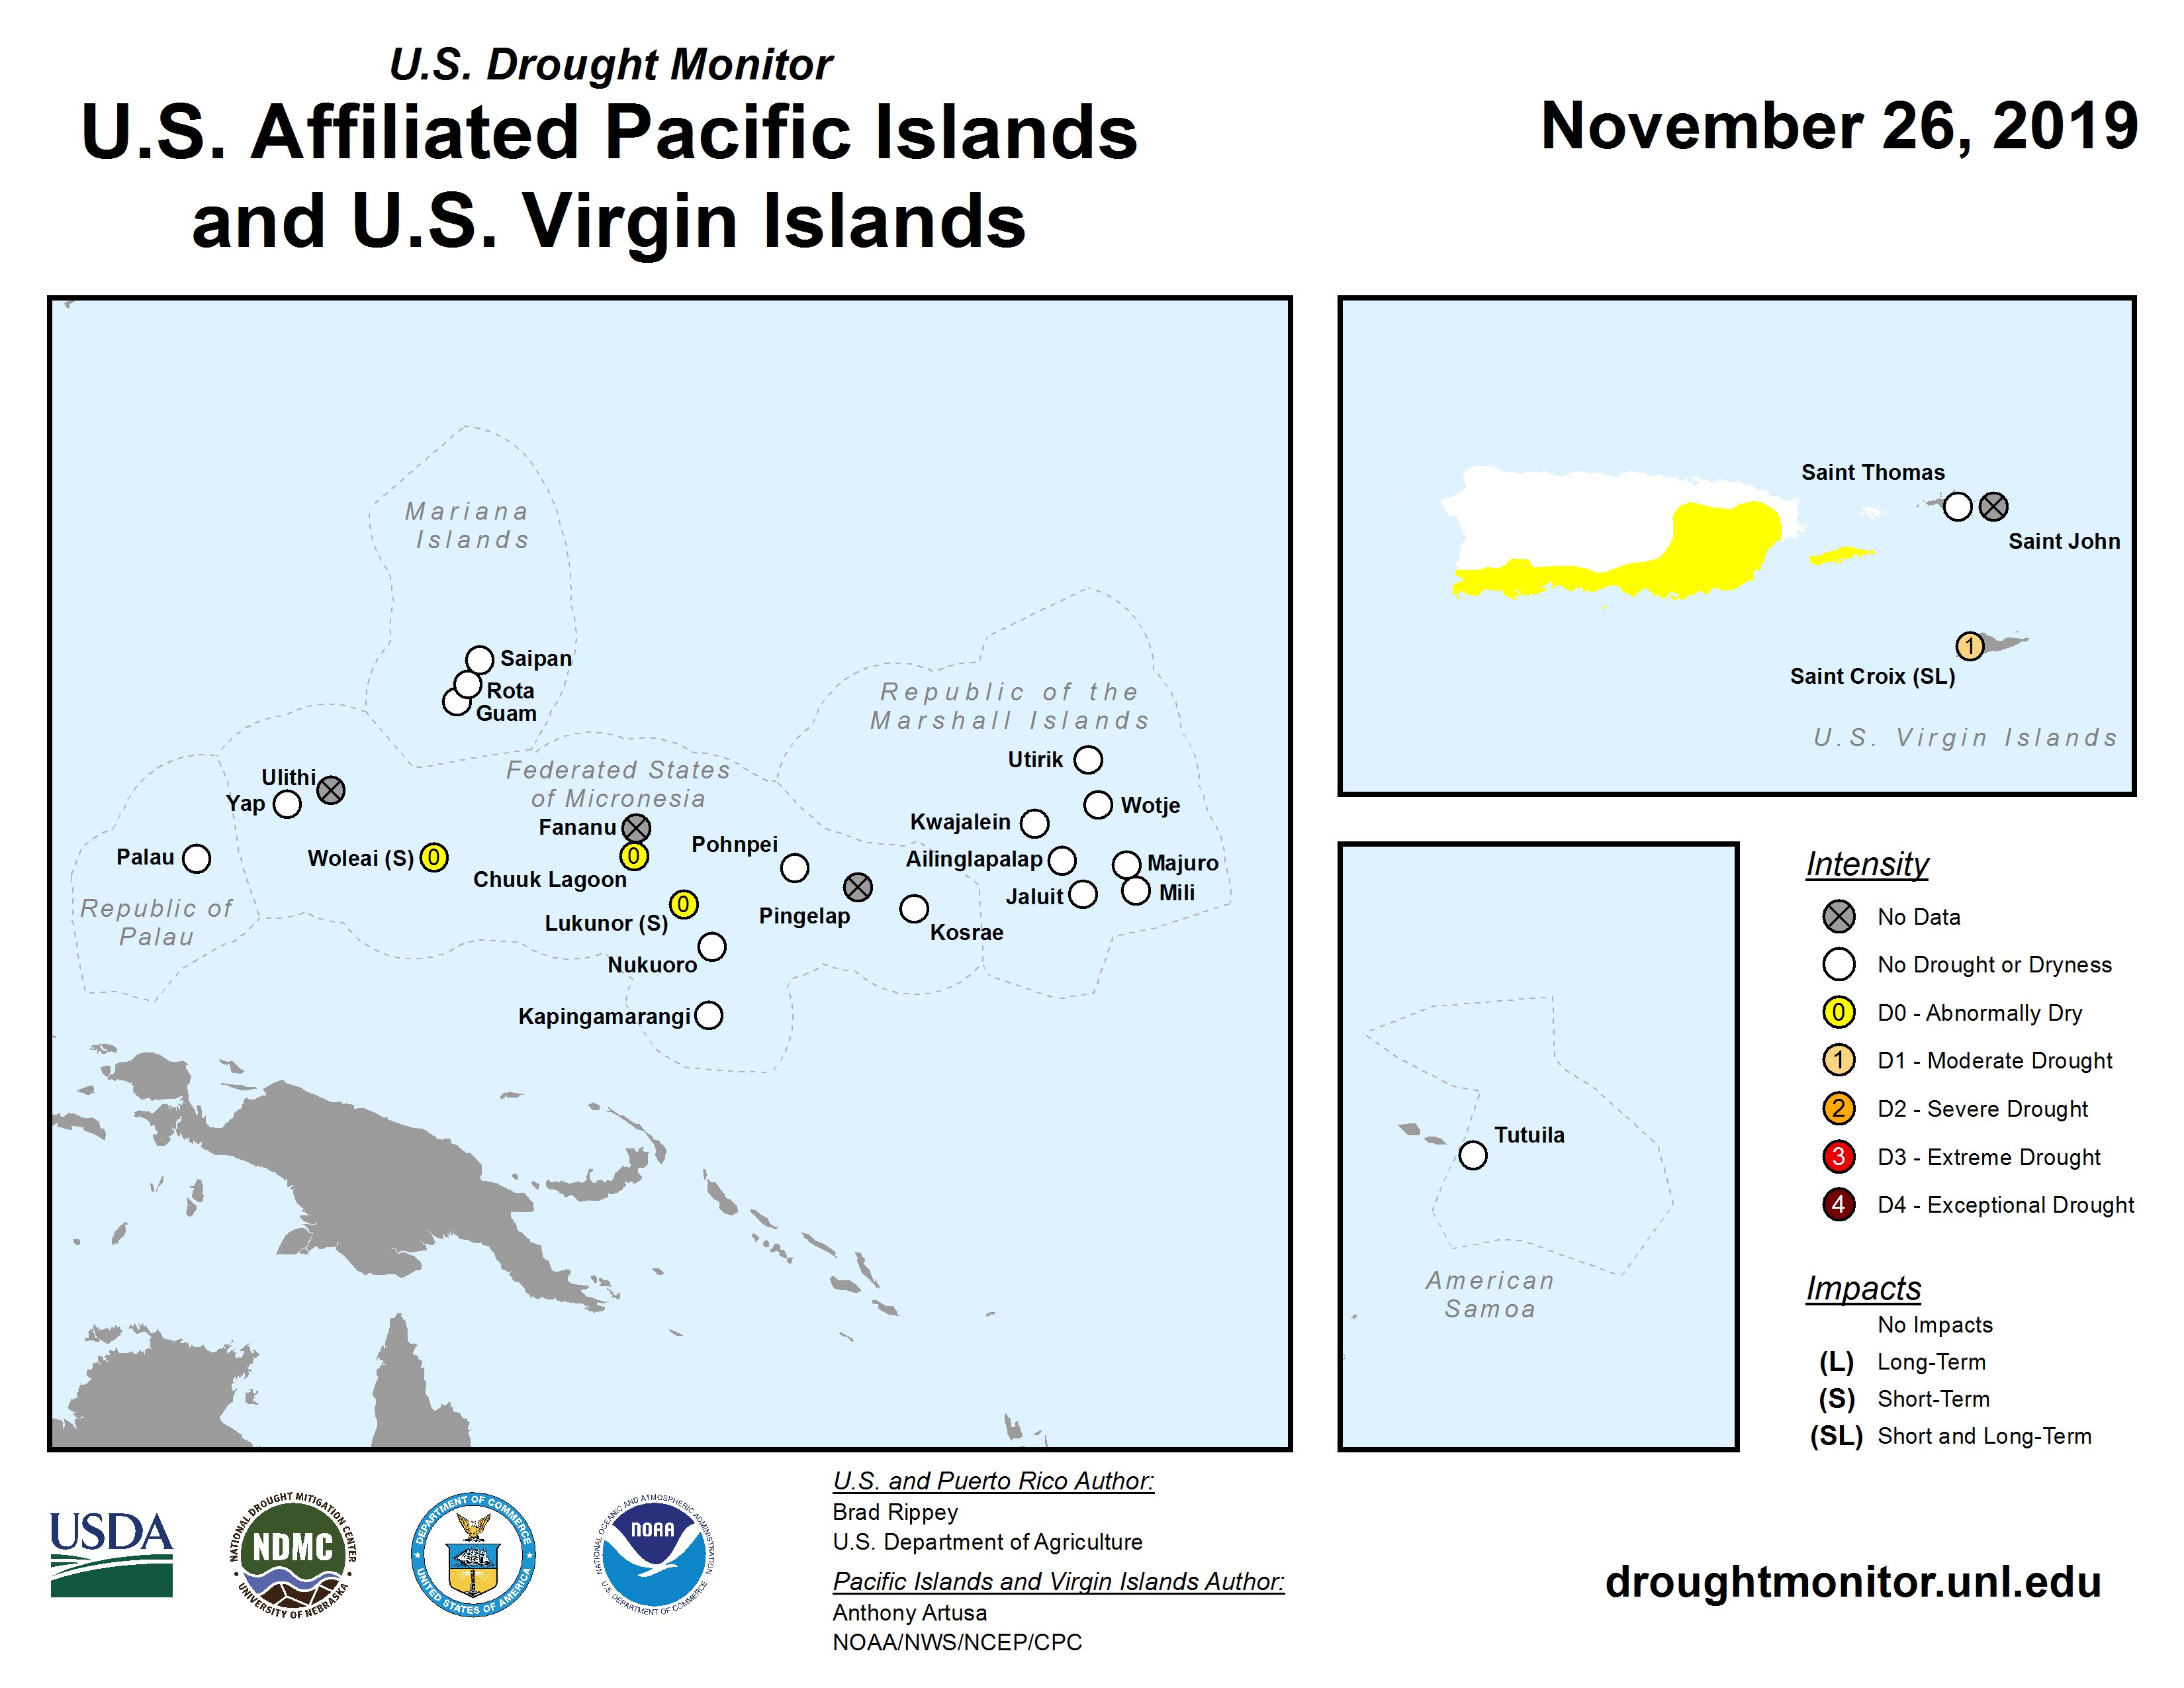
U.S. Affiliated Pacific Islands and the U.S. Virgin Islands.
Below is the map for just CONUS.
 |
 |
| Last Week | This Week |
| |

Some might find this animation of twelve weeks of change useful;

The graphic below shows the one-week change in drought intensity. Yellow is bad. Green is good.
|

Now we show the week to week change information by region. The yellow is where the level of drought has been raised. The green is where the level of drought has been lowered.
 |
Some degradation in the southern part of this region. |
 |
| No change and almost no drought. |
 |
| No significant change and almost no drought. |
 |
| Fairly mixed with not much change. |
 |
| General Slight Improvement |
 |
| Some Degradation in the Northwest and also Colorado and Northern New Mexico. Improvement in Arizona and also to the west. We will see even more of that next week. |
Here is the Discussion that was issued with the Drought Report. The Regional Headings can be clicked on to obtain maps and statistics.
This Week’s Drought Summary
Mild weather returned across much of the country for several days, following a mid-November cold blast in the central and eastern United States. Meanwhile, significant precipitation fell during the drought-monitoring period in several areas, including the Southwest and interior Southeast. The Southwestern precipitation, which reversed a drying trend that began with a sub-par monsoon season, provided much-needed moisture and limited drought relief. In contrast, little precipitation fell in the Northwest, which continued to experience an increase in dryness-related impacts (e.g. poor snowpack, low streamflow, and dry soils). Farther east, rain further chipped away at lingering dryness across the South and East. Patchy drought persisted, however, across portions of the central and southern Plains, leading to adverse effects on some rangeland, pastures, and winter grains. As the drought-monitoring period ended on November 26, a pair of major storm systems – one emerging from the central Rockies and the other approaching the Pacific Coast – brought the promise of widespread precipitation that will be evaluated for next week’s U.S. Drought Monitor.
Northeast
Light to moderately heavy precipitation further reduced the coverage of abnormal dryness (D0) in Delaware, Maryland, New Jersey, and Pennsylvania. Some snow fell farther north, with 5.5 inches reported in Caribou, Maine, on November 19.
Southeast
Rain continued to generally reduce coverage of abnormal dryness (D0) and moderate drought (D1), especially from Alabama to Virginia. However, two pockets of severe drought (D2) persisted in northern Georgia. Farther south, little rain fell in Florida. There was a small expansion of D0 and D1 in northern Florida, while a large area of D0 persisted across southern Florida. In Tallahassee, Florida, precipitation totals for the year to date (35.59 inches, or 65% of normal, from January 1 – November 25) and the season (5.22 inches, or 48% of normal, from September 1 – November 25) remained substantially below average.
South
There were only minor changes made to the drought depiction in Oklahoma and Texas, where mostly dry weather accompanied a gradual warming trend. Oklahoma’s panhandle (and neighboring areas) continued to experience some of the region’s harshest conditions, with moderate to severe drought (D1 to D2) further expanding. On November 24, the U.S. Department of Agriculture (USDA) reported that topsoil moisture was 43% very short to short in Texas, along with 41% in Oklahoma. On the same date, Texas led the nation with 28% of its winter wheat rated in very poor to poor condition, compared to the national average of 14%. Farther east, there were few changes, although rain chipped away at pockets of abnormal dryness (D0) and moderate drought (D1) in a few areas. Though not in an area experiencing dryness, Knoxville, Tennessee, reported a daily-record rainfall total of 2.64 inches on November 23.
Midwest
The Midwest remained free of drought for a third consecutive week. The only part of the Midwest experiencing abnormal dryness (D0) is southeastern Kentucky, where some lingering groundwater shortages have been reported. In contrast, Midwestern wetness has contributed to the second-slowest U.S. corn harvest in the last 25 years. On November 24, only 84% of the nation’s corn had been harvested, compared to the 5-year average of 96%. The only recent year with a slower U.S. corn harvest was 2009, when 71% of the crop had been cut by November 24.
High Plains
Drought is confined to parts of Colorado and Kansas. However, further worsening of the drought situation occurred from southwestern through central Kansas, where moderate to severe drought (D1 to D2) was expanded. More than one-sixth (17%) of the winter wheat in Kansas was reported in very poor to poor condition on November 24, according to USDA. On the same date, USDA reported that topsoil moisture was more than 40% very short to short in Kansas (48%) and Colorado (42%).
West
The Southwest’s most significant storm since spring 2019 delivered drought-easing precipitation in Arizona and portions of neighboring states, starting on November 19. A record-setting, 155-day streak without measurable precipitation finally ended in Saint George, Utah, as 1.29 inches fell in a 24-hour period on November 19-20. Elsewhere in Utah, Bryce Canyon Airport netted 1.85 inches in a 48-hour period from November 19-21. In northern Arizona, Flagstaff received 2.37 inches (6.6 inches of snow) on November 20-21. The 20th was a particularly wet day in several desert locations, including Kingman, Arizona (0.83 inch), and Las Vegas, Nevada (0.67 inch). From November 19-21, totals in southern California reached 2.67 inches in Campo and 2.14 inches in Ramona. Where the heaviest precipitation fell in southern California, abnormal dryness (D0) was removed. General reductions in the severity of moderate to severe drought (D1 to D2) were introduced across Arizona’s wettest areas, including the central one-third of the state. Farther east, however, drought continued to worsen in northeastern New Mexico, where severe drought (D2) was bridged across two previously existing areas. On November 24, New Mexico’s topsoil moisture was rated 57% very short to short, according to USDA, while subsoil moisture was 68% very short to short. Meanwhile, precipitation remained scarce across much of the Northwest. Although September was wet in the Northwest and October was rather cold, effects of short-term dryness are becoming more apparent in indicators such as streamflow, snowpack, and soil moisture. On November 24, topsoil moisture was rated 60% very short to short in Nevada, along with 44% in Oregon. Abnormal dry (D0) were expanded across northern sections of California and Nevada, as well as parts of Oregon and Washington. Through November 25, early-season snowpack was less than 25% of average in several river basins across California, Nevada, Oregon, and Washington. In addition, low streamflow values were apparent in the Pacific Northwest, especially across western Oregon.
Alaska, Hawaii, and Puerto Rico
Short-term wetness continued across much of southeastern Alaska, leading to a change in the designation of the drought type from “SL” to “L.” This reflects the fact that any lingering dryness (D0) and moderate drought (D1) is apparent only at longer time scales. In Yakutat, for example, November 1-25 precipitation totaled 17.12 inches (142% of normal), while the year-to-date sum stood at 89.97 inches (66% of normal). Meanwhile in Hawaii, windward showers led to some erosion of the recently introduced areas of abnormal dryness (D0), particularly on Oahu, Maui, and the Big Island. Elsewhere on the Big Island, however, there are indications of vegetation stress as far west as the South Kohala coast; as a result, moderate drought (D1) was extended westward across the northern part of the island. Finally, abnormally dry conditions (D0) were slightly expanded in eastern Puerto, where low streamflow is being reported and the 2019 wet season will soon be winding down.
Pacific Islands
A monsoon trough developed across Micronesia during this USDM week (11/20/19-11/26/19). The monsoon trough was accompanied by, or its precipitation was enhanced by, surface convergence north and south; upper-level troughs with divergent flow aloft over the western and eastern portions of Micronesia, especially over the northern Marshall Islands (RMI); and circulations or tropical disturbances, one of which developed into Tropical Storm Kammuri (29W) near the Marianas at the end of the week. Convergence associated with a trade-wind surge enhanced precipitation over the northern RMI at mid-week. South of the equator, a surface trough and frontal zone brought rain to American Samoa; Tropical Cyclone Rita developed to the west, but did not affect the Samoan Islands.
Satellite-based estimates of 7-day precipitation (QPE) showed 4 large areas of 2+ inches of rainfall. One stretched from the Marianas eastward across the northern Federated States of Micronesia (FSM) to the western RMI. The second one extended from the eastern RMI eastward across the Date Line. The third extended from the southern FSM southeastward across the equator toward the Samoan Islands. And the fourth stretched from the Samoan Islands southeastward. Less than an inch of rain was indicated by the QPE across Palau, the western to central FSM, parts of the RMI, and patchy areas around the Samoan Islands.
The Palau International Airport reported 0.86-inch of rain this drought week. It has been dry during the past 2 weeks in Palau, but very wet during the antecedent two-week period, and wet for the month. Preliminary Month-To-Date (MTD) rainfall is 11.07 inches, and the normal for the corresponding period is 12.33 inches. Year-To-Date (YTD) rainfall stands at 157.14 inches, and the normal for the corresponding period is 134.14 inches. No change was made this week to Palau’s drought designation, though it will be monitored for possible deterioration to D0 (abnormal dryness) next week.
The Week-To-Date (WTD) rainfall in Guam totaled 2.41 inches, which easily surpassed the 1-inch weekly minimum threshold to meet most water demands. In fact, this threshold has been exceeded during each of the past 12 weeks. The monthly minimum value of 4 inches was exceeded during 8 of the past 12 months in Guam. For the Commonwealth of the Northern Mariana Islands (CNMI), Rota reported a WTD rainfall of 1.36 inches, and surpassed the 1-inch minimum threshold during 11 of the past 12 weeks. Seven of the past 12 months were wet, having surpassed the monthly minimum value of 4 inches. Rainfall observations in Saipan for the drought week included 1.14 inches (manual gauge, 1 day missing), 0.81-inch (ASOS, 1 day missing), and 0.94-inch (National Park Service). For the ASOS station, this is the third dry week in a row. No changes were deemed necessary to the drought depictions for Guam or the CNMI this week.
For the Federated States of Micronesia (FSM), WTD precipitation measurements were obtained at Ulithi (0.21-inch), Lukunor (0.98-inch), Woleai (1.00 inch), Chuuk Lagoon (1.46 inches), Nukuoro (2.04 inches), Yap (2.37 inches), Kosrae (3.12 inches), Pohnpei (4.61 inches), and Kapingamarangi (5.97 inches). Stations that did not report this week included Fananu and Pingelap. Having been dry for the past 3 weeks, and during the last 2 months, Chuuk Lagoon’s drought designation was reduced one category to abnormal dryness (D0(S)). Drought designations for both Woleai and Lukunor remain at D0(S) this week.
Across the Republic of the Marshall Islands (RMI), WTD precipitation amounts included Kwajalein (1.29 inches), Wotje (1.92 inches), Utirik (1.97 inches), Majuro (2.92 inches), Ailinglapalap (3.67 inches), Jaluit (4.61 inches), and Mili (5.52 inches). The rain gauge issue with Jaluit seems to be resolved. The rainfall measurements underwent a substantial change, from persistently drier than nearby stations for the last several months to persistently wet the last 4 weeks. Jaluit’s monthly precipitation was approximately half of that of surrounding RMI stations in August 2019 (5.20 inches), September (5.74 inches), and October (3.99 inches). However, in the past few weeks, Jaluit’s weekly rainfall was similar to, or wetter than nearby stations for November 5 (3.19 inches), November 12 (2.30 inches), November 19 (4.11 inches), and November 26 (4.61 inches). Given the wet conditions, and local reports of healthy vegetation, it was decided to remove all drought/dryness from Jaluit.
American Samoa experienced a wet week, with the three primary observing sites reporting adequate rainfall amounts to meet most water demands. Pago Pago observed 1.46 inches of rain this week (1 day missing), and the two National Park Service higher-elevation sites (Siufaga Ridge and Toa Ridge) measured 1.84 inches and 2.26 inches, respectively, with each missing one day of data. American Samoa therefore retains its drought-free status.
Virgin Islands
For the November 20-26 drought week, the Cyril E. King Airport in St. Thomas measured 0.48-inch of rain. The MTD rainfall total of 3.15 inches is 68.48 percent of normal for the period. Since September 1, 9.27 inches of rain have fallen at the airport, which is 59.42 percent of normal. The YTD rainfall accumulation of 32.20 inches is just over 90 percent of normal for the period. Anna’s Retreat (VI-ST-1) has been drier than the airport this year, with a WTD value of 0.11-inch, and a MTD value of 1.71 inches. Since September 1, 5.79 inches of rain have fallen at Anna’s Retreat, and the YTD total is 23.37 inches. SPI values for 1,3,6,9, and 12 months at Charlotte Amalie are -0.62, -0.40, +0.15, -0.31, and -0.70. The Grade School 3 Well at Charlotte Amalie started the drought week off with a water depth of about 9.98 feet below the surface, before rising briefly to 9.85 feet, and then falling late in the week to near 10.19 feet. Although St. Thomas remains drought-free at this time, some of the SPI values suggest a tilt toward D0 conditions. Accordingly, the potential for deterioration to D0 will be monitored.
In St. Croix, the Henry E. Rohlsen Airport reported WTD and MTD rainfall totals of 0.36-inch and 2.40 inches, respectively. Since September 1, the airport received 5.40 inches of rain, which is 36.14 percent of normal. Since January 1, 21.88 inches of rain have fallen, which is 62.39 percent of normal. In Christiansted (station VI-SC-8), the WTD and MTD rainfall totals were 1.03 inches and 2.43 inches. Since September 1, 9.79 inches of rain has fallen at the site. The SPI values at 1,3,6,9, and 12 months are -1.04, -1.68, -0.89, -0.90, and -1.46, respectively. The water depth at St. Croix’s Adventure 28 Well ranged between about 20.06 feet and 20.15 feet this past week. Like St. Thomas, SPI values suggest careful monitoring for potential deterioration in the near-term. For now, St. Croix’s drought designation remains at D1(S,L).
No data was available for St. John this week.
Looking Ahead
During the remainder of Thanksgiving week, a pair of major storm systems will result in a variety of weather hazards across the country. Both low-pressure systems will take similar paths across the central Plains, upper Midwest, and Northeast, although the latter storm will be a higher-impact event across the West. Five-day precipitation totals could broadly reach 1 to 3 inches or more from the Plains to the Appalachians, with higher liquid amounts (in the form of heavy snow) expected in some Western mountain locations – especially in California and the Southwest. East of the Rockies, both storms have the potential to produce major accumulations of wind-driven snow, particularly across portions of the northern and central Plains and upper Midwest, leading to holiday-week travel disruptions. In addition, strong to locally severe thunderstorms could sweep across the South, especially on November 29-30. By December 1, a coastal low-pressure system may begin to intensify along the Atlantic Seaboard, while a new Pacific storm will begin to affect the Far West.
The NWS 6- to 10-day outlook for December 2 – 6 calls for the likelihood of near- or below-normal temperatures nationwide, except for warmer-than-normal weather in coastal California and across portions of the southern High Plains and the Southwest. Meanwhile, near- or below-normal precipitation in the eastern half of the country should contrast with wetter-than-normal conditions from California to the Rockies and northern High Plains.
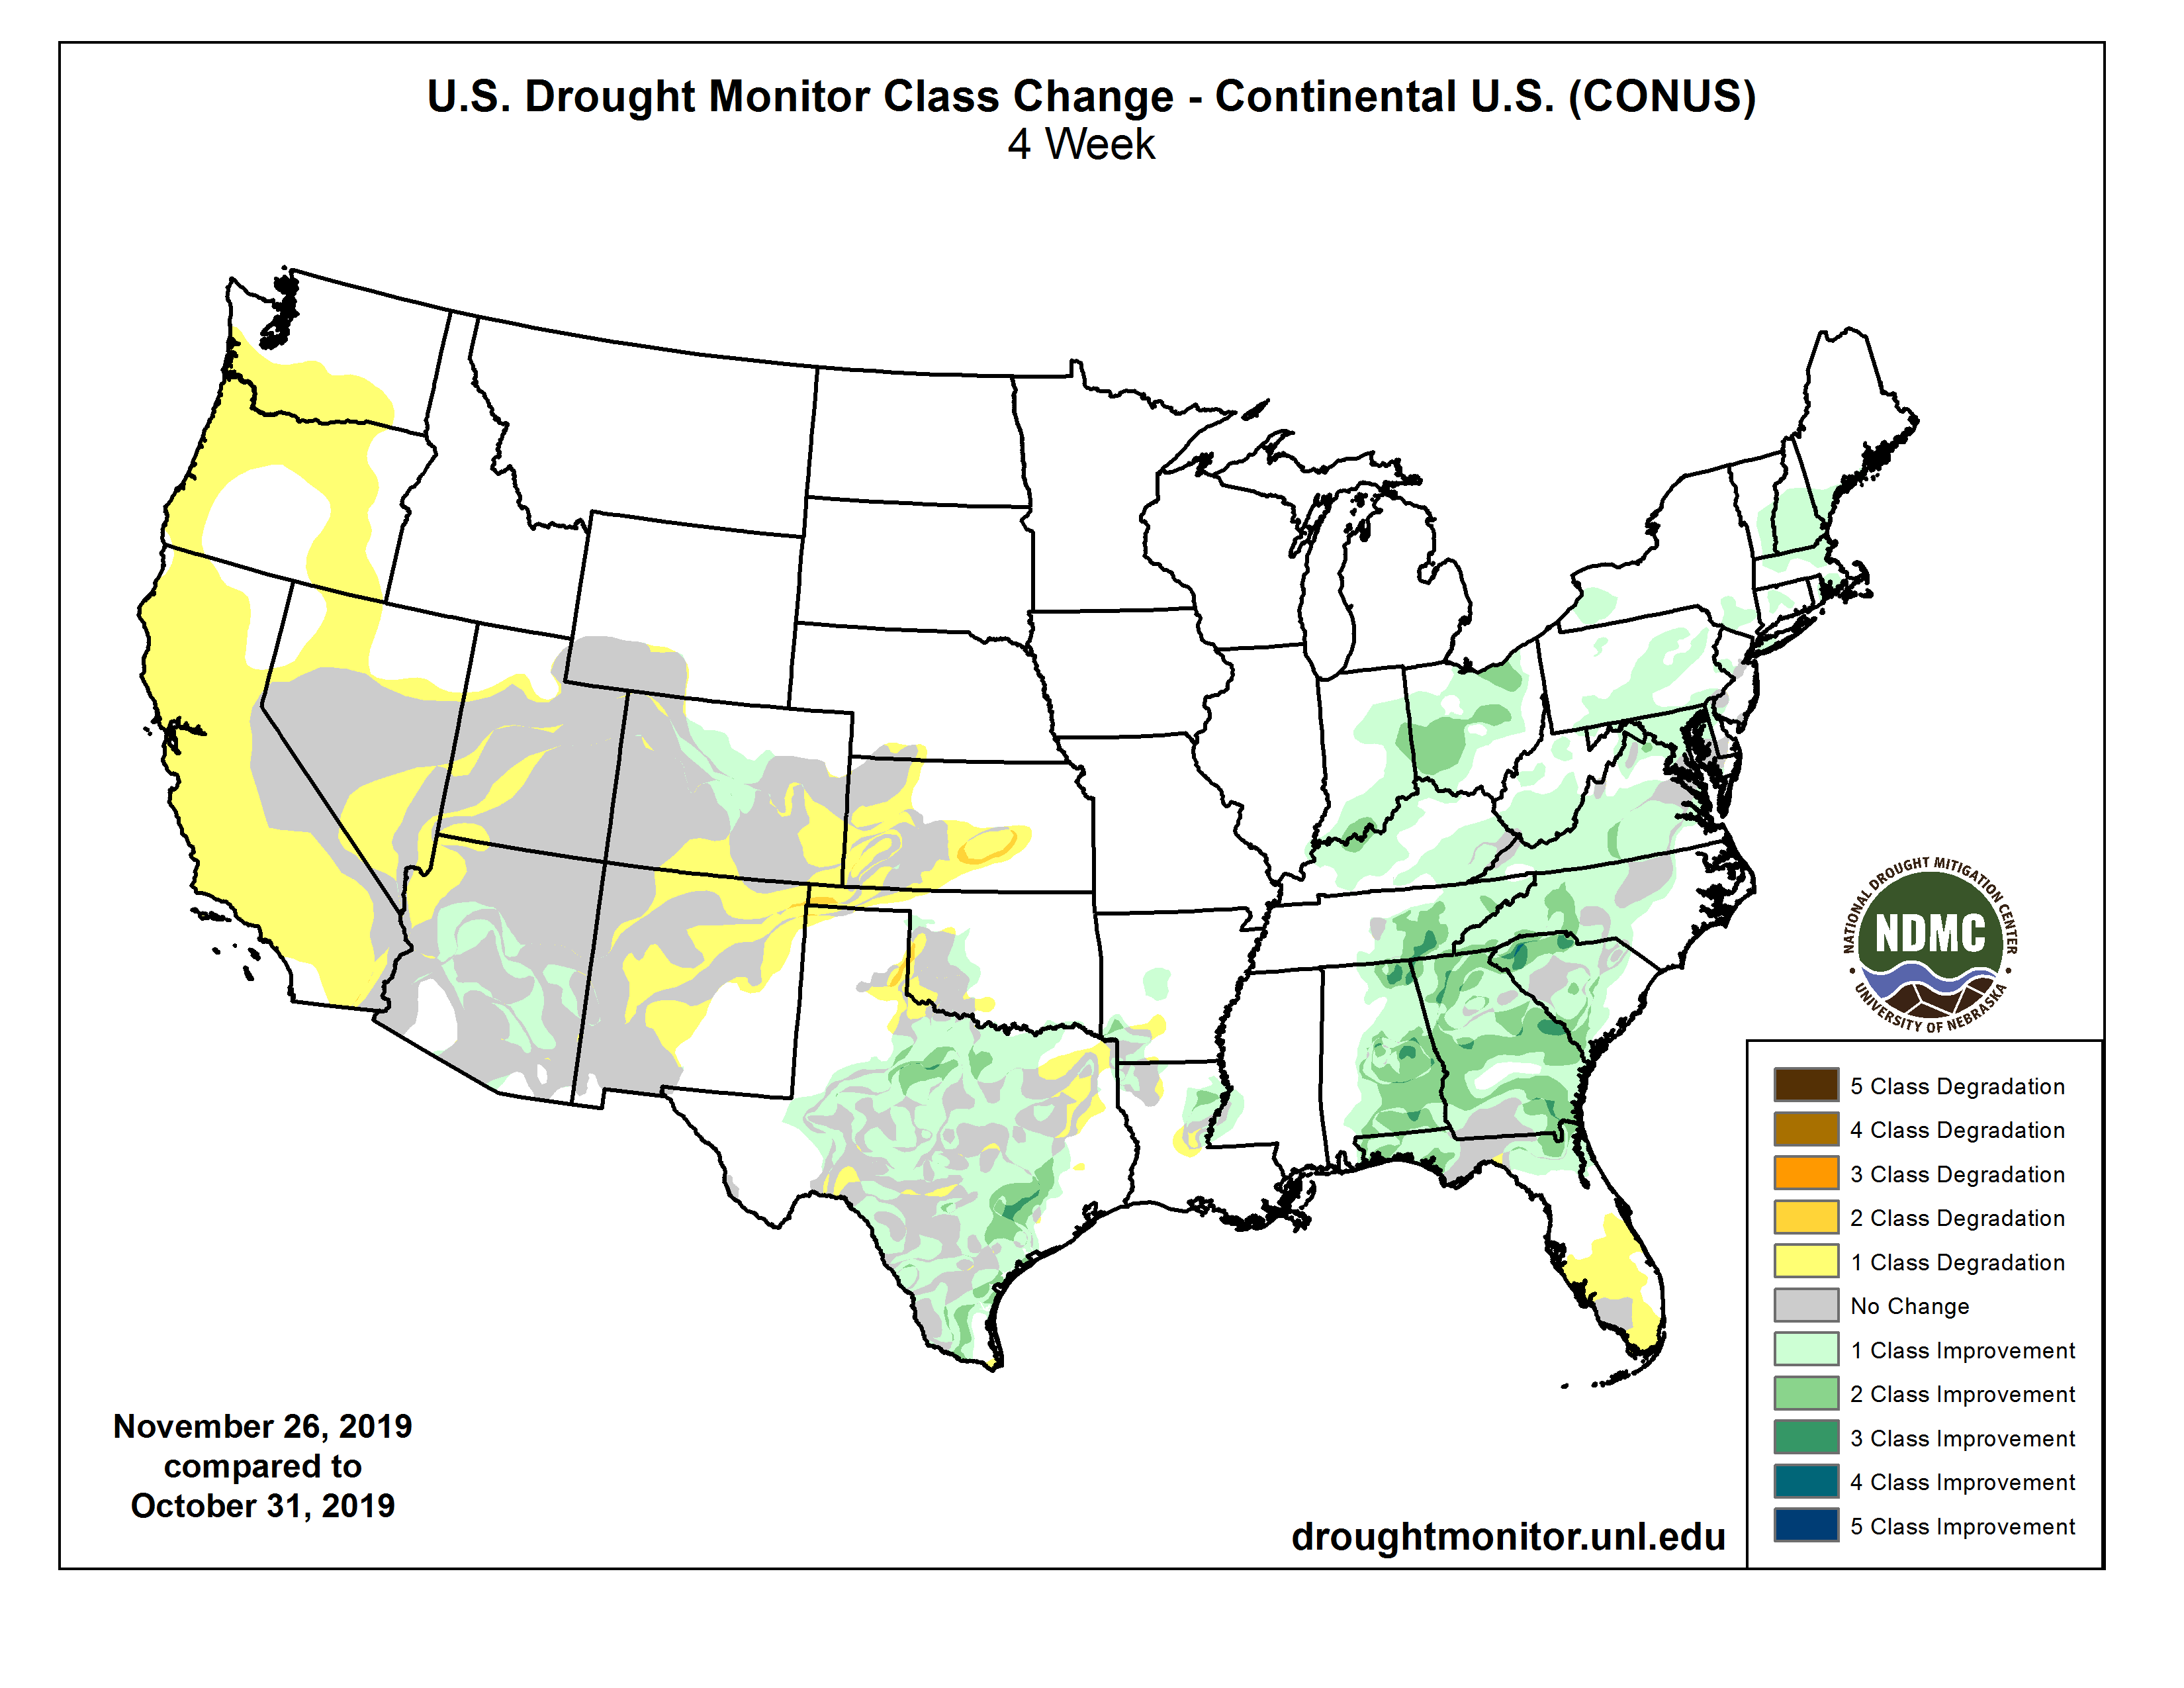
Some may find the below way of looking at things useful and I hope these graphics are not too small to read. I did not make them so you could click on them individually but you can click on the whole graphic and it may enlarge. But I think you get the picture. It has been a rapid onset and demise. When you read these graphics, remember that the older graphics are not the drought conditions that existed then but the change from then until now.

Let’s focus on the change between October 29, 2019 and November 26, 2019 i.e. one month.
Focusing on the Intermountain West

Drought Forecasts
These two forecasts (Monthly and Season) are issued by the same agency but to obtain them you need to access two different links here and here.
Here is the Monthly Drought Outlook which was updated on October 31, 2019. Thus it is pretty useless at this point as it is now November 29. I have left it in the Report because it will update at the end of the month but right now it makes sense to focus on the seasonal forecast which follows this one month forecast.

Here is the Three-Month Forecast which was issued on November 21, 2019

Floods
Floods remain a concern but only in a limited area.

| Last Week | Current Week |
| https://econintersect.com/images/2019/ |

Let’s see if this animation works. It shows the pattern for August and September.

How has the reduction in flooding impacted Fieldwork Days?

Wildfires

Current Wildfire Risk. This is a new model that updates daily to show the short-term risk.

Click here to update. Red is high risk, blue is low risk. This graphic updates daily but you have to click on the link provided to get the updates More information can be found here.
This explains the model a bit.


Looking out another month.


Crop Progress
Recently, we looked at the individual crop progress reports graphically from this source and we have reviewed this Executive Summary Report which provides projections of the ultimate harvest. It is important to make the distinction between crop progress which we report in this section of our article weekly and forecasts of what the result for the crop will ultimately be and we review that information as the NASS forecasts are released. Once a month they issue a briefing document on the overall situation (that was this week and we have started to report on that) and they also release more targeted information from time to time.
Now, we will look at the season to date information summary. This is a crop progress report, not a forecast.

| Crop | Crop Progress | Crop Condition |
| Corn | Slow Harvested | NA |
| Soybeans | OK(Harvested) | NA |
| Spring Wheat | Slow (Harvested) | NA |
| Winter Wheat | OK(Emerged) | Bad |
| Cotton | Good (Harvested) | NA |
| Sorghum | Good (Harvested) | NA |
| Rice | Good (Harvested) | NA |
| Barley | Slow (Harvested) | NA |
| Peanuts | Good(Harvested) | NA |
| Sugarbeets | OK(Harvested) | NA |
| Sunflowers | Very Very Slow(Harvested) | NA |
We no longer have enough information on crop conditions to take the above table and show it the way we have been doing as a matrix.
The degree-day deficit graphic is also not available as the growing season winds down. The data is available but the nice graph was not in any of the usual sources that I use to prepare this article.
International

A map helps and is not always available and fortunately, it was available this week.

Major Sources of Information
In the box are shown the major resources we use. We will not be using them all each week but the reader is welcome to refer to these resources.
Major Sources of Information Used in this Weekly Report
|
Background Information


The sequence of drought occurrence and impacts for commonly accepted drought types. All droughts originate from a deficiency of precipitation or meteorological drought but other types of drought and impacts cascade from this deficiency. (Source: NDMC)
Source: National Drought Mitigation Center, University of Nebraska-Lincoln


