


Written by Sig Silber
The updated January Outlook has been released. The full-month forecast is dominated by the first week which has the extreme temperature anomalies. NOAA refuses to acknowledge that a La Nina never fully materialized and the previously cool ENSO event is now ENSO Neutral. This is a bureaucratic problem, among other things, and on January 12 I believe that the troops will be given permission to say that we are now in ENSO Neutral. Government in Action. One has to respect the hierarchy.

First some housekeeping information. For those who want the forecasts beyond three months, we reported previously on the December 15 NOAA 15-Month Forecast and compared the first nine months of the NOAA Outlook with that of JAMSTEC in a special Update that you can get to by clicking here. We will of course publish a new 15 Month Update Report shortly after January 19, 2017. Remember if you leave this page to visit links provided in this article, you can return by hitting your “Back Arrow”, usually top left corner of your screen just to the left of the URL box.
NOAA Update of their January Outlook
NOAA has, as usual, issued an update for the month following the last day of the prior month. This update was issued on December 31 and rather than have a Special Update that covers simply the next month, we combined that report with our Regular Weekly Report and we will discuss that first by comparing the Updated Outlook for January to the Early Outlook for January issued on December 15, 2016.
Temperature
Prior Outlook Issued on December 15, 2016

Updated Outlook Issued on December 31, 2016

Precipitation
Prior Outlook Issued on December 15, 2016

Updated Precipitation Outlook Issued on December 31, 2016

Below is the discussion issued with this update.
PROGNOSTIC DISCUSSION FOR MONTHLY OUTLOOK NWS CLIMATE PREDICTION CENTER COLLEGE PARK MD 300 PM EST SAT DEC 31 2016
30-DAY OUTLOOK DISCUSSION FOR JANUARY 2017
THE MAJOR CLIMATE FACTORS IMPACTING THE JANUARY OUTLOOK HAVE NOT CHANGED SIGNIFICANTLY. RECENT SST ANOMALIES OVER THE CENTRAL PACIFIC REMAINED NEGATIVE, WITH WEEKLY VALUES NEAR THE THRESHOLD FOR LA NINA [Editor’s Note: NOAA-Speak for there is no La Nina]. THE ATMOSPHERIC PATTERN REMAINS INCONSISTENT WITH A ROBUST MJO, SO THE MJO WILL LIKELY NOT PLAY A ROLE IN THE JANUARY TEMPERATURE AND PRECIPITATION PATTERNS. EXTRATROPICAL MODES OF VARIABILITY ARE LIKELY TO DOMINATE THE PATTERN OVER NORTH AMERICA. SINCE THOSE MODES HAVE LOWER LEVELS OF PREDICTABILITY BEYOND ABOUT 14 DAYS, THE UNCERTAINTY IN THE LATTER HALF OF JANUARY REDUCES THE OVERALL CONFIDENCE.
THE TEMPERATURE OUTLOOK REMAINS LARGELY THE SAME, THOUGH THE SIGNALS FOR BELOW NORMAL TEMPERATURES ACROSS THE NORTHWEST QUADRANT OF THE CONUS ARE MORE CERTAIN, SO PROBABILITIES ARE INCREASED. THE ANOMALIES FORECAST DURING THE FIRST 7 DAYS OF THE MONTH ARE LIKELY TO BE QUITE LARGE, SO EVEN WITH NEAR OR ABOVE NORMAL TEMPERATURES DURING THE LATTER HALF OF THE MONTH, THE MONTHLY VALUES ARE LIKELY TO BE BELOW AVERAGE FOR THE NORTHWESTERN PORTION OF THE CONUS. THAT SIGNAL FOR BELOW NORMAL TEMPERATURES EXTENDS OVER SOUTHEAST ALASKA AND THE ALASKA PANHANDLE. WARMTH EARLY IN THE PERIOD AND A PERSISTENT SIGNAL FROM ABOVE NORMAL SEA SURFACE TEMPERATURES FAVORS ABOVE NORMAL TEMPERATURES FOR WESTERN ALASKA. ABOVE NORMAL TEMPERATURES ARE STILL FAVORED FOR MUCH OF THE SOUTHERN CONUS AND THE NORTHEAST, WITH THE LATEST MODEL RUNS FAVORING ABOVE NORMAL TEMPERATURES OVER THE MID-ATLANTIC RATHER THAN NEW ENGLAND. ABOVE NORM AL TEMPERATURES ACROSS THE SOUTHERN TIER IS CONSISTENT WITH THE SEASONAL SIGNALS, SO THAT SIGNAL WAS INCORPORATED INTO THE OUTLOOKS.
THE PRECIPITATION OUTLOOK IS MODIFIED TO REFLECT THE SHORTER TERM OUTLOOKS FOR HEAVY PRECIPITATION ACROSS THE SOUTHEAST DURING THE FIRST 7 DAYS OF THE MONTH, ALTHOUGH THE CLIMATE SIGNALS STILL FAVOR BELOW NORMAL PRECIPITATION FOR SOME OF THE SOUTHEAST, SO THE PROBABILITIES ARE KEPT LOWER. A STORM SYSTEM EARLY IN THE PERIOD, COMBINED WITH THE OUTLOOKS THROUGH 14 DAYS, FAVOR ABOVE MEDIAN PRECIPITATION ACROSS THE GREAT BASIN, CENTRAL AND NORTHERN ROCKIES, AND PACIFIC NORTHWEST. SIGNALS FOR THE LATTER HALF OF JANUARY FAVOR ABOVE MEDIAN PRECIPITATION FOR THE PACIFIC NORTHWEST AND NORTHERN ROCKIES, SO THE HIGHEST PROBABILITIES FOR ABOVE MEDIAN PRECIPITATION ARE ACROSS THE NORTHERN PORTION OF THE WESTERN CONUS.
Sometimes it is useful to compare the present month outlook to the three-month outlook
January Plus January 2017 – March 2017 Outlook

One can mentally subtract the January Outlook from the three-month Outlook and create the Outlook for the last two months in the three-month period namely February and March 2017. If one does that you might conclude that:
One has to keep in mind that we are now subtracting a January Map issued on December 31 from a December 15 three-month map so it is less reliable than the exercise we went through in the special Update Report. We are assuming that the three-month outlook issued on December 15 would not change if it was released today. The results in the box above might be an indication of how February and March will differ from the three-month outlook or it might alternatively indicate how the three-month outlook might be modified if issued today. So the discussion in the paragraph above this may be overruled by a conclusion that the three-month outlook is no longer correct and the updated January Outlook is a better predictor of the three-month outlook than the three-month maps issued on December 15. The Southeast excluding Florida may fall into that category since January is shown as wet and the three months are shown as dry. It is not likely that February and March will have sufficiently high probabilities to be dry to overcome a wet January and still have the three-month period show as a dry anomaly.
Focus on Alaska and CONUS (all U.S. except Hawaii)
First Let us focus on the Current (Right Now to 5 Days Out) Weather Situation.
This graphic provides a good indication of where the moisture is. It is a bit different than just moisture imagery as it is quantitative.

Image credit: Center for Western Weather and Water Extremes, Scripps/UCSD. More explanation can be found at Atmospheric Rivers (Click to read full Weather Underground Dr. Bob Henson article)
To turn the above into a forecasting tool click here and you will have a dashboard for a short-term forecasting model.
Here is a national animation of weather fronts and precipitation forecasts with four 6-hour projections of the conditions that will apply covering the next 24 hours and a second day of two 12-hour projections the second of which is the forecast for 48 hours out and to the extent it applies for 12 hours, this animation is intended to provide coverage out to 60 hours. Beyond 60 hours, additional maps are available at links provided below.
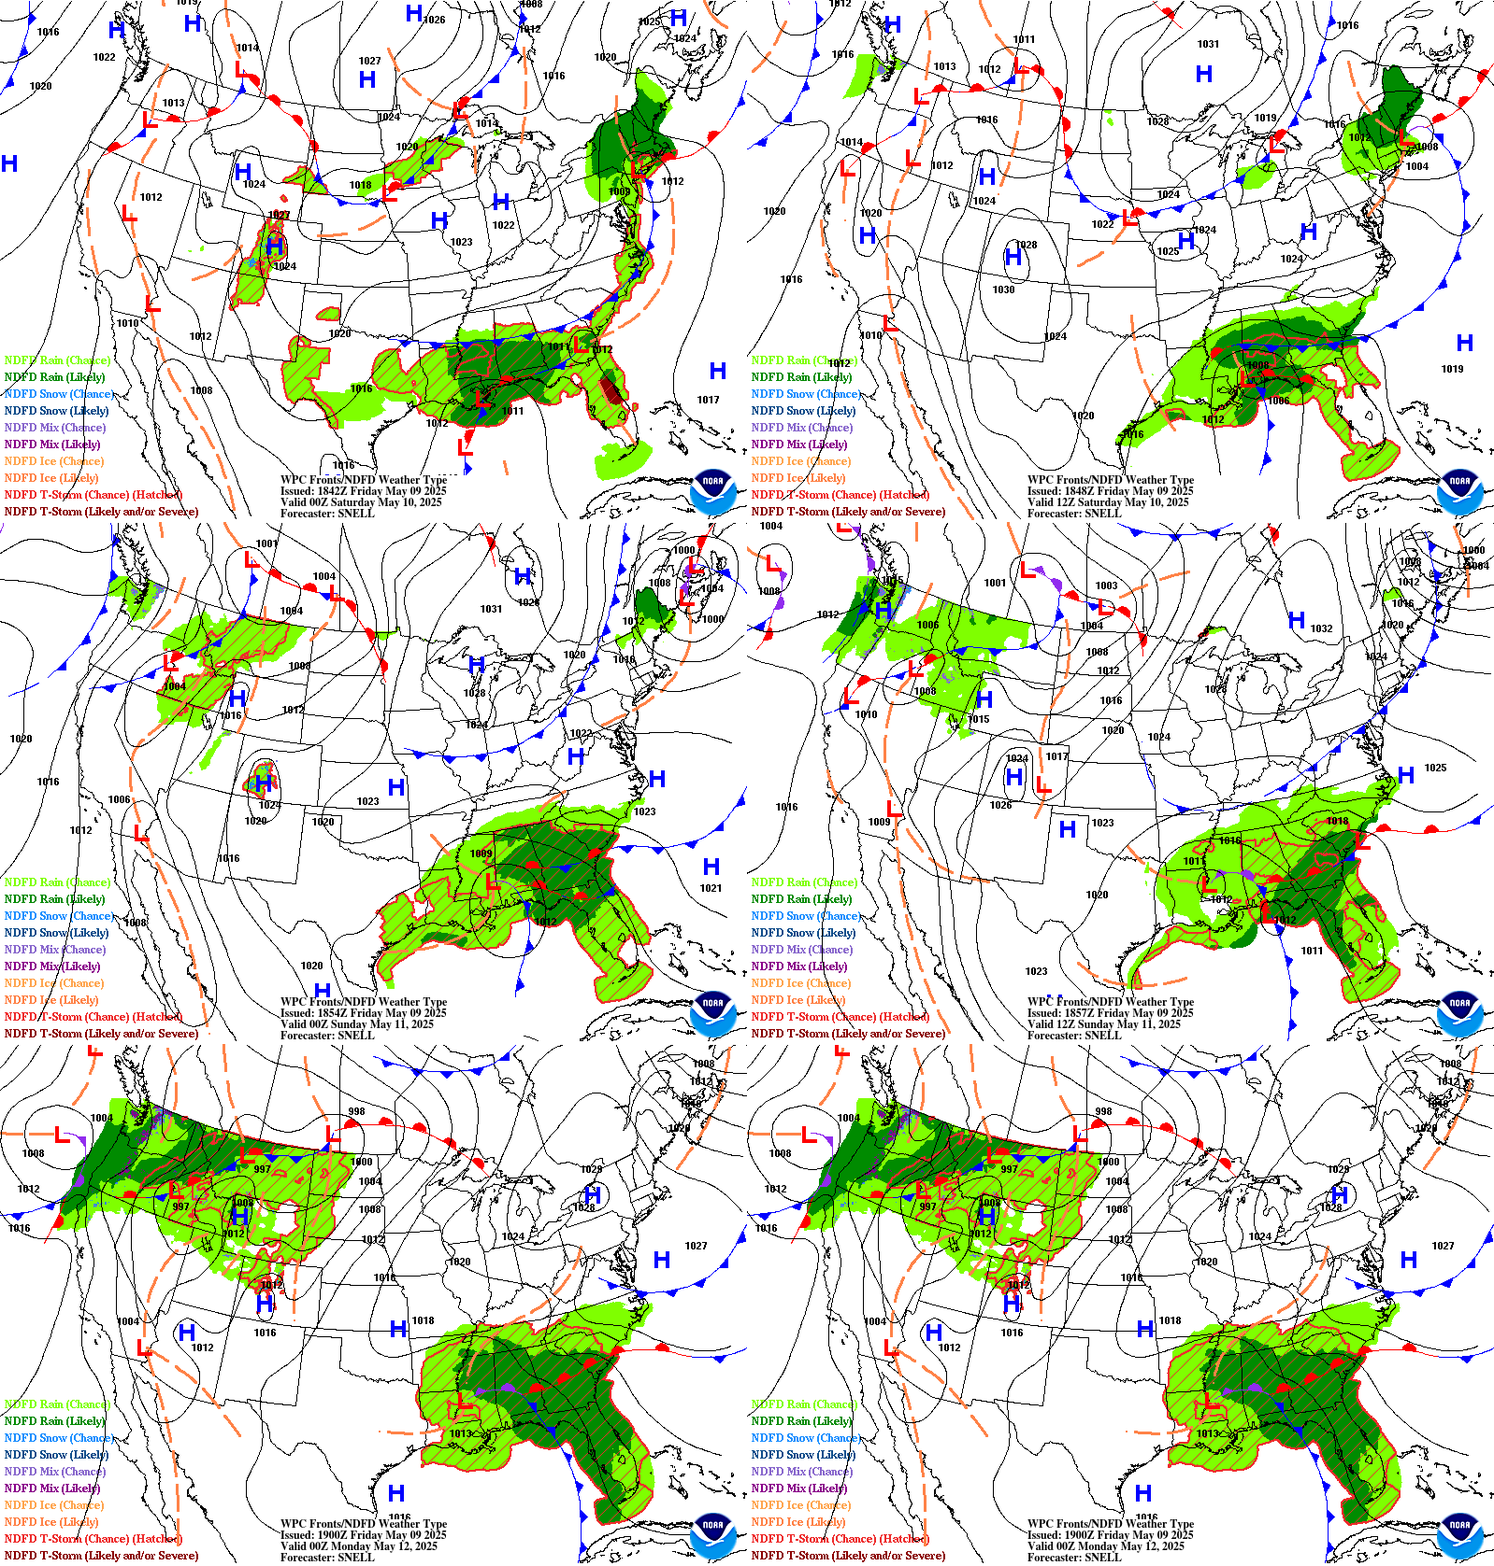
The explanation for the coding used in these maps, i.e. the full legend, can be found here although it includes some symbols that are no longer shown in the graphic because they are implemented by color coding.
U.S. 3 Day to 7 Day Forecasts
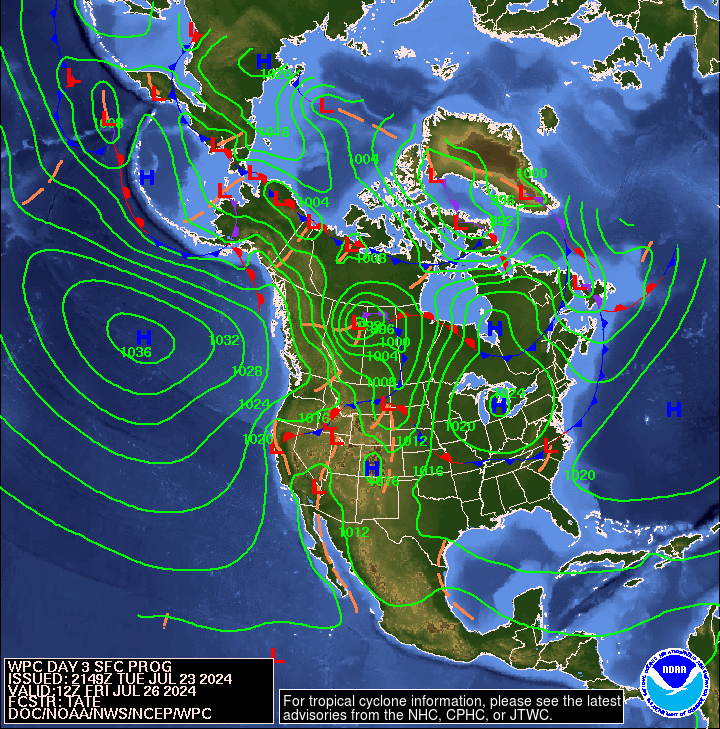
Below is a graphic which highlights the forecasted surface Highs and the Lows re air pressure on Day 3. The Day 6 forecast can be found here.
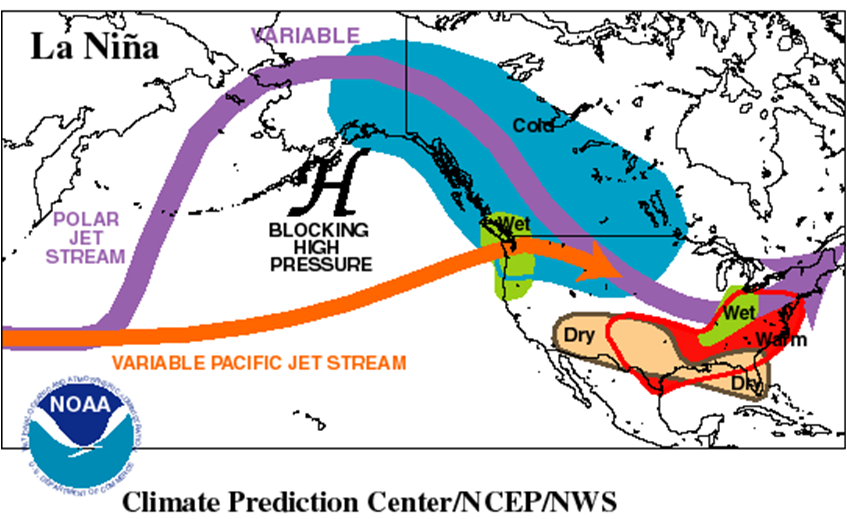
This is perhaps a good place to describe what a “Canonical” La Nina looks like. It is part of a very good write up covering many topics which can be found here.
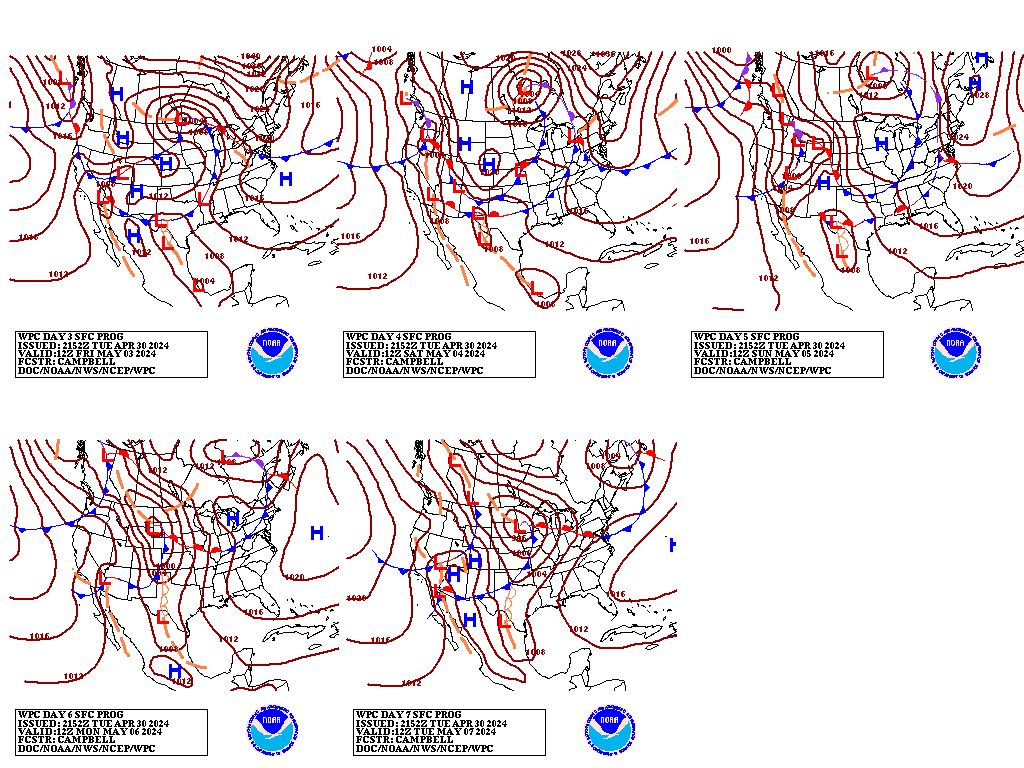
You can enlarge the below daily (days 3 – 7) weather maps for CONUS by clicking on Day 3 or Day 4 or Day 5 or Day 6 or Day 7. These maps auto-update so whenever you click on them they will be forecast maps for the number of days in the future shown.
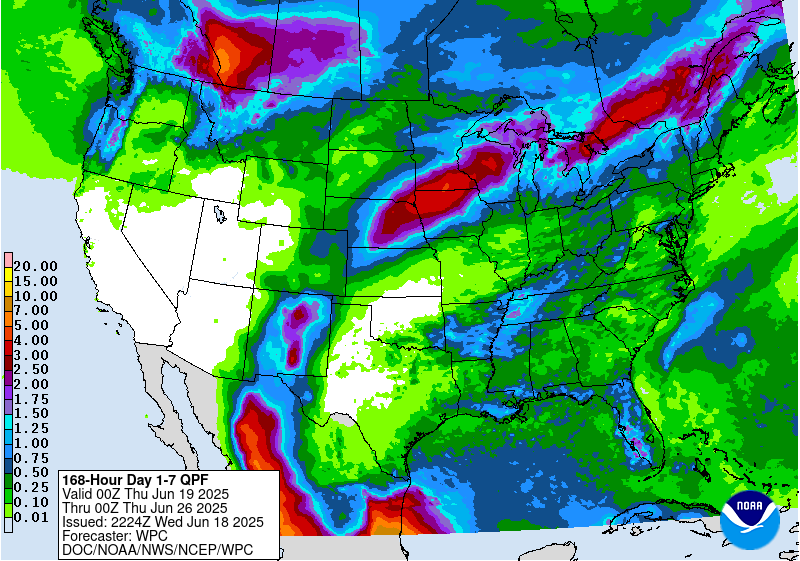
Here is the seven-day precipitation forecast. More information is available here.
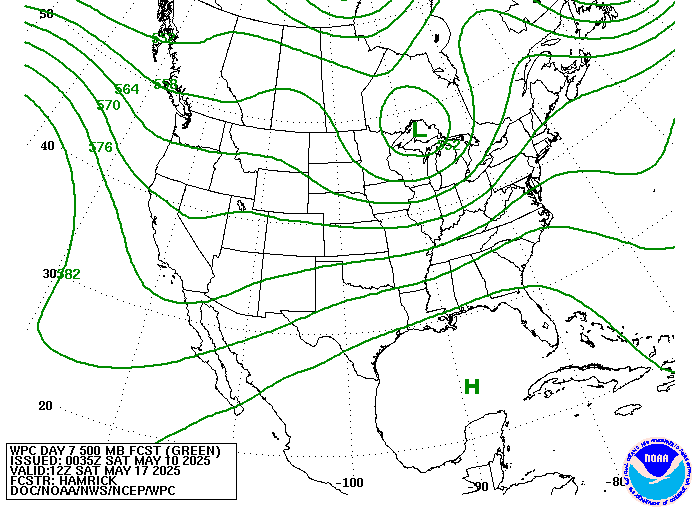
The map below is the mid-atmosphere 7-Day chart rather than the surface highs and lows and weather features. In some cases it provides a clearer less confusing picture as it shows only the major pressure gradients.This graphic auto-updates so when you look at it you will see NOAA’s latest thinking. The speed at which these troughs and ridges travel across the nation will determine the timing of weather impacts. This graphic auto-updates I think every six hours and it changes a lot. Because “Thickness Lines” are shown by those green lines on this graphic, it is a good place to define “Thickness” and its uses. The 540 Level general signifies equal chances for snow at sea level locations. Remember that 540 relates to sea level.
The graphic that I have been showing below was the Eastern Pacific a 24 hr loop of recent readings. When working, it does a good job of showing what is going on right now. When I published and in recent weeks, that graphic was not being displayed but the NOAA website indicated that was a temporary outage. So for the time being I have substituted a static version of that image which works almost as well. However you can obtain somewhat similar imagery loop image by clicking here. It actually provides more functionality than the either the previously or currently displayed version but you have to click to get it as I have not figured out how to get it to display otherwise. It is really cool imagery and explains a lot. For now you have the static image without clicking but can click to view a more elaborate loop image. The loop image provides a better feel for the speed at which things are taking place.
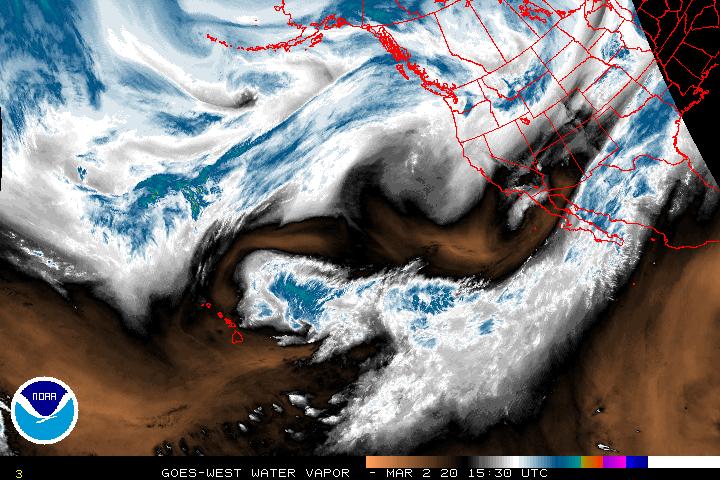
I have stopped showing the Tropical events graphic. We are still having tropical events even though it is January but we can track them with the other graphics that I am presenting including the graphic above and below. They are both the same graphic which you can tell by looking at the date and time stamp but the above graphic covers a larger area and is centered on the Eastern Pacific and the graphic below is centered on North America. That provides more resolution that trying to work with a single graphic that covers a larger fraction of Planet Earth.
Below is the current water vapor Imagery for North America.

Looking at the current activity of the Jet Stream.
First the current situation. Not all weather is controlled by the Jet Stream (which is a high altitude phenomenon) but it does play a major role in steering storm systems. The sub-Jetstream level intensity winds shown by the vectors in this graphic are also very important in understanding the impacts north and south of the Jet Stream which is the higher-speed part of the wind circulation and is shown in gray on this map. In some cases however a Low-Pressure System becomes separated or “cut off” from the Jet Stream. In that case it’s movements may be more difficult to predict until that disturbance is again recaptured by the Jet Stream. This usually is more significant for the lower half of CONUS i.e. further south than the Jet Stream.

Now looking at the 5 Day Forecast
 .
.
Putting the Jet Stream into Motion and Looking Forward a Few Days Also
To see how the pattern is projected to evolve, please click here. In addition to the shaded areas which show an interpretation of the Jet Stream, one can also see the wind vectors (arrows) at the 300 Mb level.
This longer animation shows how the jet stream is crossing the Pacific and when it reaches the U.S. West Coast is going every which way.
When we discuss the jet stream and for other reasons, we often discuss different layers of the atmosphere. These are expressed in terms of the atmospheric pressure above that layer. It is kind of counter-intuitive to me. The below table may help the reader translate air pressure to the usual altitude and temperature one might expect at that level of air pressure. It is just an approximation but useful.

Click here to gain access to a very flexible computer graphic. You can adjust what is being displayed by clicking on “earth” adjusting the parameters and then clicking again on “earth” to remove the menu. Right now it is set up to show the 500 hPa wind patterns which is the main way of looking at synoptic weather patterns. This amazing graphic covers North and South America. It could be included in the Worldwide weather forecast section of this report but it is useful here re understanding the wind circulation patterns.
Four- Week Outlook
I am going to show the three-month JFM Outlook (for reference purposes although I do not have a lot of confidence in it), the Updated Outlook for the single month of January, the 6 – 10 Day and 8 – 14 Day Maps and the Week 3 – 4 Experimental Outlook. I use “EC” in my discussions although NOAA sometimes uses “EC” (Equal Chances) and sometimes uses “N” (Normal) to pretty much indicate the same thing although “N” may be more definitive.
First – Temperature
Here is the Three-Month JFM Temperature Outlook issued on December 15, 2016:

Here is the Temperature Outlook for January Issued on December 31, 2016
6 – 10 Day Temperature Outlook Issued Today (Note the NOAA Level of Confidence in the Forecast Released on January 2 was 4 out of 5)
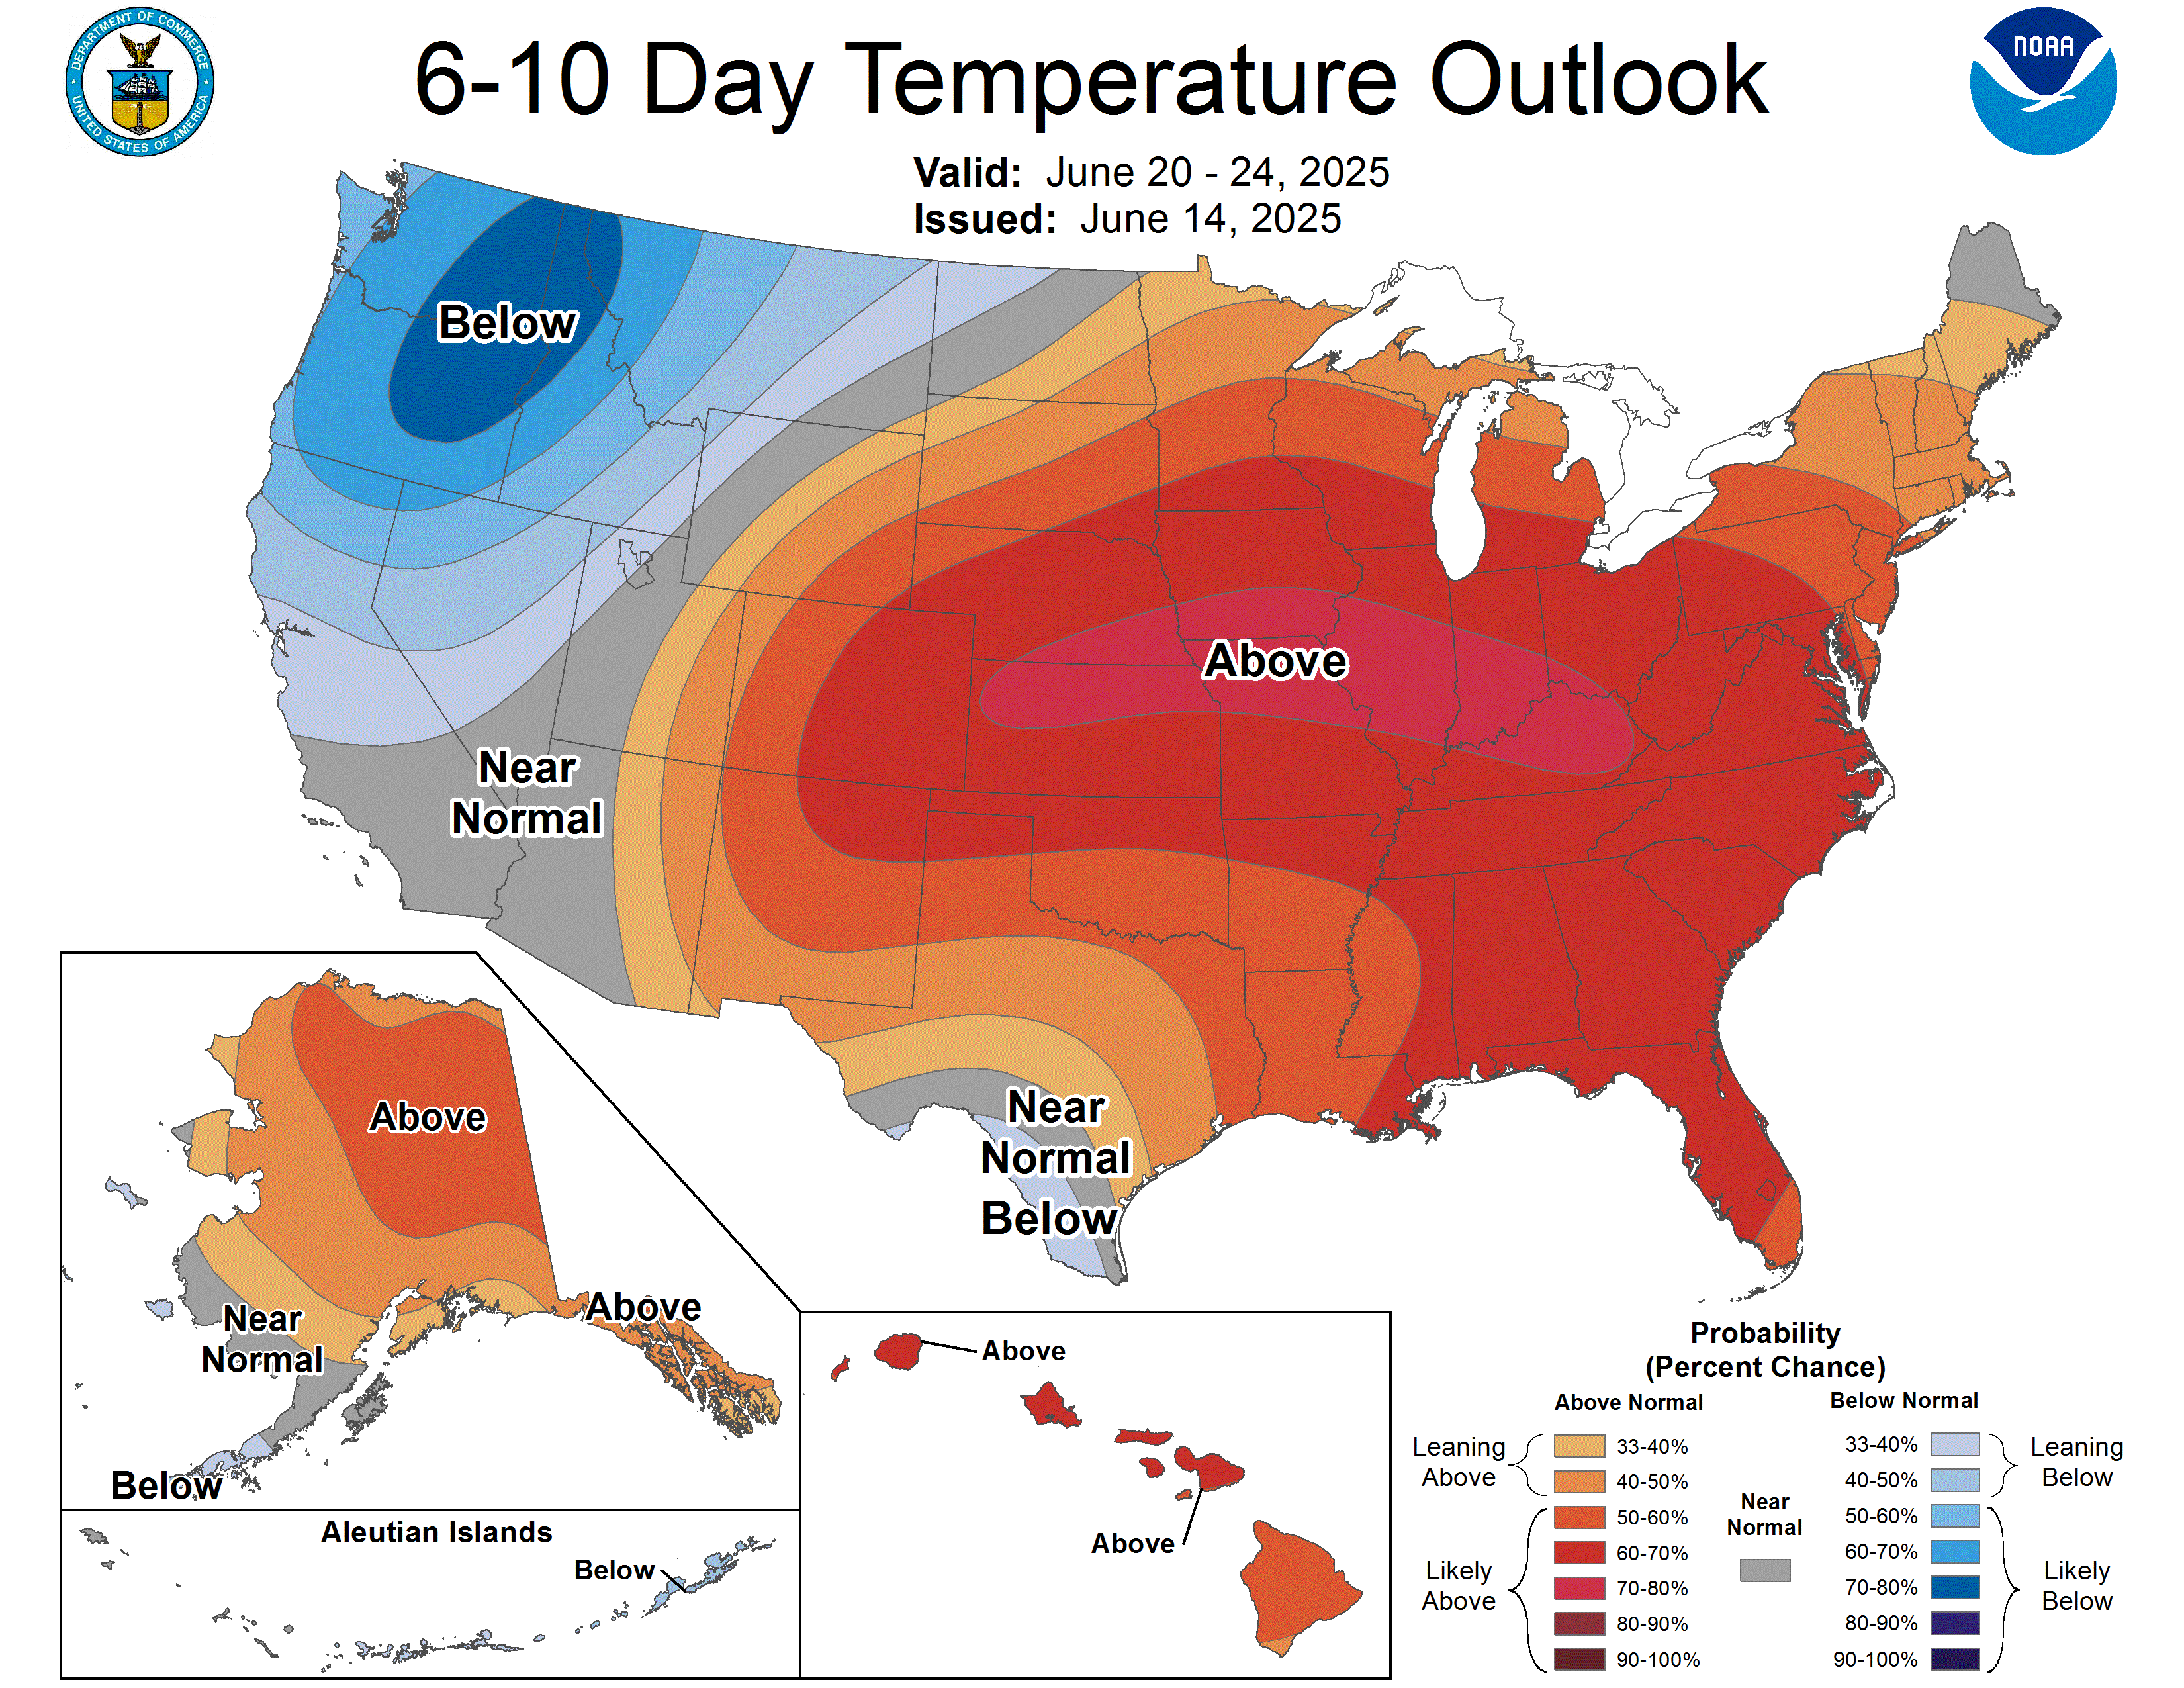
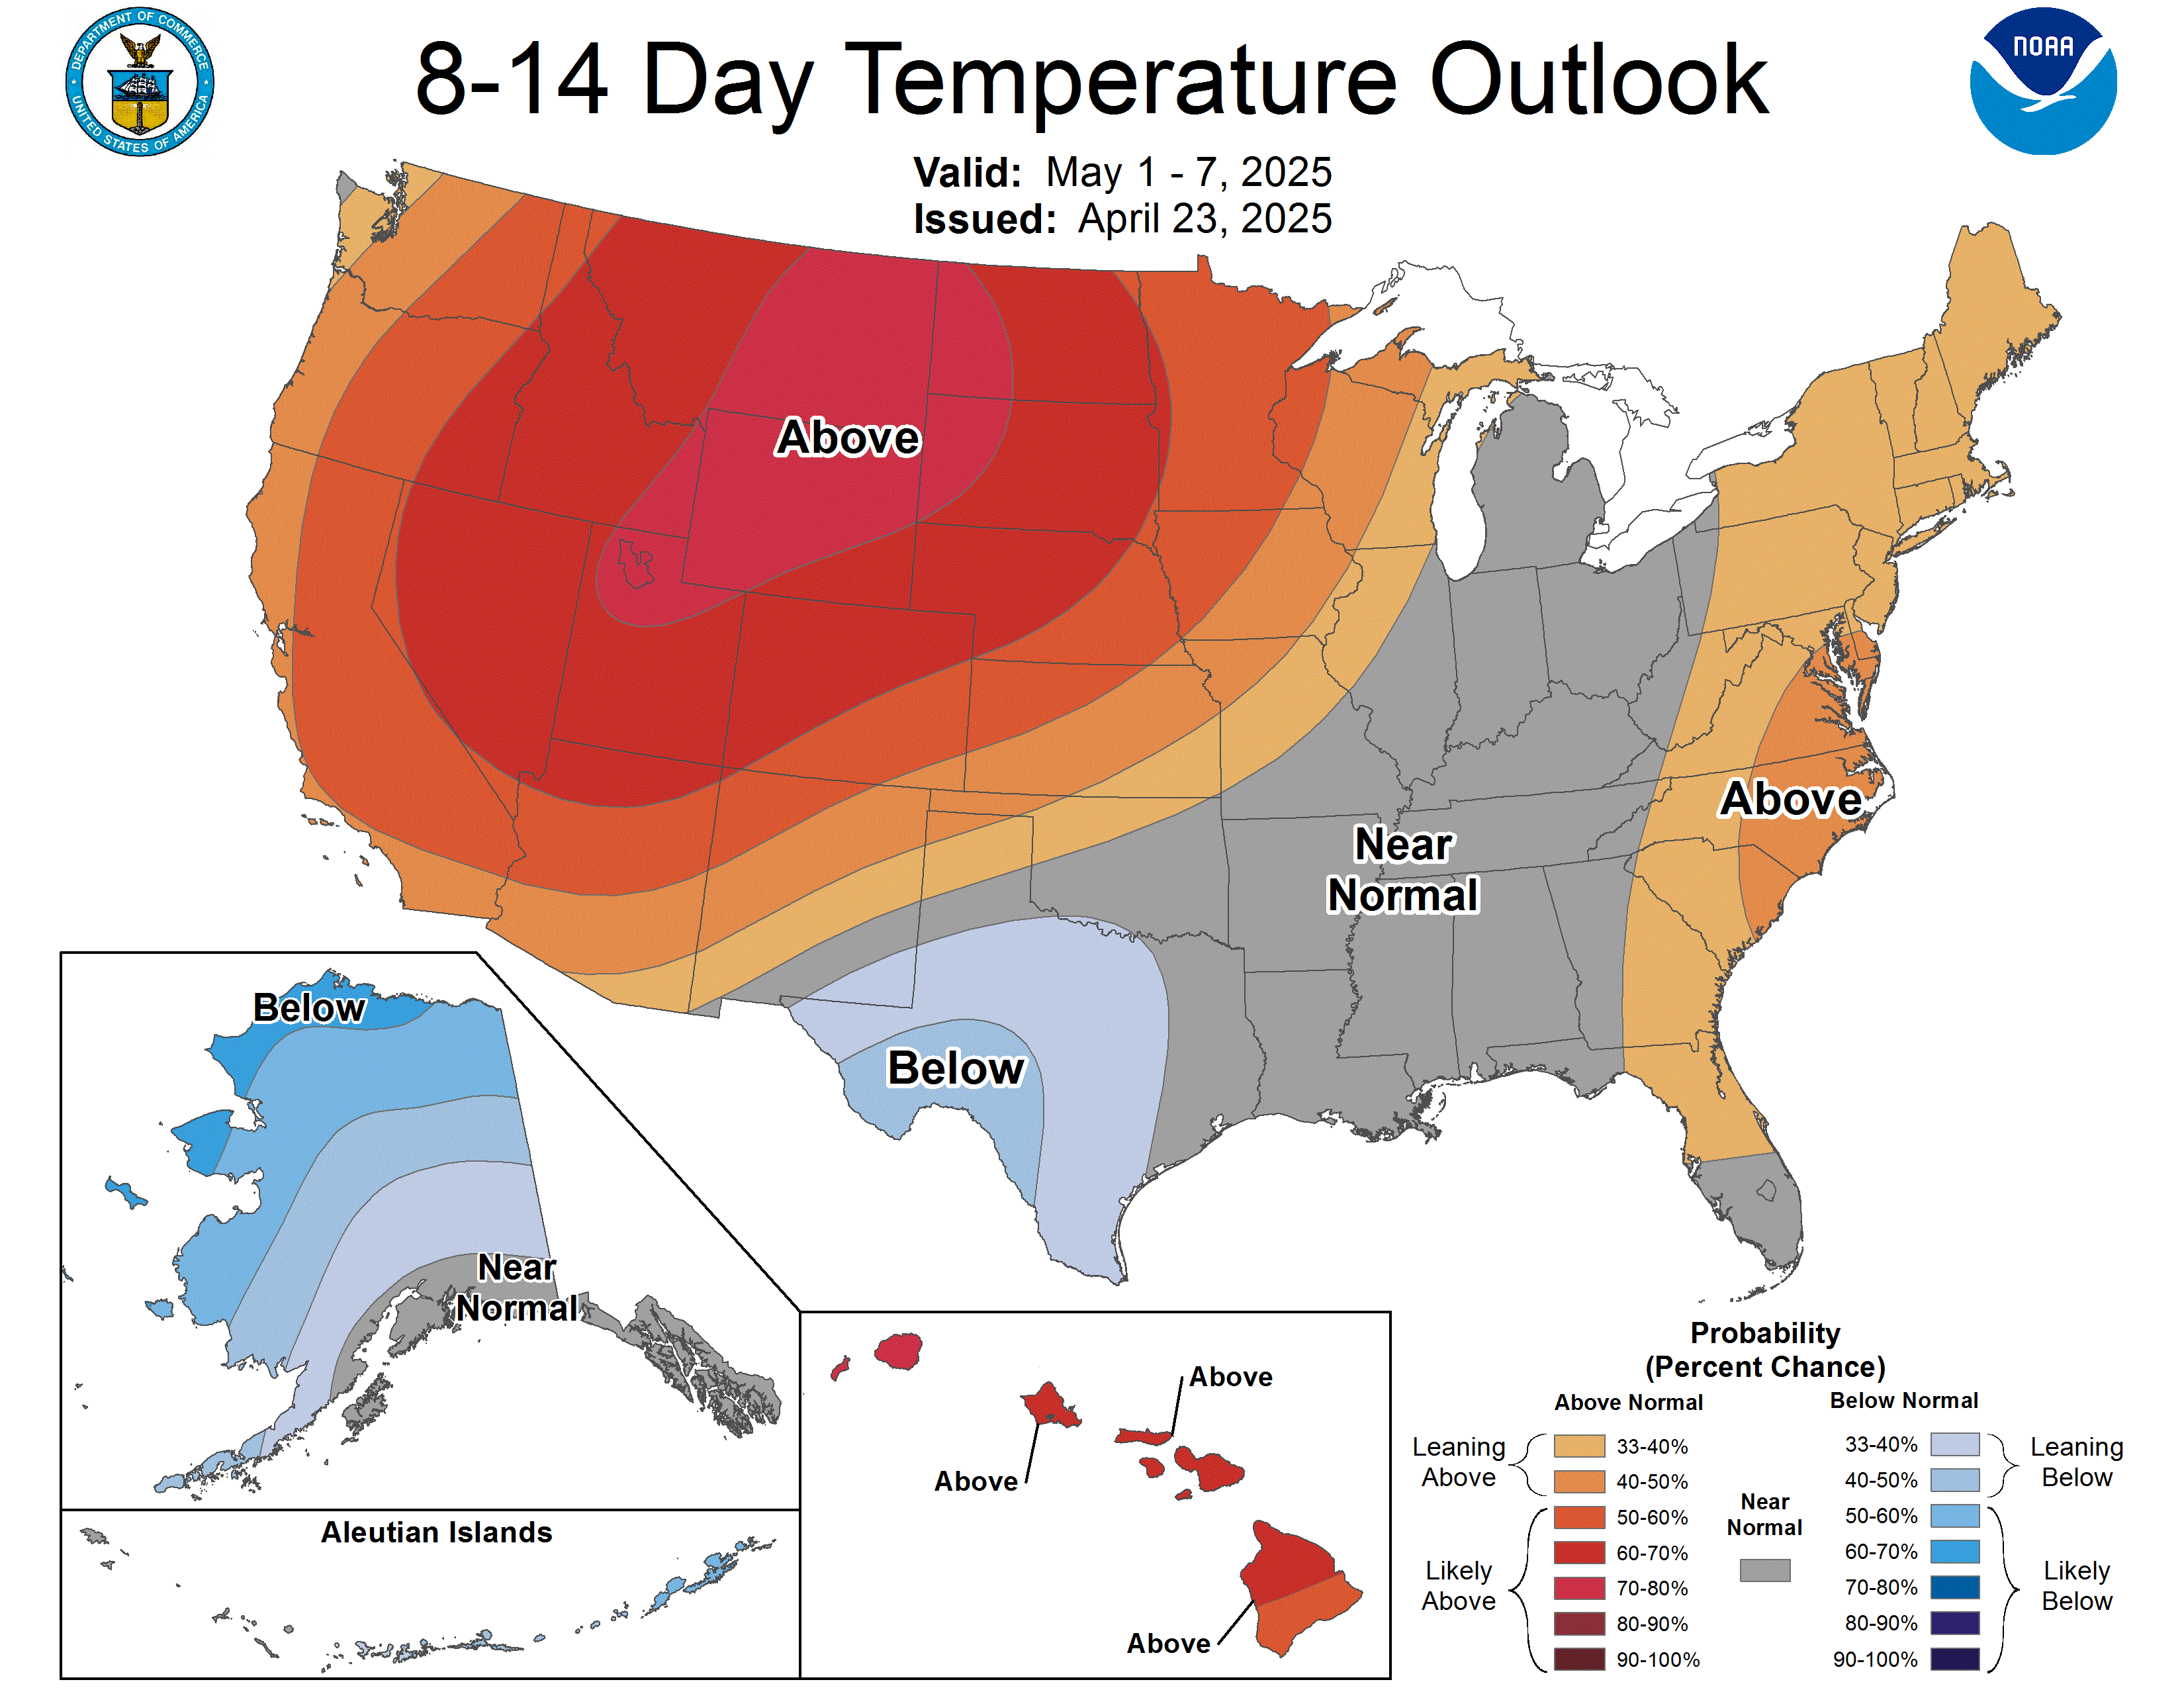
8 – 14 Day Temperature Outlook Issued Today (Note the NOAA Level of Confidence in the Forecast Released on January 2 was 4 out of 5)
Looking further out.
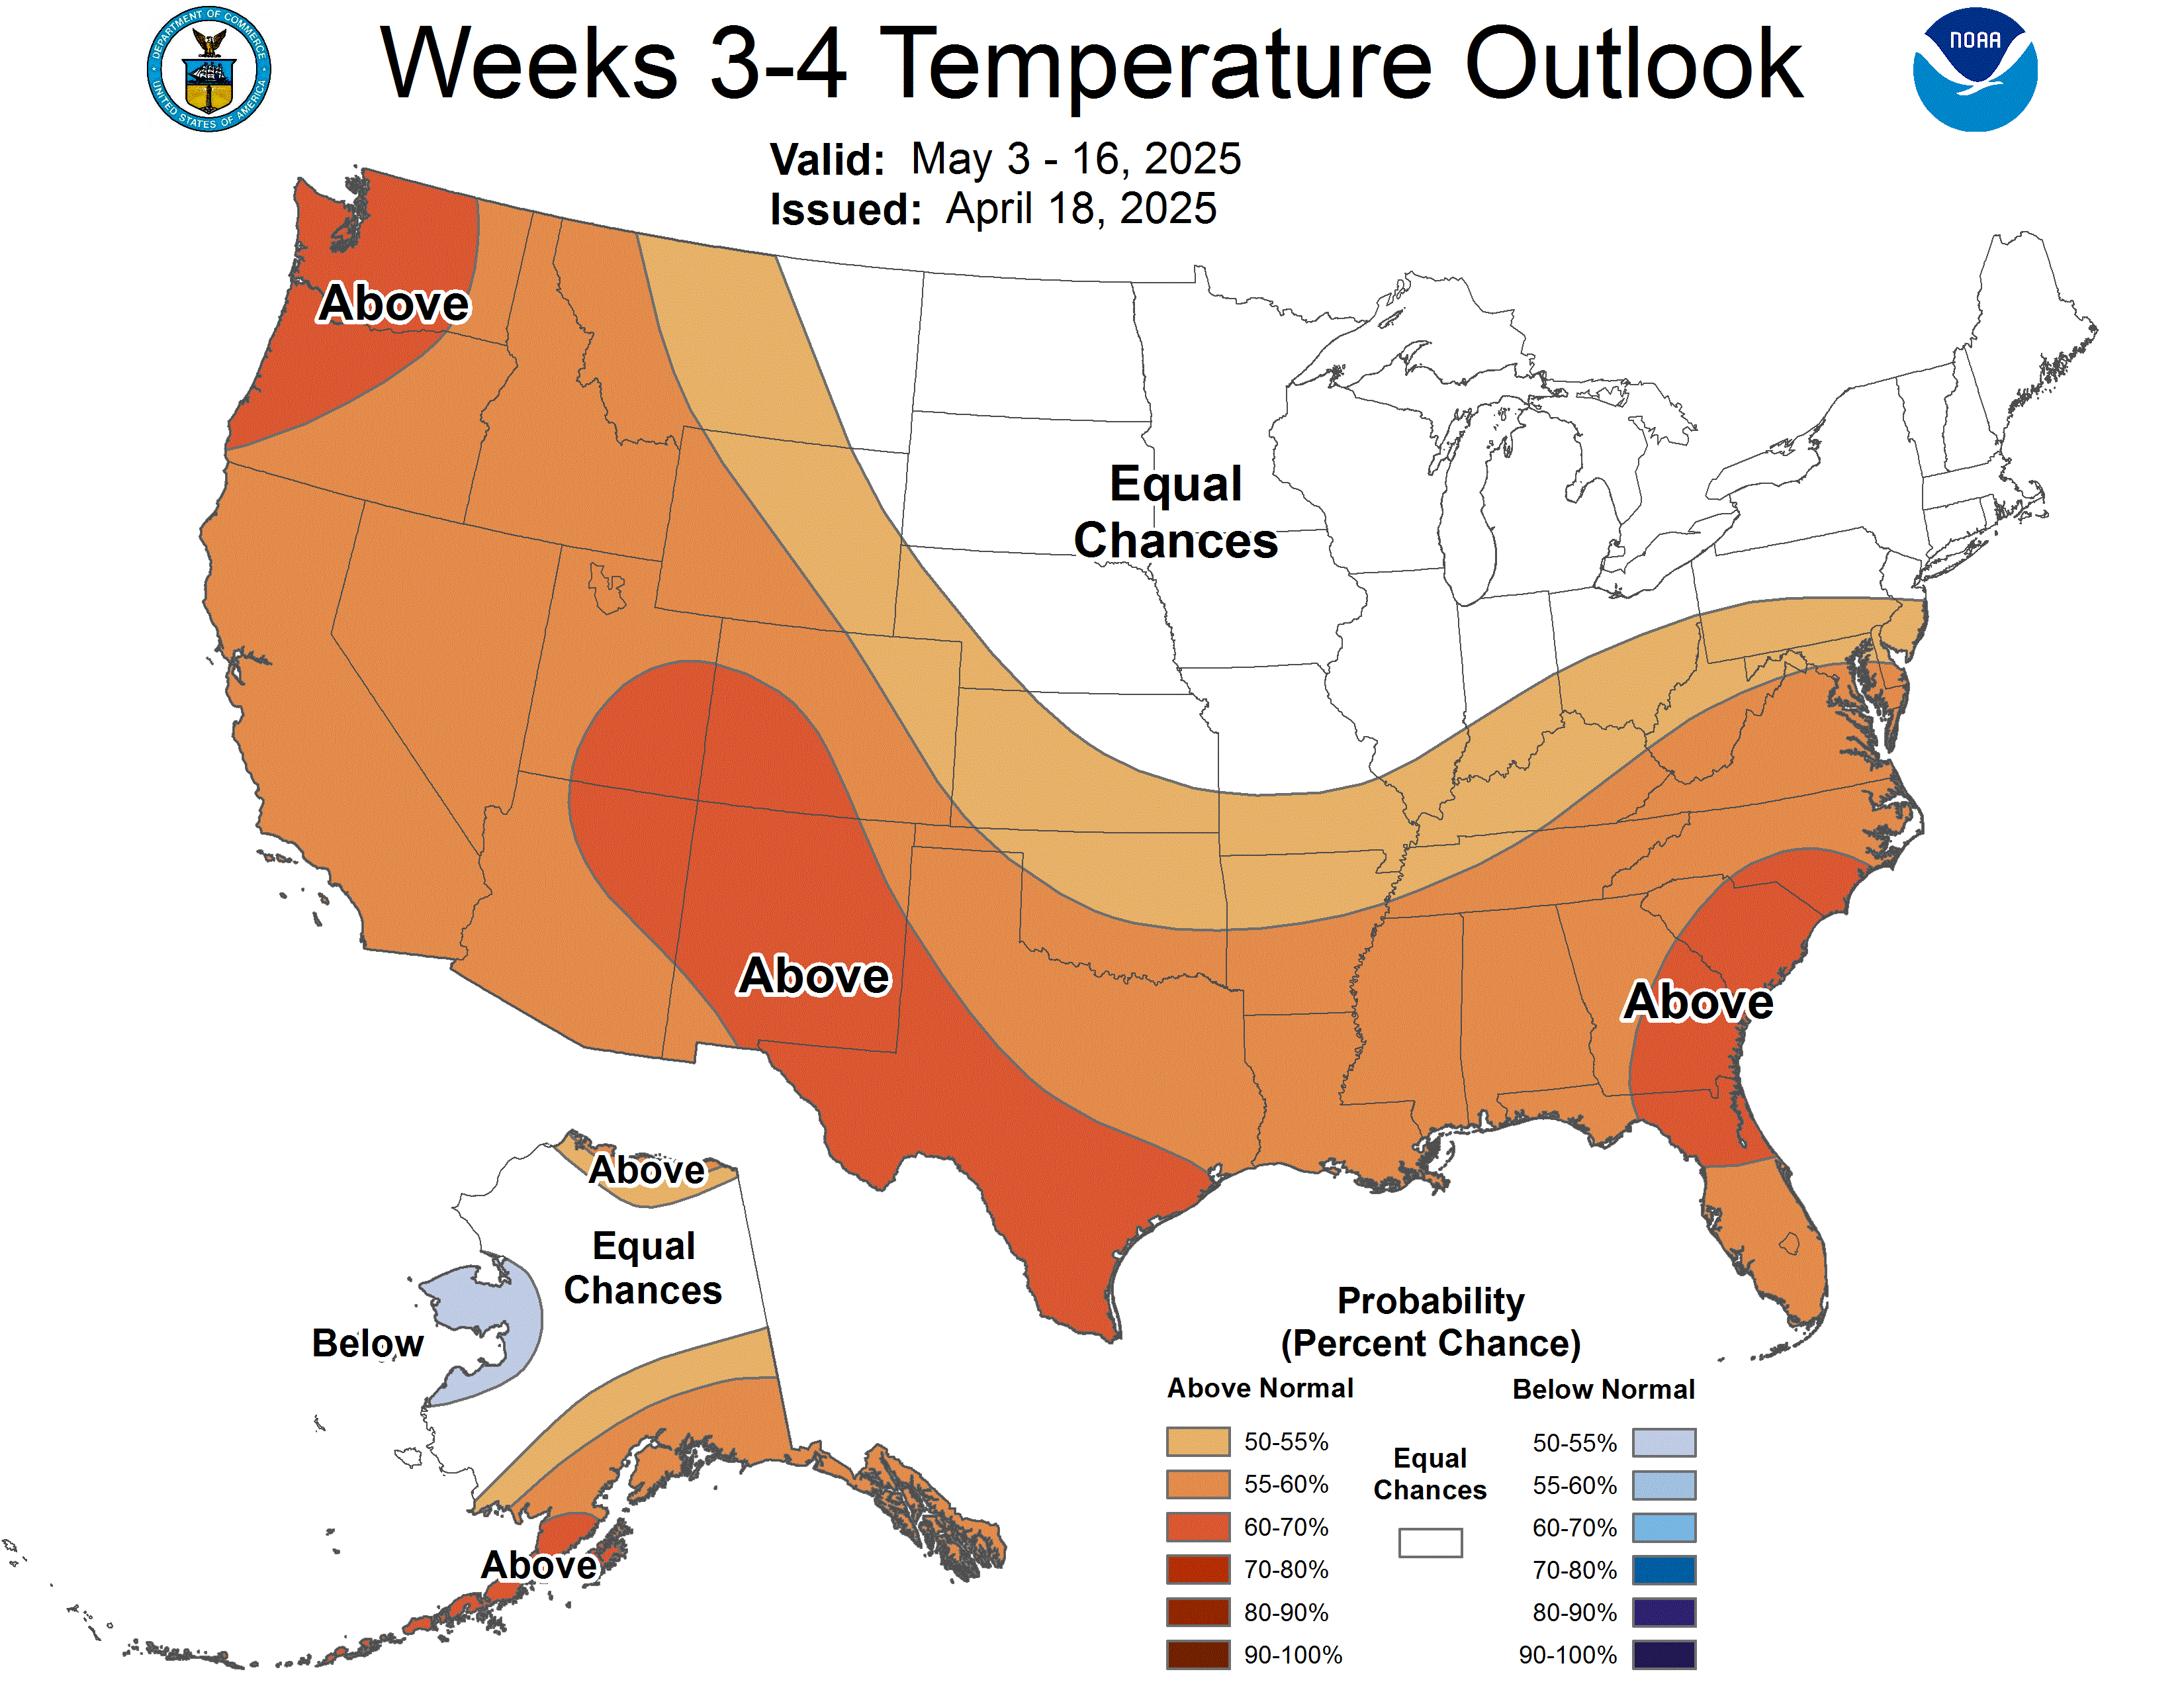
| January 8 to January 16 | January 14 to January 27 |
Alaska will be warm in the north and cool in the south, The Northwest will be cool. The Southwest will be warm and the East will start cool but evolve to EC. | Alaska will remain warm to the north and cool to the South and the Alaskan Panhandle. It will be warm from Southern California to Michigan and points east with a small Northwest cool anomaly and EC in between. The transition to the patterns shown in the Week 3 – 4 Forecast seems to be a smooth transition. |
| Remember the Week 3-4 Experimental Outlook was issued last Friday and I am looking at the 6 – 10 and 8 – 14 day forecasts issued today i.e. Monday. So that explains the overlap of dates. Remember that the Week 3 – 4 Forecast covers two weeks so it can appear to not mesh perfectly but actually do so over the two-week period. At this point it meshes fairly well. | |
Now – Precipitation
Here is the three-month JFM Precipitation Outlook issued on December 15, 2016 that I do not have much confidence in.

And here is the Updated Precipitation Outlook for January issued on December 31, 2016
6 – 10 Day Precipitation Outlook Issued Today (Note the NOAA Level of Confidence in the Forecast Released on January 2 was 4 out of 5)
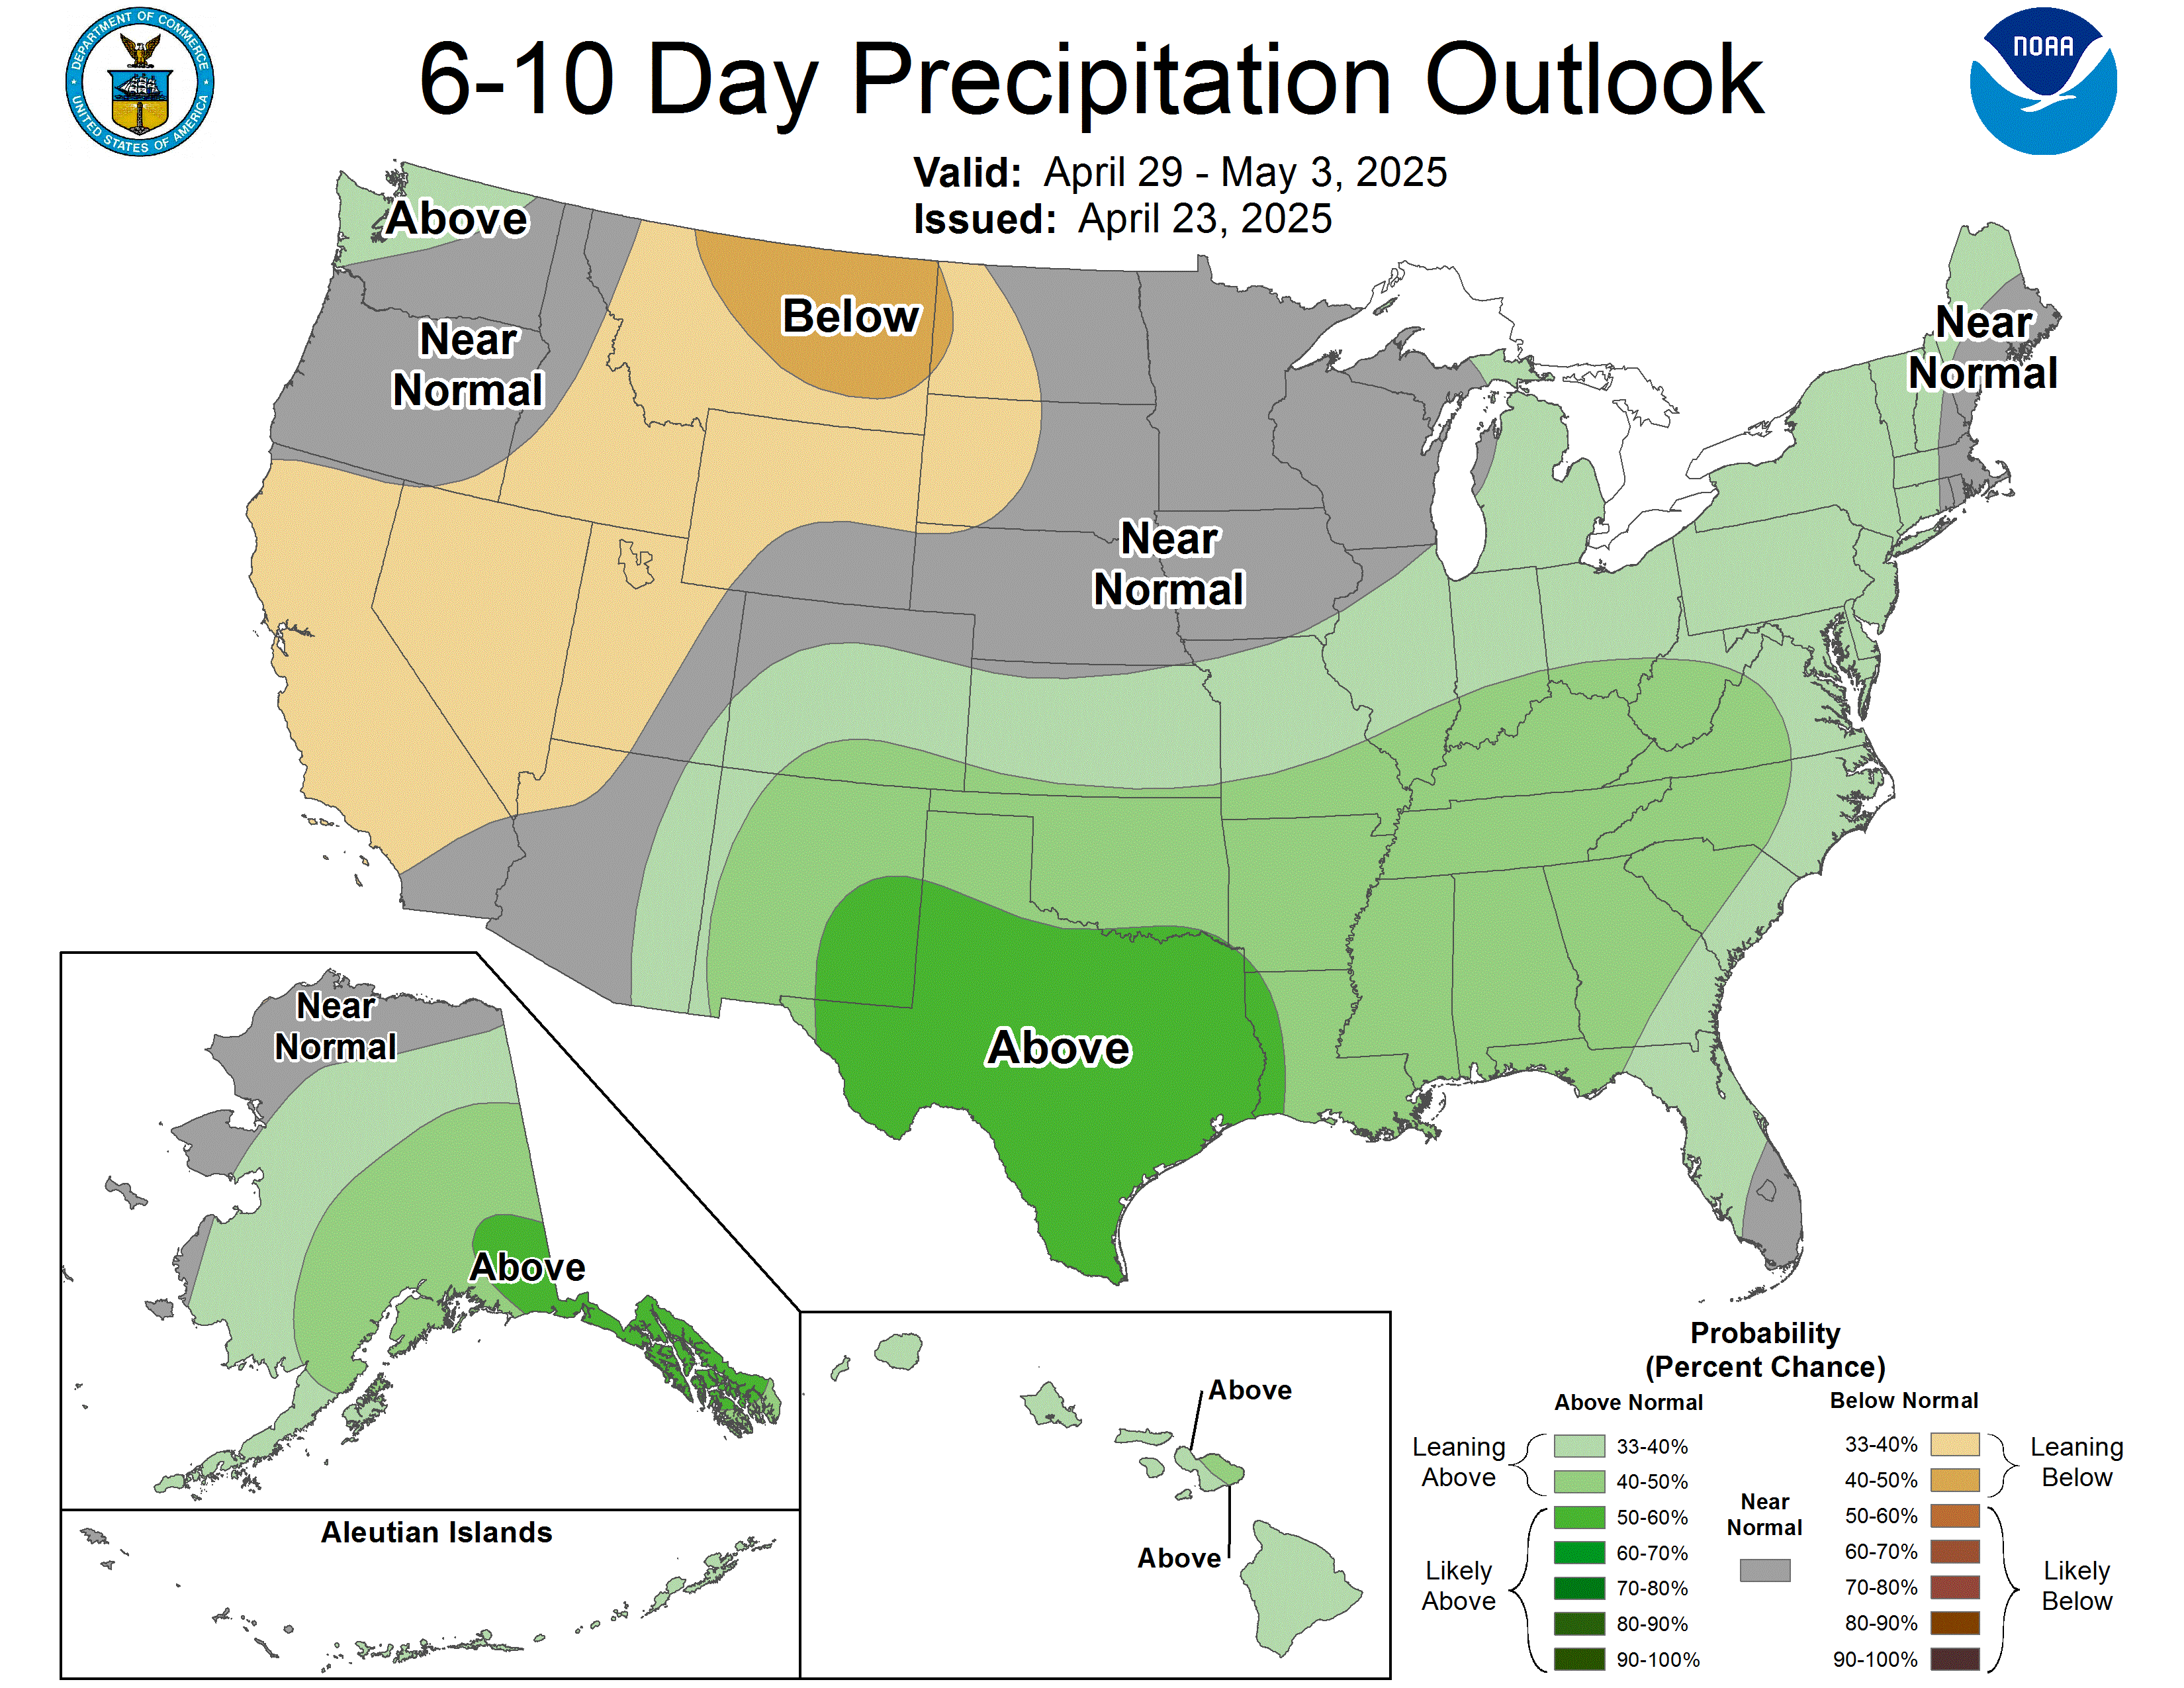
8 – 14 Day Precipitation Outlook Issued Today (Note the NOAA Level of Confidence in the Forecast Released on January 2 was 4 out of 5)
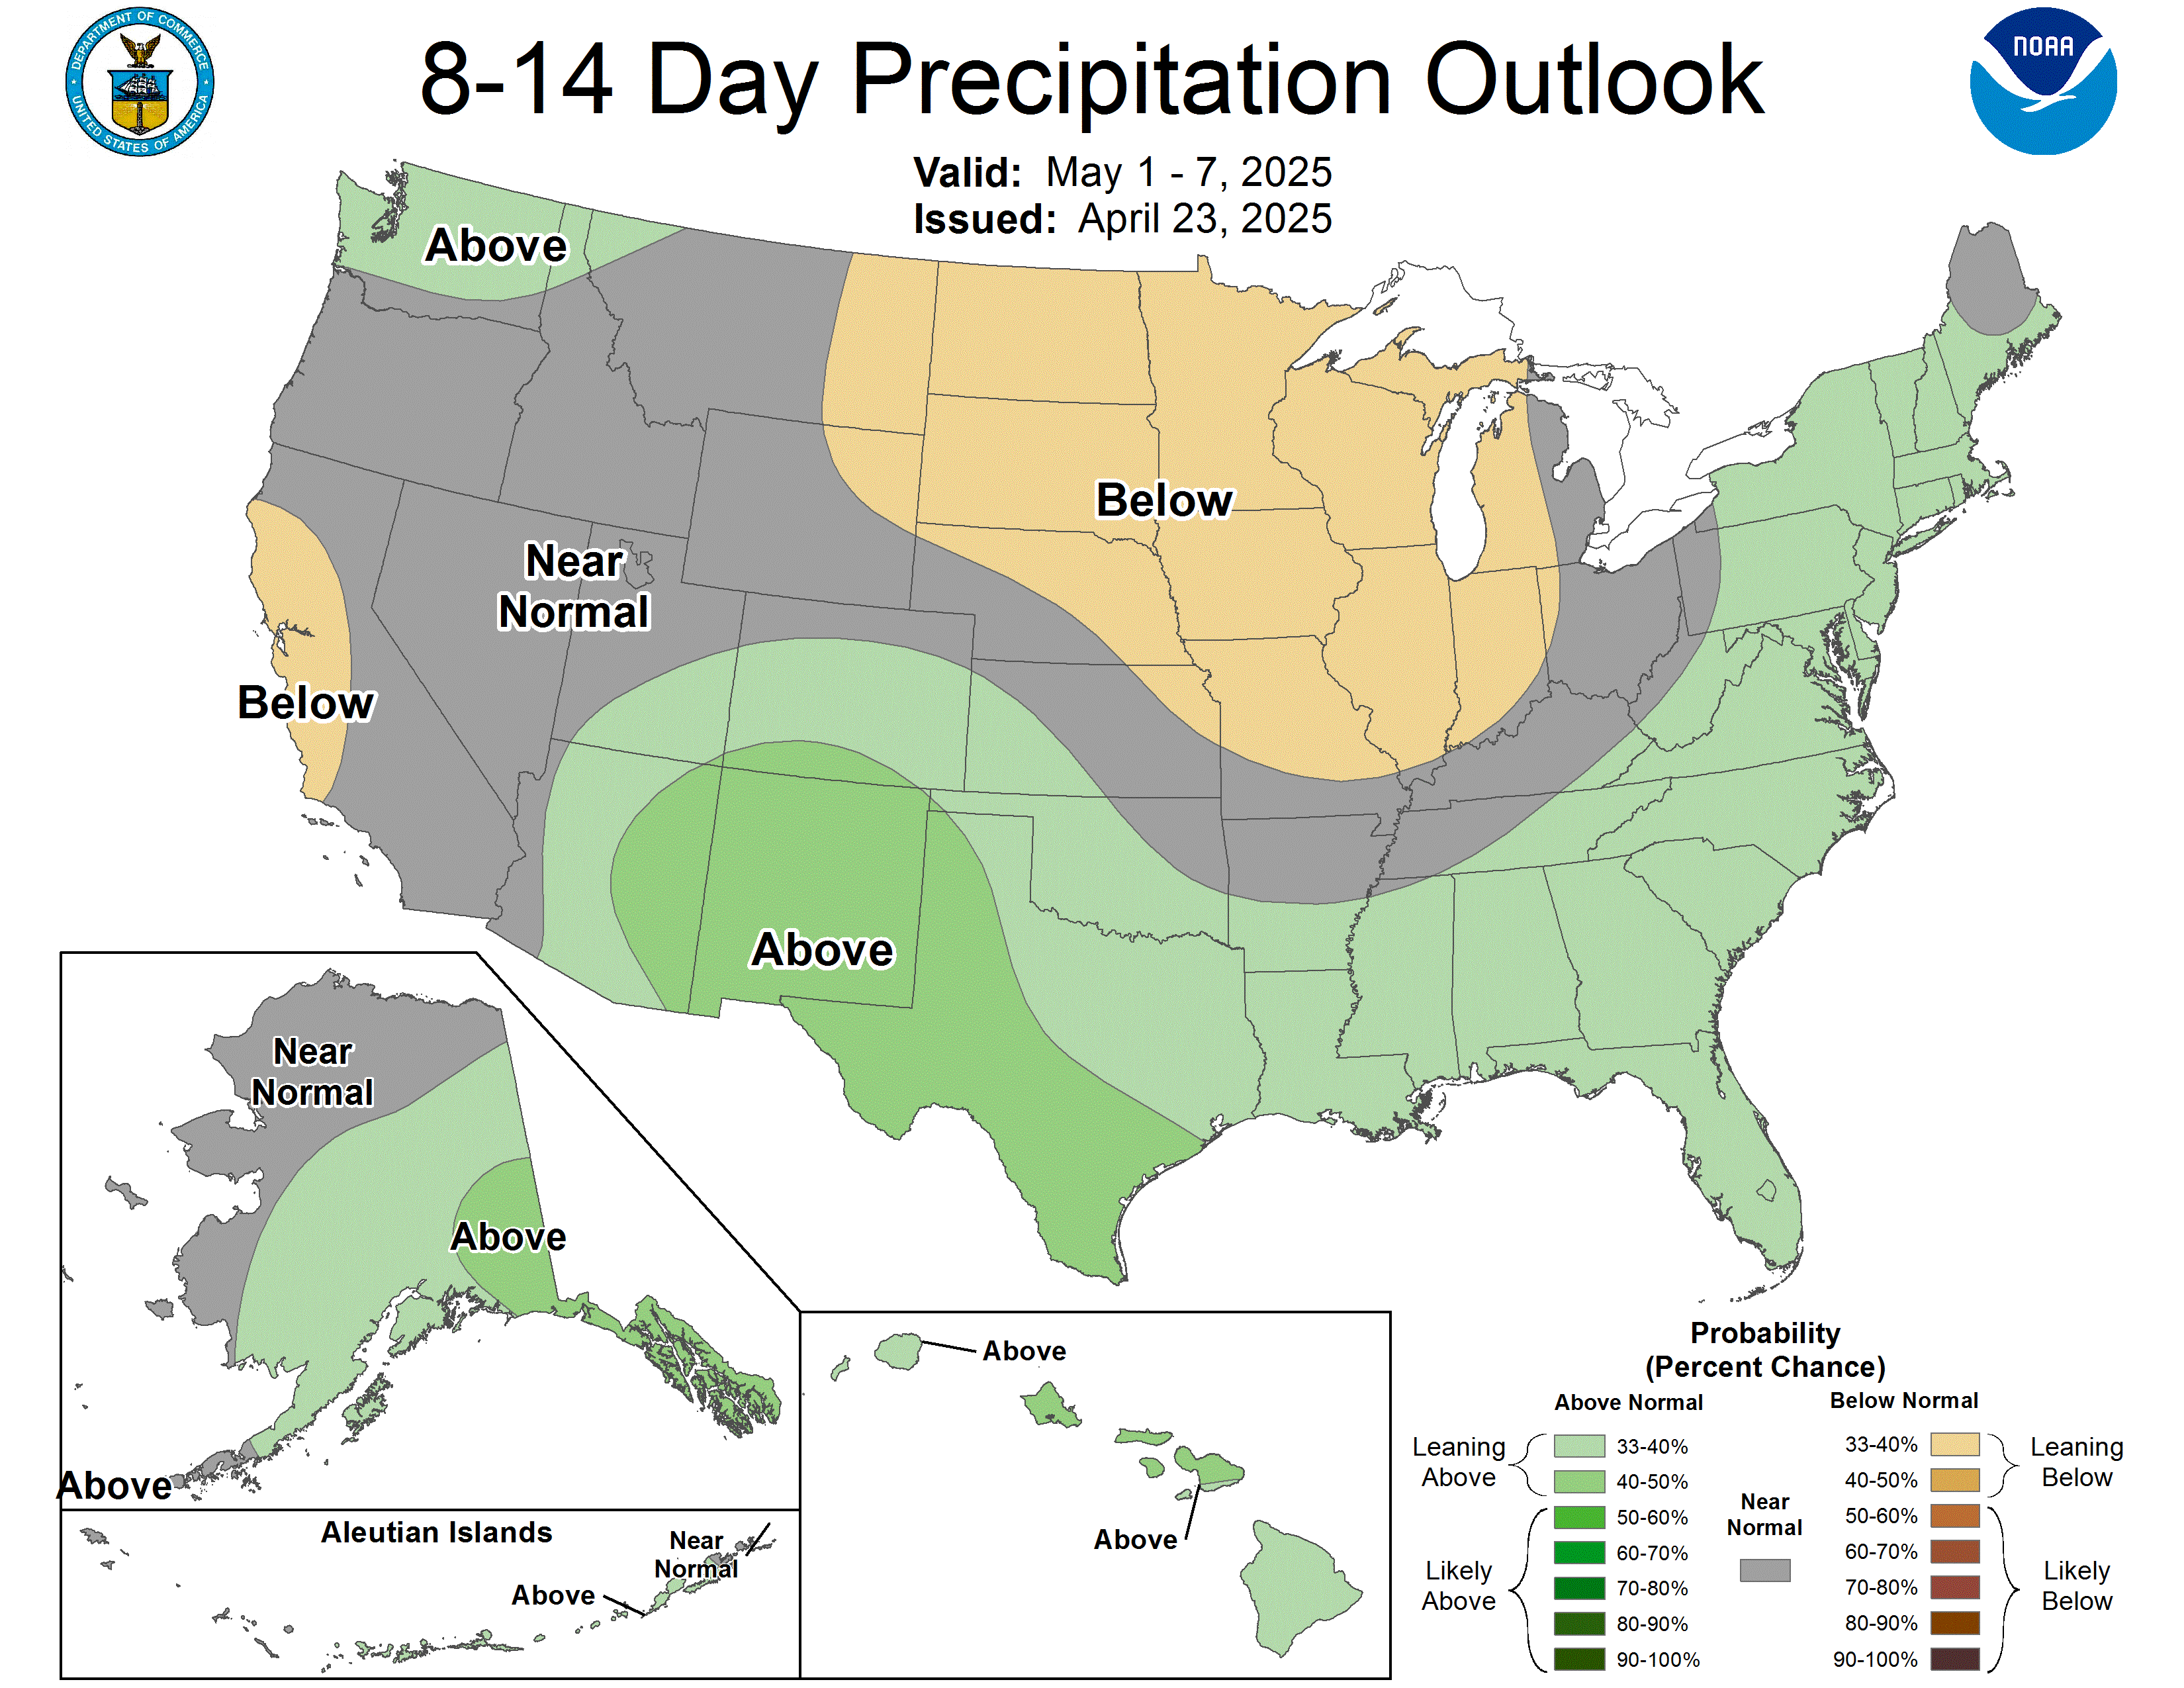
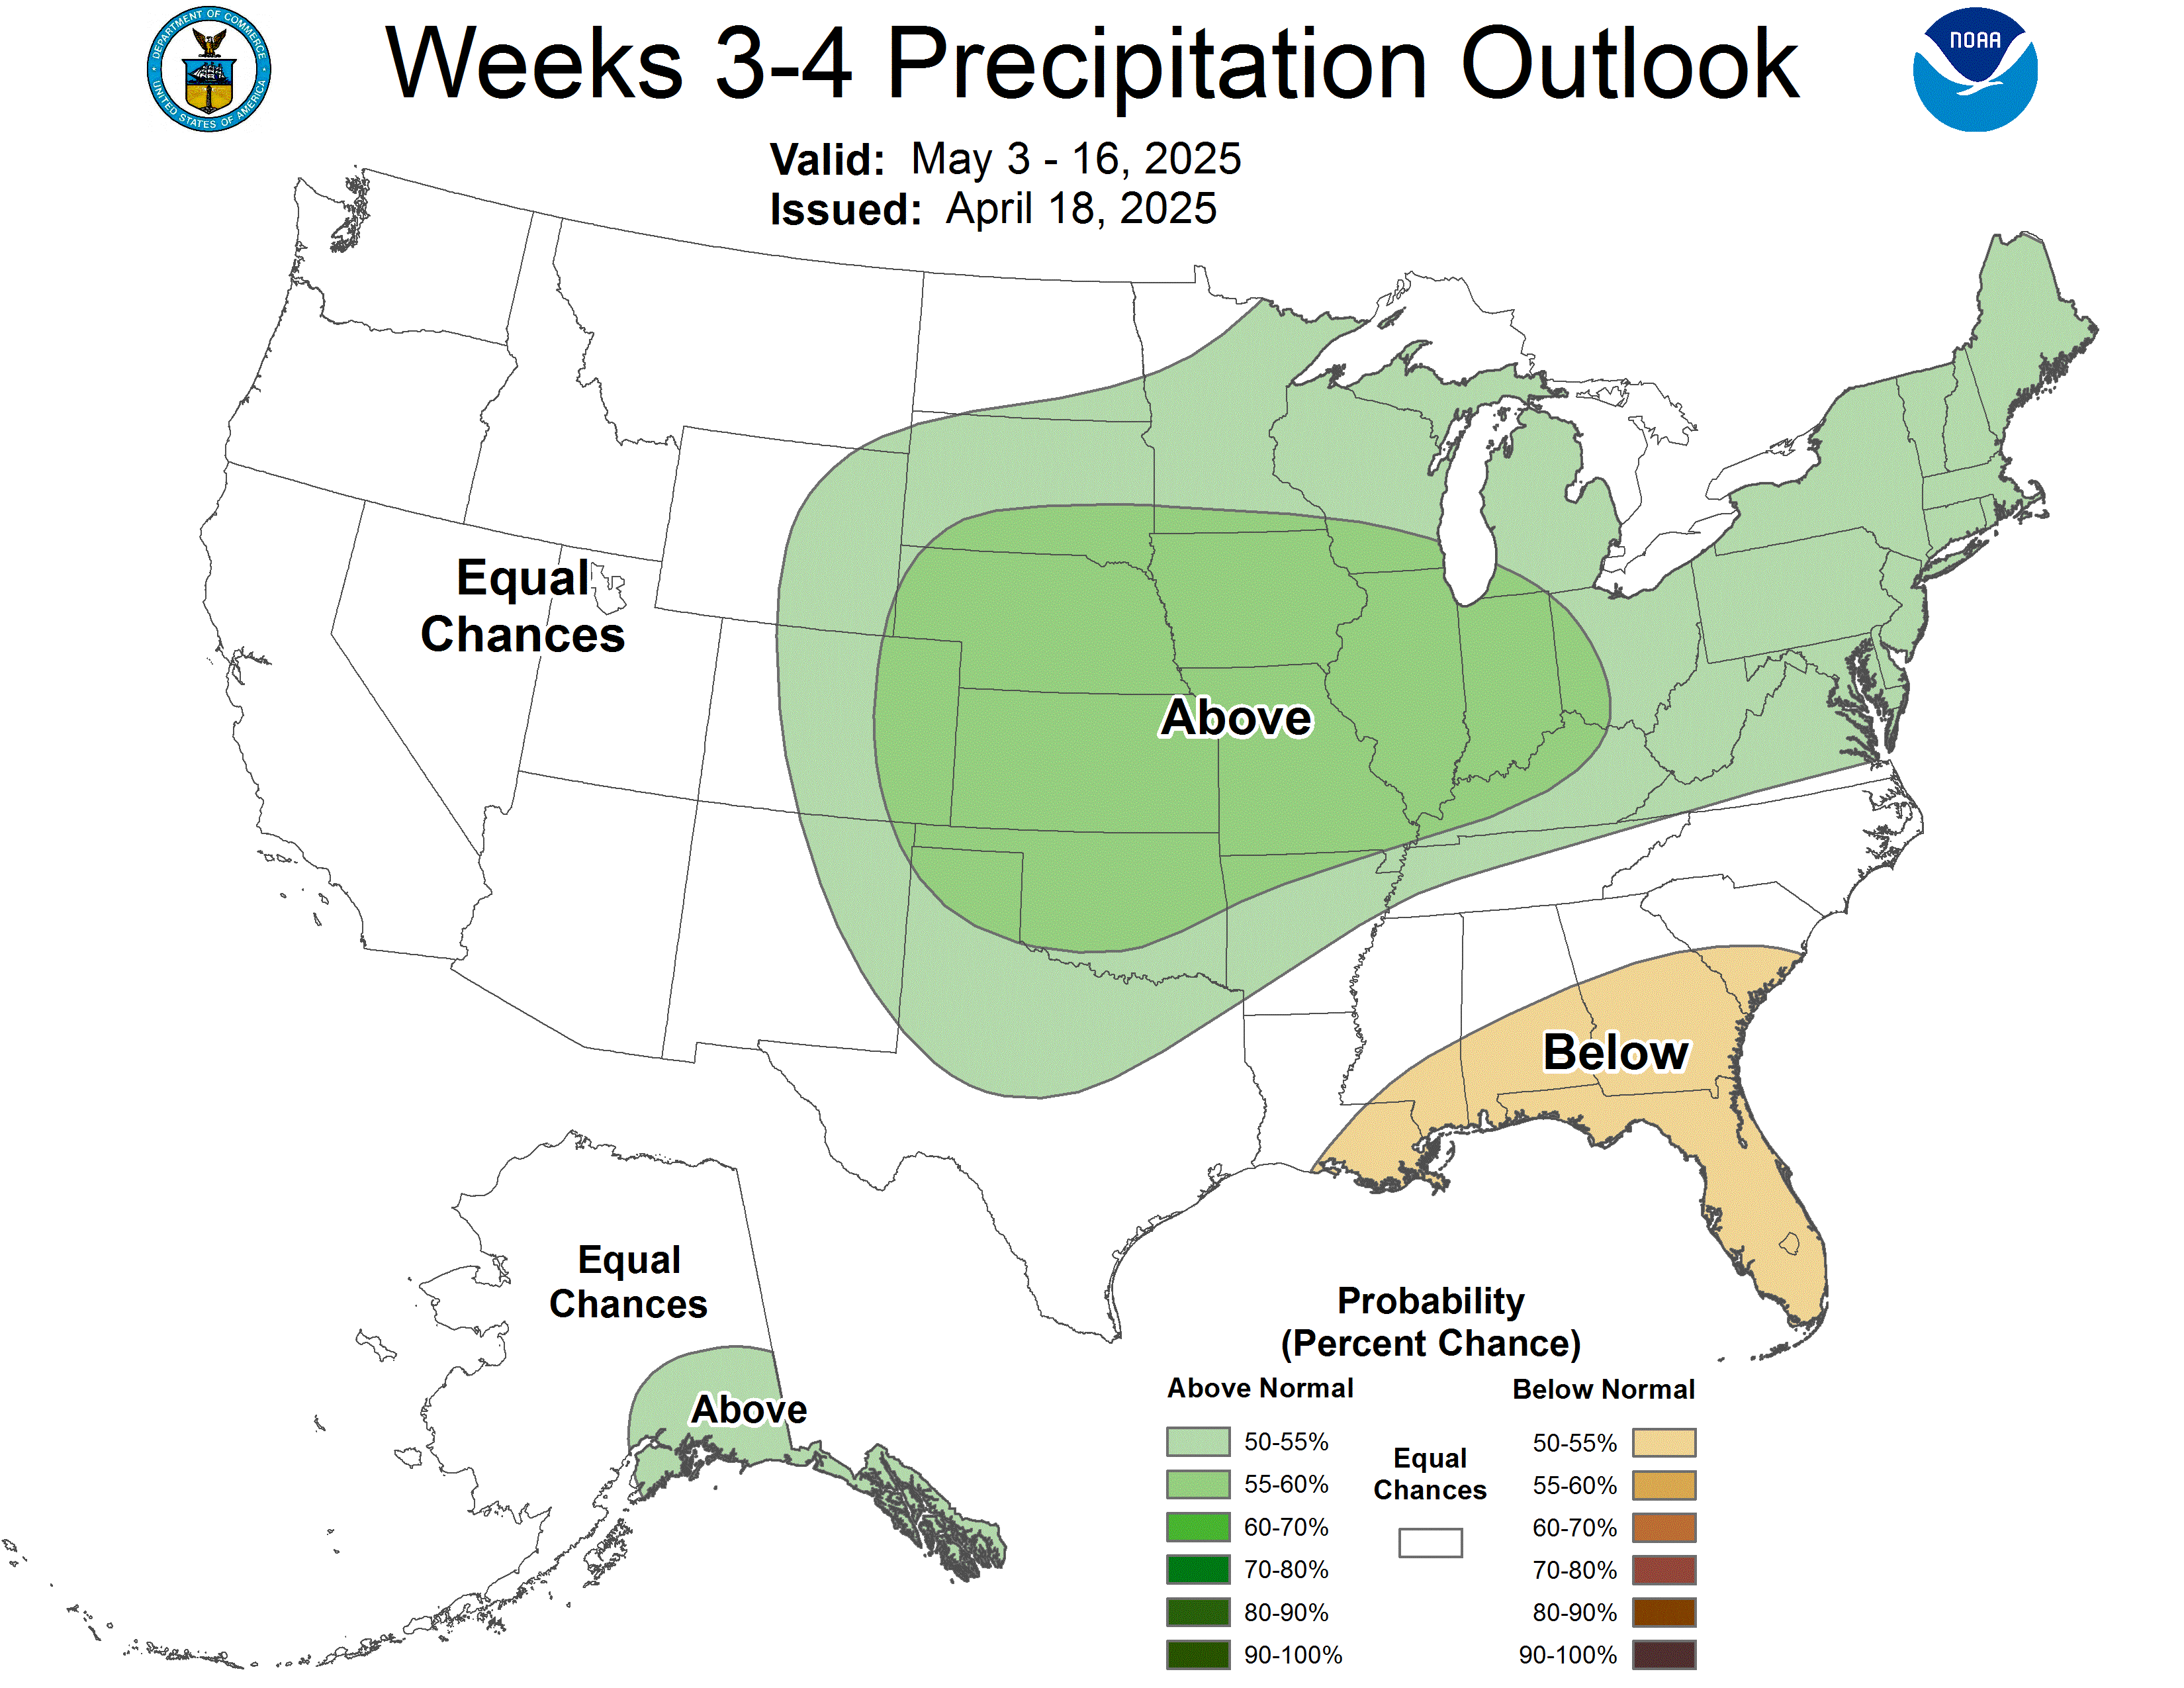
Looking further out.
 .
.
| January 8 to January 16 | January 14 to January 27, 2017 |
| Alaska is wet north and dry for the south coast and the Panhandle. CONUS is wet from California to Utah and wet but less so across the Northern Tier. There is a dry anomaly in Texas and Florida. Much of CONUS is wet and there is a well defined EC area between the wet and dry anomalies. | There are three dry anomalies shown: one for the Alaskan south coast, a second for Southern Arizona and Southwest New Mexico and a large Southeast dry anomaly. The Northwest is wet and there is a wet swath from Eastern Oklahoma northeast to Western Ohio. |
| Remember the Week 3 – 4 Experimental Outlook was issued last Friday and I am doing this analysis on Monday which explains the overlap in dates. | |
Here is the NOAA discussion released today January 2, 2017
6-10 DAY OUTLOOK FOR JAN 08 – 12 2017
TODAY’S NUMERICAL MODEL SOLUTIONS ARE IN GOOD AGREEMENT ON THE 500-HPA FLOW PATTERN PREDICTED OVER THE FORECAST DOMAIN. ALL OF TODAY’S MODELS PREDICT AN ANOMALOUSLY STRONG RIDGE CENTERED NEAR THE WEST COAST OF ALASKA, A POSITIVELY TILTED DOWNSTREAM TROUGH CENTERED ACROSS BRITISH COLUMBIA, A FLAT RIDGE ACROSS THE CONUS, AND ANOTHER TROUGH CENTERED NEAR THE EASTERN SEABOARD. ENSEMBLE SPREAD FOR THE CONUS IS LOW TO MODERATE, AS DEPICTED BY THE LATEST GFS, ECMWF, AND CANADIAN SPAGHETTI MAPS. THOUGH TODAY’S SOLUTIONS ARE ALL IN GOOD AGREEMENT, THE 0Z ECWMF ENSEMBLE MEAN WAS FAVORED, SINCE IT HAS SLIGHTLY OUTPERFORMED THE OTHER MODEL SOLUTIONS DURING THE PAST 60 DAYS ACROSS THE FORECAST DOMAIN.
ABOVE-NORMAL TEMPERATURES ARE FAVORED OVER APPROXIMATELY THE SOUTHERN HALF OF CALIFORNIA, CENTRAL AND SOUTHERN PORTIONS OF BOTH THE INTERMOUNTAIN REGION AND THE ROCKIES, THE SOUTHERN GREAT PLAINS, LOUISIANA, AND OVER WESTERN AND NORTHERN PARTS OF ALASKA. THIS IS ATTRIBUTED TO A COMBINATION OF FACTORS, SUCH AS 500-HPA RIDGING AND/OR ABOVE-NORMAL 500-HPA HEIGHTS, AREAS AHEAD OF AN EXPECTED TROUGH, AND AREAS OF AGREEMENT BETWEEN A VARIETY OF DYNAMICAL TOOLS.BELOW-NORMAL TEMPERATURES ARE FAVORED OVER SOUTHEASTERN ALASKA INCLUDING THE PANHANDLE, FROM THE PACIFIC NORTHWEST AND NORTHERN CALIFORNIA EASTWARD ACROSS THE NORTHERN ROCKIES AND NORTHERN PLAINS TO THE UPPER MISSISSIPPI VALLEY REGION, AND ALONG THE ATLANTIC COAST FROM MAINE TO NORTHERN FLORIDA. THIS IS DUE TO A COMBINATION OF FACTORS, SUCH AS NORTHERLY ANOMALOUS FLOW AND/OR BELOW-NORMAL 500-HPA HEIGHTS, AREAS BEHIND A MID-LEVEL TROUGH, AND AREAS OF AGREEMENT BETWEEN A VARIETY OF DYNAMICAL TOOLS.
ABOVE-MEDIAN PRECIPITATION IS FAVORED FOR MOST AREAS WEST OF THE CONTINENTAL DIVIDE, FOR MOST OF THE ROCKIES, THE NORTHERN AND PORTIONS OF THE CENTRAL PLAINS, MOST OF THE MISSISSIPPI VALLEY, THE GREAT LAKES REGION, THE OHIO AND TENNESSEE VALLEYS, AND THE NORTH SLOPE OF ALASKA. THIS IS ATTRIBUTED TO A COMBINATION OF FACTORS, SUCH AS ONSHORE FLOW, BROAD AREAS OUT AHEAD OF A MAJOR MID-LEVEL TROUGH, AND IN THE GENERAL VICINITY OF THE MEAN STORM TRACK. BELOW-MEDIAN PRECIPITATION IS FAVORED FOR APPROXIMATELY THE SOUTHERN HALF OF ALASKA, THE SOUTHERN GREAT PLAINS, AND ACROSS THE GULF COAST AND SOUTHERN ATLANTIC COAST REGIONS. THIS IS DUE TO A COMBINATION OF FACTORS, SUCH AS DRY NORTHERLY ANOMALOUS FLOW, WEAK 500-HPA RIDGING AND ASSOCIATED ABOVE-NORMAL HEIGHTS, AND SUFFICIENT DISTANCE FROM THE MEAN STORM TRACK.
FORECAST CONFIDENCE FOR THE 6-10 DAY PERIOD: ABOVE AVERAGE, 4 OUT OF 5, DUE TO GOOD AGREEMENT AMONG THE MODEL SOLUTIONS AND THE VARIOUS SURFACE TOOLS, AND A HIGH-AMPLITUDE PATTERN FORECAST ACROSS ALASKA, BUT OFFSET SOMEWHAT FROM EXPECTED LOW-AMPLITUDE FLOW ACROSS THE LOWER 48 STATES.
8-14 DAY OUTLOOK FOR JAN 10 – 16 2017
THE ENSEMBLE MEANS ARE GENERALLY IN GOOD AGREEMENT FOR THE WEEK-2 PERIOD, THOUGH THEY FORECAST A SLIGHT WESTWARD SHIFT IN THE LOCATION OF THE RIDGE IN FAR WESTERN ALASKA (COMPARED TO DAYS 6-10). SIGNIFICANT DIFFERENCES APPEAR IN THE 0Z AND 6Z OPERATIONAL GFS SOLUTIONS, PRIMARILY AT HIGH LATITUDES. THESE TWO RUNS PREDICT THE RIDGE WILL SHIFT EVEN FARTHER WEST, ALLOWING A TROUGH (AND BELOW-NORMAL 500-HPA HEIGHTS) TO ENVELOP THE ENTIRE ALASKA MAINLAND. THE OPERATIONAL 0Z GFS SOLUTION ALSO FORECASTS BELOW-NORMAL HEIGHTS OVER MOST OF THE CONTIGUOUS U.S., SUBSTANTIALLY MORE THAN ALL OTHER MODEL SOLUTIONS.
THE SURFACE TEMPERATURE AND PRECIPITATION FORECASTS FOR WEEK-2 ARE SIMILAR TO THOSE PREDICTED FOR DAYS 6-10, WITH ONLY RELATIVELY SMALL ADJUSTMENTS MADE. FOR TEMPERATURE, A WESTWARD SHIFT IN THE ANOMALY PATTERN IS ANTICIPATED ACROSS ALASKA, TO BE CONSISTENT WITH THE EXPECTED RETROGRESSION OF A 500-HPA RIDGE ACROSS THE BERING SEA. TEMPERATURES ARE ALSO PREDICTED TO MODERATE BY ONE CATEGORY ACROSS MUCH OF THE EASTERN THIRD OF THE CONUS. ABOVE MEDIAN PRECIPITATION OVER THE MIDWEST AND OHIO VALLEY DURING THE 6-10 DAY PERIOD IS FORECAST TO CONTINUE EASTWARD ACROSS THE NORTHEAST AND MID-ATLANTIC DURING WEEK-2.
FORECAST CONFIDENCE FOR THE 8-14 DAY PERIOD IS: ABOVE AVERAGE, 4 OUT OF 5, DUE TO GOOD AGREEMENT AMONG THE ENSEMBLE MEANS AND ASSORTED SURFACE TOOLS, BUT OFFSET BY SUBSTANTIAL DIFFERENCES BETWEEN THE THREE LATEST OPERATIONAL GFS RUNS (0Z, 6Z, AND 12Z INTEGRATIONS).
THE NEXT SET OF LONG-LEAD MONTHLY AND SEASONAL OUTLOOKS WILL BE RELEASED ON JANUARY 19
Some might find this analysis click to read interesting as the organization which prepares it focuses on the Pacific Ocean and looks at things from a very detailed perspective and their analysis provides a lot of information on the history and evolution of ENSO events.
Analogs to the Outlook.
Now let us take a detailed look at the “Analogs” which NOAA provides related to the 5 day period centered on 3 days ago and the 7 day period centered on 4 days ago. “Analog” means that the weather pattern then resembles the recent weather pattern and was used in some way to predict the 6 – 14 day Outlook.
Here are today’s analogs in chronological order although this information is also available with the analog dates listed by the level of correlation. I find the chronological order easier for me to work with. There is a second set of analogs associated with the Outlook but I have not been regularly analyzing this second set of information. The first set which is what I am using today applies to the 5 and 7 day observed pattern prior to today. The second set, which I am not using, relates to the correlation of the forecasted outlook 6 – 10 days out with similar patterns that have occurred in the past during the dates covered by the 6 – 10 Day Outlook. The second set of analogs may also be useful information but they put the first set of analogs in the discussion with the second set available by a link so I am assuming that the first set of analogs is the most meaningful and I find it so.
Day | ENSO Phase | PDO | AMO | Other Comments |
| Dec 29, 1951 | El Nino | – | + | |
| Jan 14, 1954 | El Nino | – | + | Tail End |
| Jan 12, 1957 | Neutral | – | – | |
| Jan 13, 1957 | Neutral | – | – | |
| Jan 14, 1962 | Neutral | – | + | |
| Jan 4, 1968 | La Nina | – | + | |
| Jan 5, 1968 | La Nina | – | + | |
| Dec 20, 1970 | El Nino | – | – | Tail End |
| Jan 5, 1970 | Neutral | + | – |
(t) = a month where the Ocean Cycle Index has just changed or does change the following month.
One thing that jumped out at me right away was the spread among the analogs from December 20 to January 14 which is 25 days which is a lot tighter than last week. I have not calculated the centroid of this distribution which would be the better way to look at things but the midpoint, which is a lot easier to calculate, is about January 2. These analogs are centered on 3 days and 4 days ago (December 28 or December 29). So the analogs could be considered a bit out of sync with the calendar meaning that we will be getting weather that normally would occur three or four days later in a normal year. Does this mean we are headed for an early Sprint. It is way too soon to tell.
For more information on Analogs see discussion in the GEI Weather Page Glossary.
There are three El Nino Analogs (why are there any?), just two La Nina Analogs and three ENSO Neutral Analogs. Looks like the analogs are suggesting that ENSO Neutral Conditions Apply. The phase of the ocean cycles in the analogs points strongly towards McCabe Condition D and to a lesser extent McCabe Condition B. These are opposites and may not support the level of confidence that NOAA has in their 6 – 14 Day Forecasts. All but one of the analogs is associated with PDO Negative which I believe is the pattern in the Pacific right now. It is curious that all of the analogs are prior to the 1997/1998 Climate Shift in the Pacific and all but one are prior to the 1976/1977 Climate Shift in the Pacific. I have not had the time to try to see if that tells us anything.
The seminal work on the impact of the PDO and AMO on U.S. climate can be found here. Water Planners might usefully pay attention to the low-frequency cycles such as the AMO and the PDO as the media tends to focus on the current and short-term forecasts to the exclusion of what we can reasonably anticipate over multi-decadal periods of time. One of the major reasons that I write this weather and climate column is to encourage a more long-term and World view of weather.

| McCabe Condition | Main Characteristics |
| A | Very Little Drought. Southern Tier and Northern Tier from Dakotas East Wet |
| B | More wet than dry but Great Plains Dry |
| C | Northern Tier and Mid-Atlantic Drought |
| D | Southwest Drought extending to the North and also the Great Lakes |
You may have to squint but the drought probabilities are shown on the map and also indicated by the color coding with shades of red indicating higher than 25% of the years are drought years (25% or less of average precipitation for that area) and shades of blue indicating less than 25% of the years are drought years. Thus drought is defined as the condition that occurs 25% of the time and this ties in nicely with each of the four pairs of two phases of the AMO and PDO.
Historical Anomaly Analysis
When I see the same dates showing up often I find it interesting to consult this list.
Recent CONUS Weather
This is provided mainly to see the pattern in the weather that has occurred recently.
Here is the 30 Days ending December 24, 2016

And the 30 Days ending December 31, 2016

B. Beyond Alaska and CONUS Let’s Look at the World which of Course also includes Alaska and CONUS
Near Term
World Weather Forecast produced by the Australian Bureau of Meteorology. Unfortunately I do not know how to extract the control panel and embed it into my report so that you could use the tool within my report. But if you visit it Click Here you will be able to use the tool to view temperature or many other things for THE WORLD. It can forecast out for a week. Pretty cool. Return to this report by using the “Back Arrow” usually found top left corner of your screen to the left of the URL Box. It may require hitting it a few times depending on how deep you are into the BOM tool.
Although I can not display the interactive control panel in my article, I can display any of the graphics it provides so below are the current worldwide precipitation and temperature forecasts for three days out. They will auto-update and be current for Day 3 whenever you view them. If you want the forecast for a different day Click Here
Precipitation

Temperature

Looking Out a Few Months
The new precipitation forecast from Queensland Australia was based on a rapidly rising SOI. That did not seem to be correct for October and November. Below are the numbers as of December 19. I am not confident in the 30 day and 90 day averages released this week due to a very extreme value released for December 23 so I have not updated the data below since December 19.

So I used the feature to create a forecast based on stable SOI and this is what was generated.

Here is the most recent JAMSTEC three-month Temperature Forecast.

And here is the most recent three month JAMSTEC Precipitation Forecast.

And then to get more focus, I extracted and enlarged an image for CONUS on the left and Europe on the right.
 |  |
There is a short but very important JAMSTEC discussion:
Dec. 19, 2016 Prediction from 1st Dec., 2016
ENSO forecast:
According to the SINTEX-F prediction, the current La Niña Modoki/La Niña state will continue until late winter. Interestingly, majority of the ensemble members indicate recurrence of a moderate El Niño event in the latter half of 2017. It will be interesting if an El Niño event really evolves in 2017, which may suggest a decadal turnabout in the tropical Pacific climate condition to El Niño-like state after a long spell of La Niña-like state, which led to the global warming hiatus.
Indian Ocean forecast:
The negative Indian Ocean Dipole has started decaying and will be terminated by the end of 2016. Then we expect a positive Indian Ocean Dipole in summer of 2017. We also expect the Ningaloo Niño off the west coast of Australia in late austral summer, which may persist until late austral fall. However, the prediction plumes are spreading and those expectations are still uncertain at the present stage.
Regional forecast:
On a seasonal scale, most part of the globe will experience a warmer-than-normal condition, while some parts of northern U.S., southern Canada, northern Brazil, and Australia will experience a colder-than-normal condition in the boreal winter.
According to the seasonally averaged rainfall prediction, most parts of southeastern China, Indonesia, eastern Africa, eastern half of Europe including Italy, and Caribbean countries including Florida will experience a drier condition during winter, whereas the Philippines, the eastern U.S., and the western part of Europe will experience a wetter-than-normal condition. Most parts of Brazil, Australia and South Africa will experience a wetter-than-normal condition during austral summer. Most parts of Japan will be warmer and quite drier than normal in winter. However, we note that highly fluctuating mid- and -high latitude climate in winter may not be captured well by the current model.
Additional forecasts from JAMSTEC including future time periods can be found at this link.
Sea Surface Temperature (SST) Departures from Normal for this Time of the Year i.e. Anomalies
And when we look at the current Sea Surface anomalies below, we see a lot of them not just along the Equator related to ENSO.
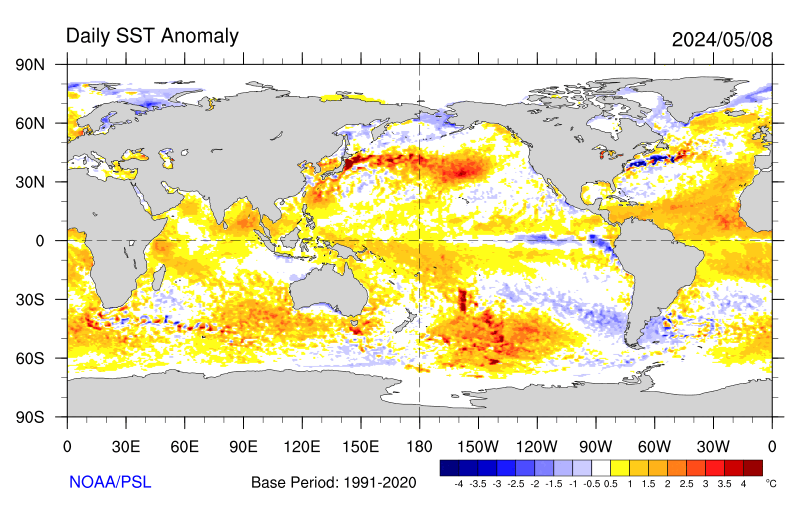
Below I show the changes over the last month in the Sea Surface Temperature (SST) anomalies.

Below is an analysis of projected tropical hazards and benefits over an approximately two-week period. This graphic is scheduled to update on Tuesday and I am reading the December 27, 2016 Version and looking at Week 2 of that forecast.
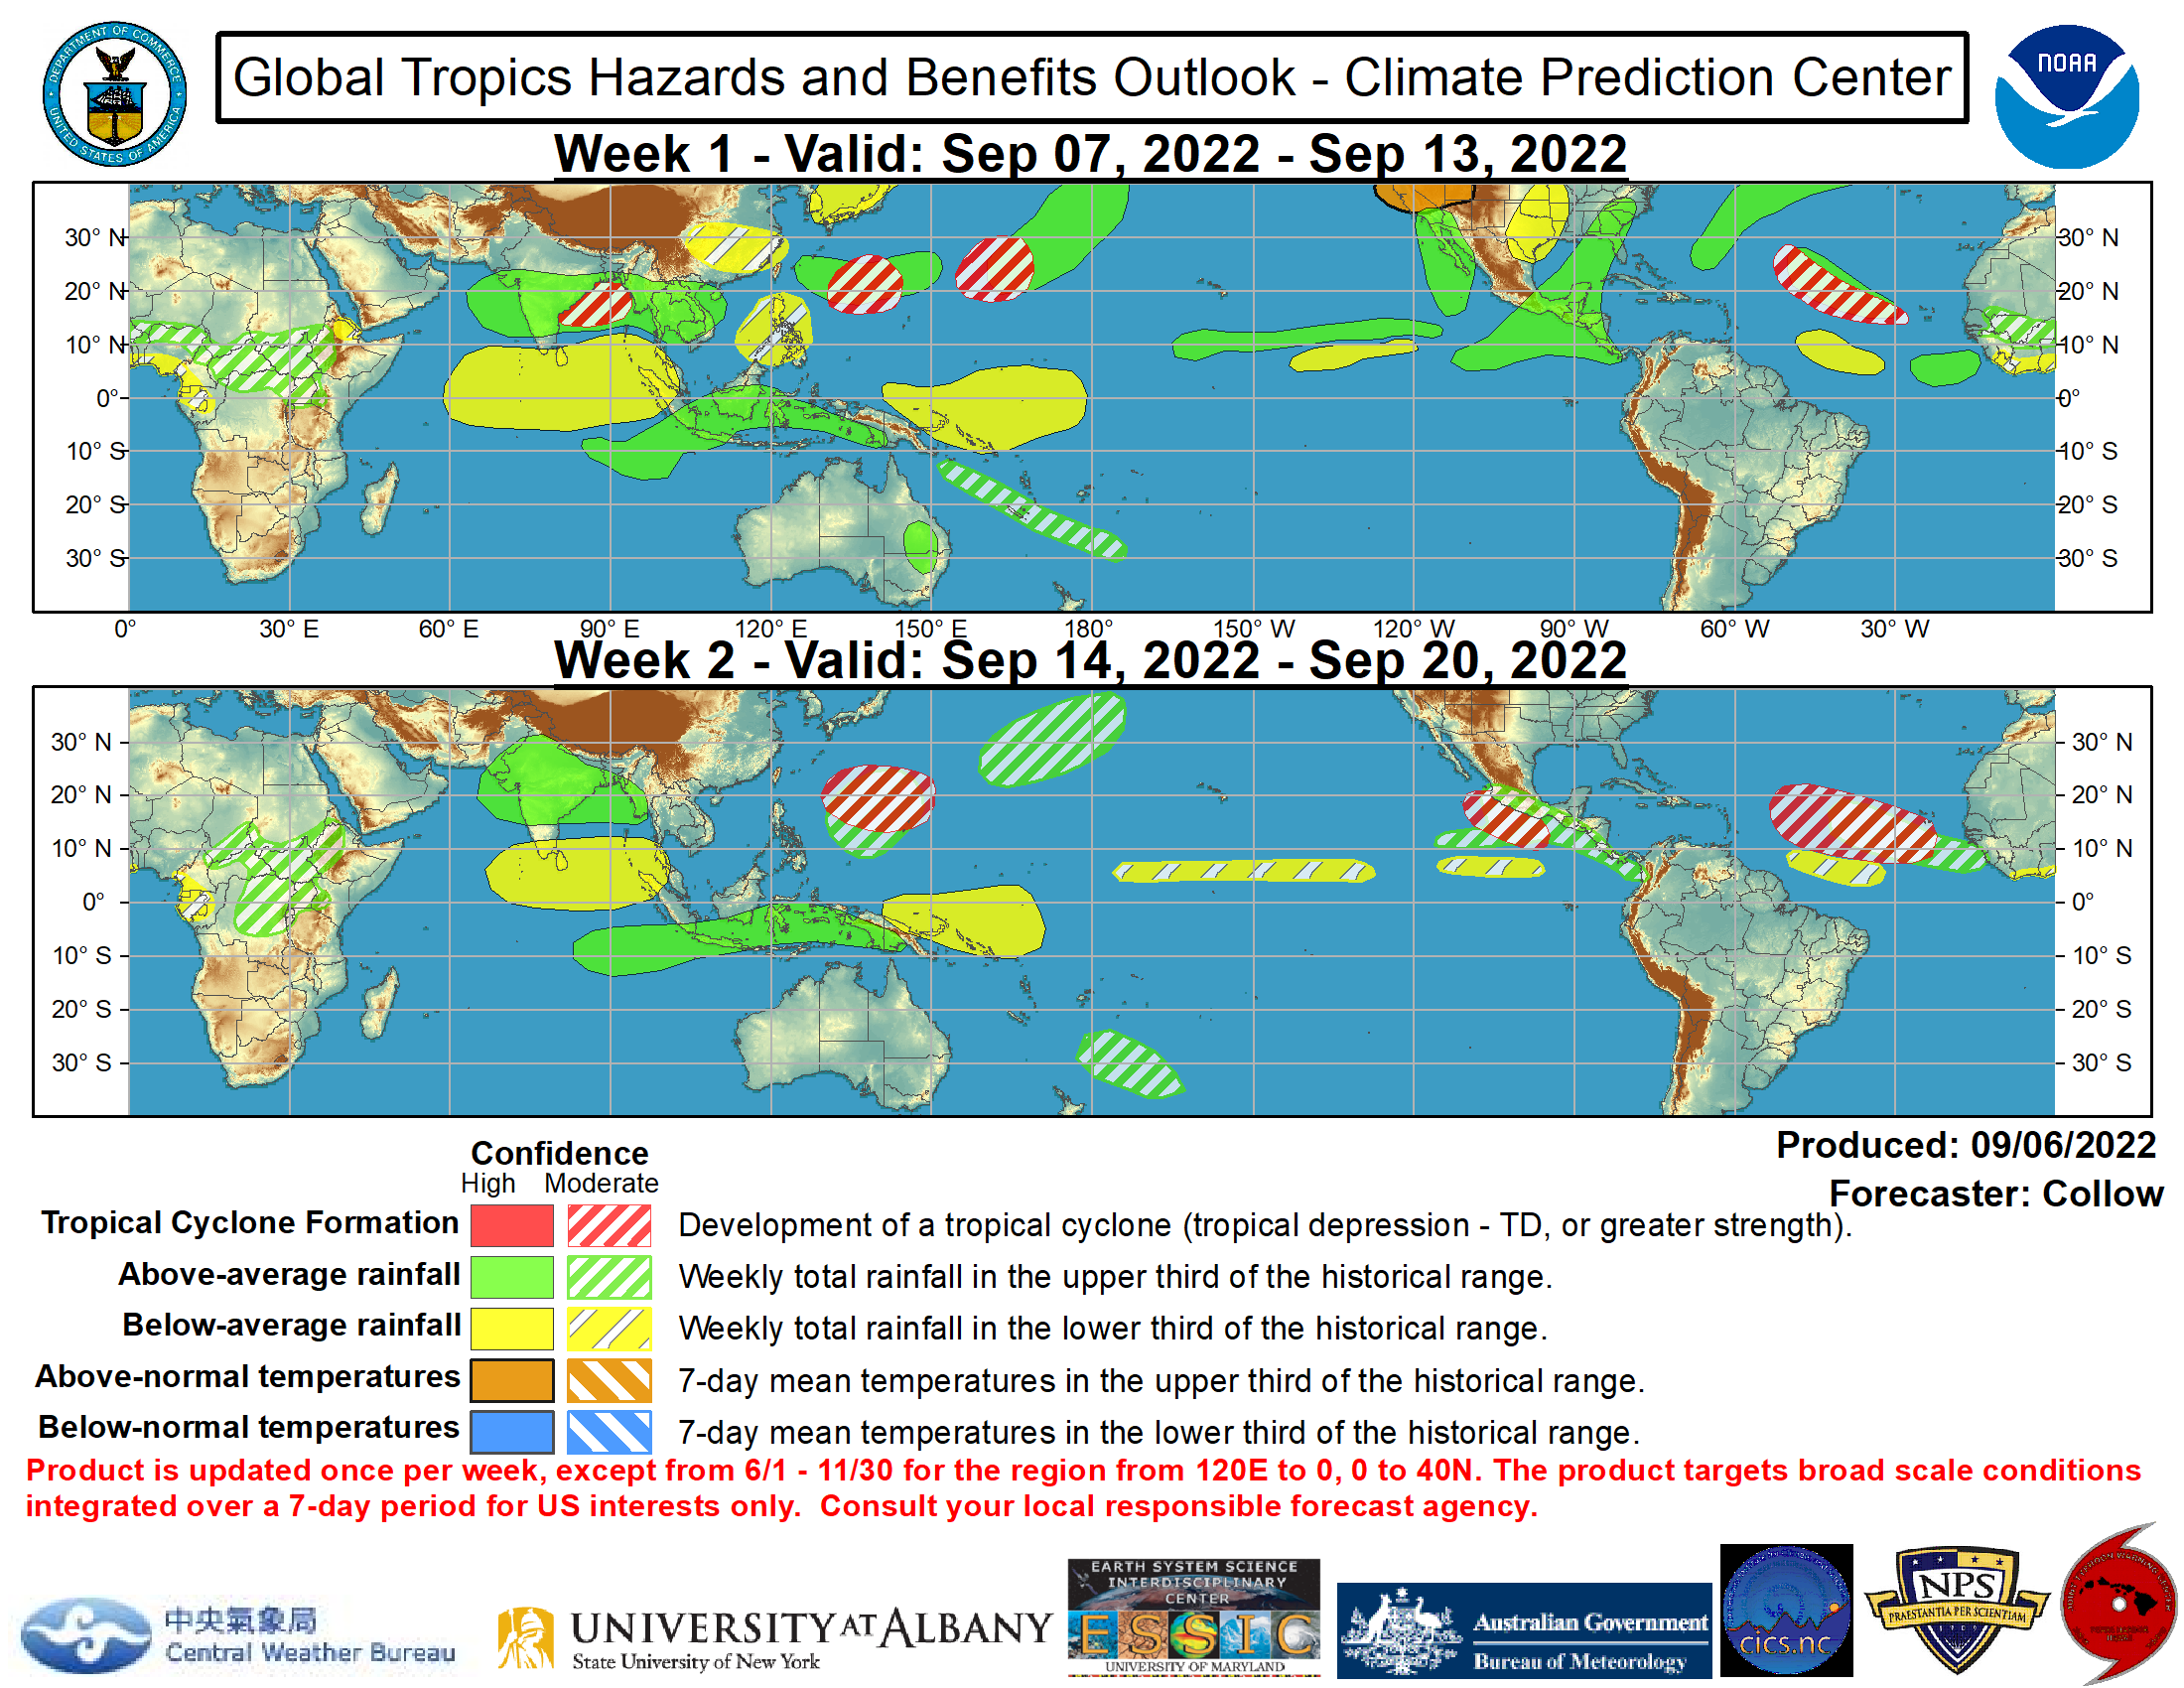
* Moderate Confidence that weekly total rainfall will be in the upper third of the historical range.
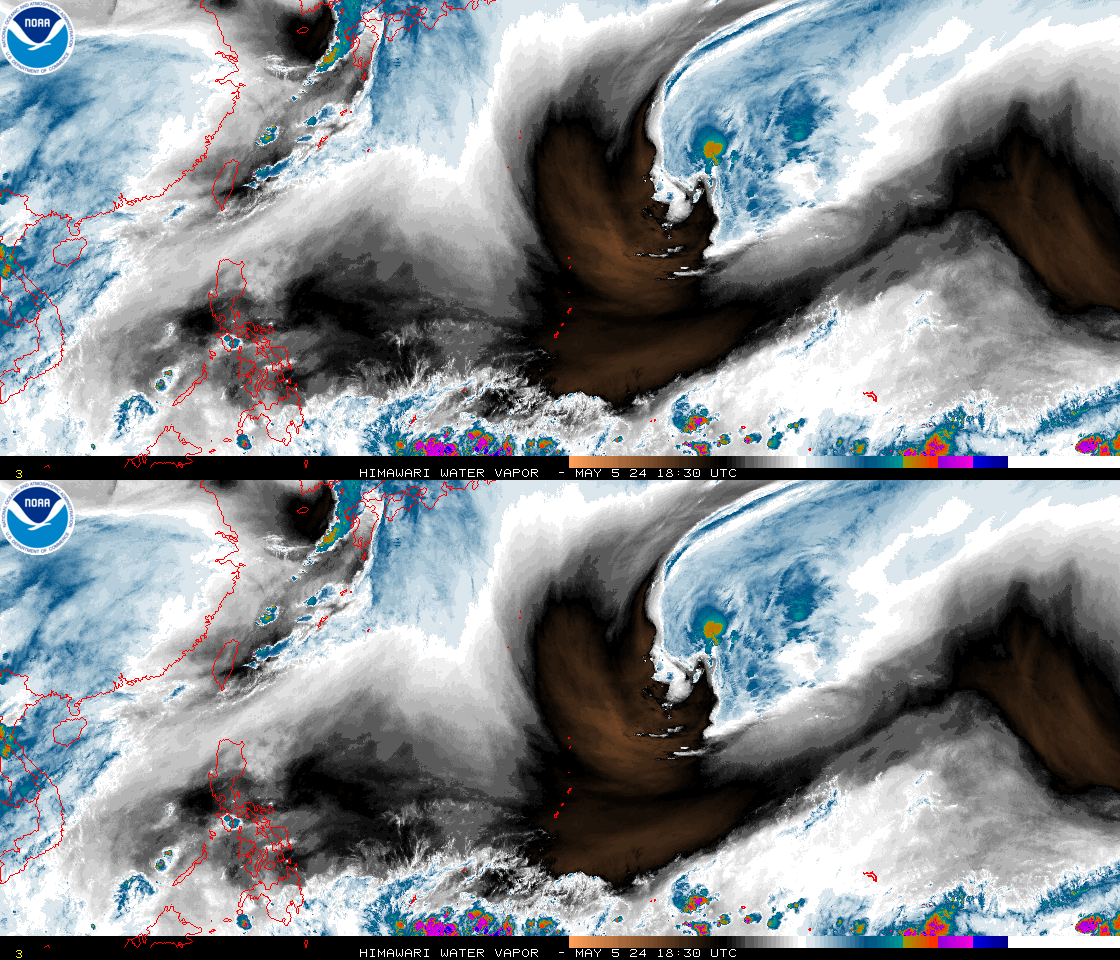
Look at the Western Pacific in Motion. NOAA is having problems with their web site so I have temporarily substituted a static image but you can find a somewhat similar loop version by clicking here. It actually provides more functionality than the displayed version but you have to click to get it as I have not figured out how to get it to display otherwise.
C. Progress of the Cool ENSO Event
Starting with Surface Conditions.
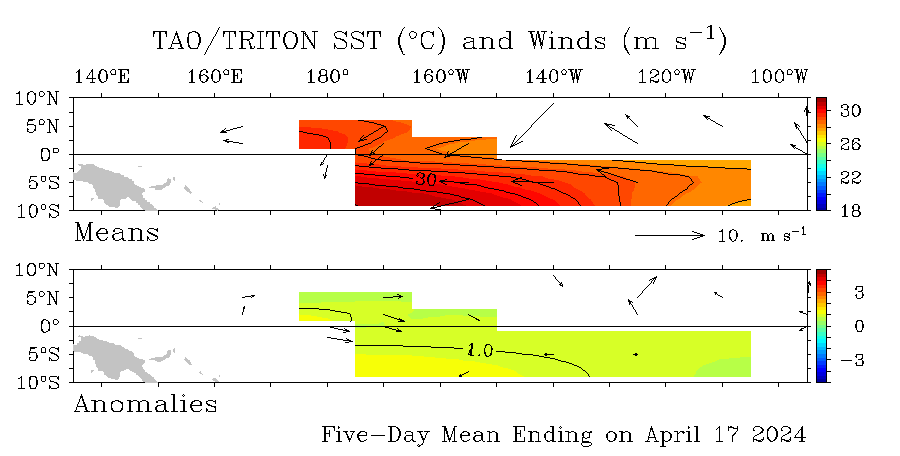
TAO/TRITON GRAPHIC (a good way of viewing data related to the part of the Equator and the waters close to the Equator in the Eastern Pacific where we monitor to determining the current phase of ENSO. It is probably not necessary to follow the discussion below, but here is a link to TAO/TRITON terminology.

And here is the current version of the TAO/TRITON Graphic.
| ———————————————— | A | B | C | D | E | —————– |
The below table which only looks at the Equator shows the extent of anomalies along the Equator. I had split the table to show warm, neutral, and cool anomalies. The top rows showed El Nino anomalies. When there were no more El Nino anomalies along the Equator, I eliminated those rows. The two rows just below that break point contribute to ENSO Neutral and after another break, the rows are associated with La Nina conditions. I have changed the reference date to May 23, 1016.
Subareas of the Anomaly | Westward Extension | Eastward Extension | Degrees of Coverage | |||||
As of Today | May 23, 2016 | As of Today | May 23 2016 | As of Today | In Nino 3.4 | Dec 12, 2016 | May 23, 2016 | |
| These Rows Show the Extent of ENSO Neutral Impacts on the Equator | ||||||||
| 0.5C or cooler Anomaly | 175E | 155E | Land | 155W | 90 | 50 | 95 | 50 |
| 0C or cooler Anomaly | 175W | 155W | LAND | Land | 80 | 50 | 85 | 60 |
| These Rows Show the Extent of the La Nina Impacts on the Equator | ||||||||
| -0.5C or cooler | 165W135W | 145W | 145W125W | Land | 30 | 30 | 65 | 50 |
| -1C or cooler Anomaly | LAND | 140W | LAND | 105W | 0 | 0 | 40 | 35 |
| -1.5C or cooler Anomaly | LAND | 135W | LAND | 120W | 0 | 0 | 0 | 0 |
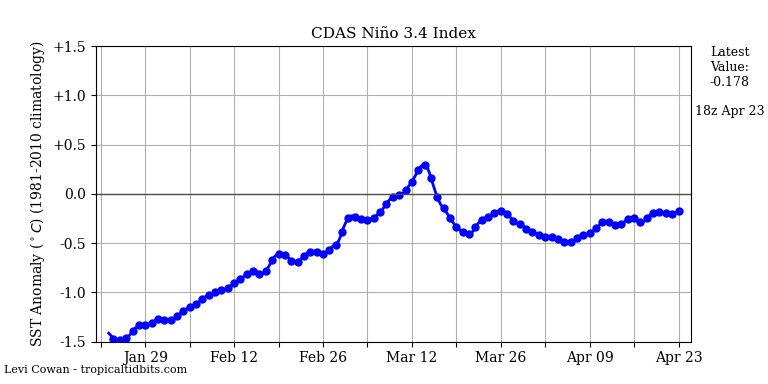
I calculate the current value of the ONI index (really the value of NINO 3.4 as the ONI is not reported as a daily value) each week using a method that I have devised. To refine my calculation, I have divided the 170W to 120W Nino 3.4 measuring area into five subregions (which I have designated from west to east as A through E) with a location bar shown under the TAO/TRITON Graphic). I use a rough estimation approach to integrate what I see below and record that in the table I have constructed. Then I take the average of the anomalies I estimated for each of the five subregions.
So as of Monday January 2, in the afternoon working from the January 1 TAO/TRITON report, this is what I calculated. [Although the TAO/TRITON Graphic appears to update once a day, in reality it updates more frequently.]
| Anomaly Segment | Estimated Anomaly | |
| Last Week | This Week | |
| A. 170W to 160W | -0.4 | -0.3 |
| B. 160W to 150W | -0.7 | -0.5 |
| C. 150W to 140W | -0.2 | -0.3 |
| D. 140W to 130W | -0.0 | -0.2 |
| E. 130W to 120W | -0.3 | -0.6 |
| Total | -1.6 | -2.0 |
| Total divided by five subregions i.e. the ONI | (-1.6)5 = -0.3 | (-2.0)/5 = -0.4 |

From Tropical Tidbits.com

Sea Surface Temperature and Anomalies
It is the ocean surface that interacts with the atmosphere and causes convection and also the warming and cooling of the atmosphere. So we are interested in the actual ocean surface temperatures and the departure from seasonal normal temperatures which is called “departures” or “anomalies”. Since warm water facilitates evaporation which results in cloud convection, the pattern of SST anomalies suggests how the weather pattern east of the anomalies will be different than normal.

I had stopped showing the below graphic which is more focused on the Equator but looks down to 300 meters rather than just being the surface. But over the last month there has been sufficient change to warrant including this graphic.

Let us look in more detail at the Equatorial Water Temperatures.
We are now going to change the way we look at a three-dimensional view of the Equator and move from the surface view and an average of the subsurface heat content to a more detailed view from the surface down. Notice by the date of the graphic (dated December 29, 2016) that the lag in getting this information posted so the current situation may be a bit different than shown although this graphic was updated on Sunday so it is more current than usual. The date shown is the midpoint of a five-day period with that date as the center of the five-day period.
But I am going to start with a graphic I rarely show.

And now the pair of graphics that I regularly provide. The bottom graphic shows the absolute values, the upper graphic shows anomalies compared to what one might expect at this time of the year in the various areas both 130E to 90W Longitude and from the surface down to 450 meters. At different times and today in particular, I have discussed the difference between the actual values and the deviation of the actual values from what is defined as current climatology (which adjusts every ten years except along the Equator where it is adjusted every five years) and how both measures are useful but for different purposes.
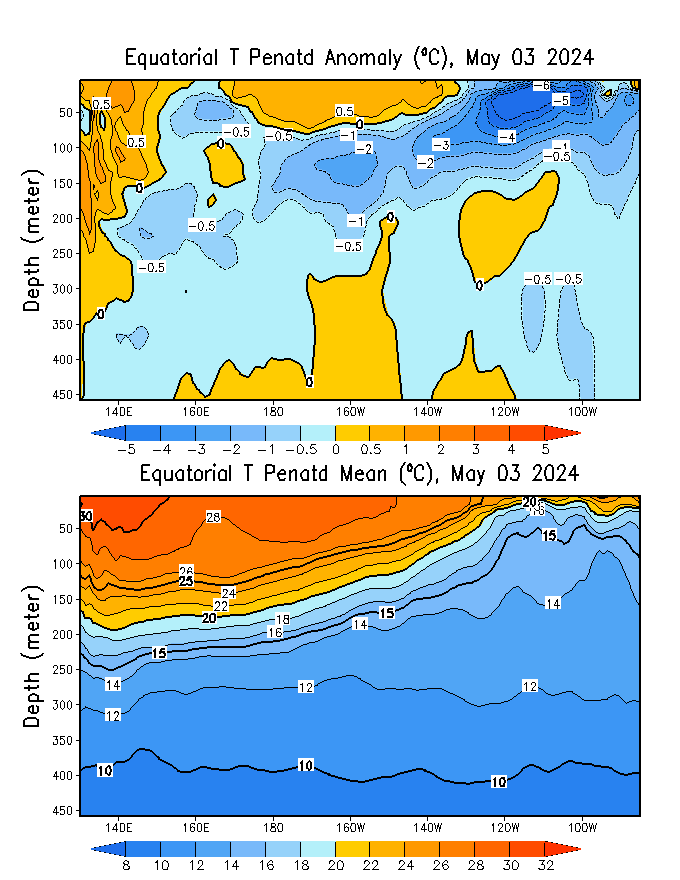
The bottom half of the graphic (Absolute Values which highlights the Thermocline) is now more useful as we track the progress of this new Cool Event.
Here are the above graphics as a time sequence animation. You may have to click on them to get the animation going.
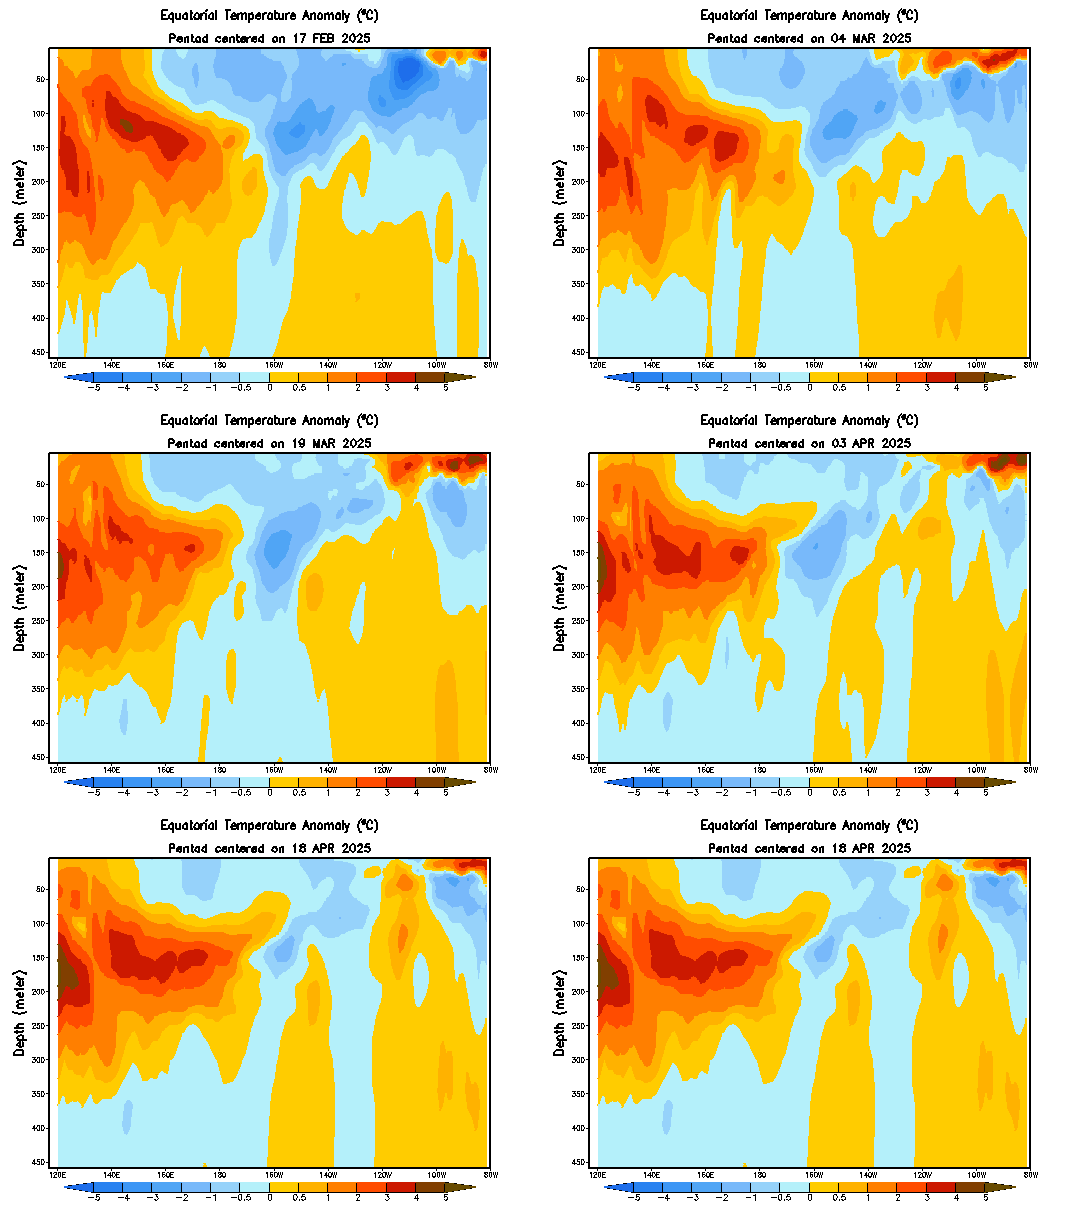
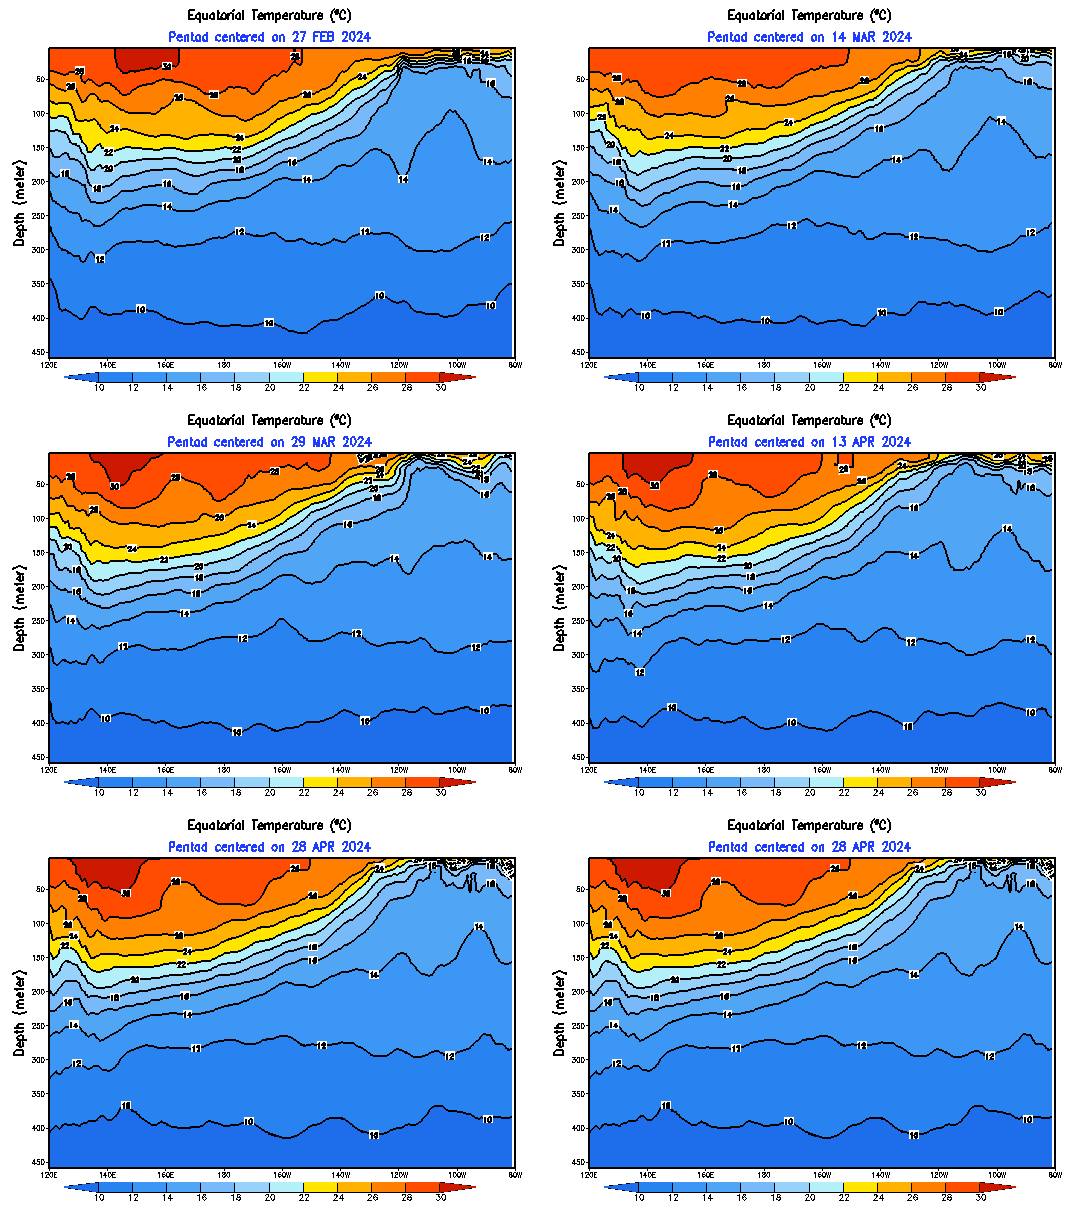
Although I did not fully discuss the Kelvin Waves earlier, now seems to be the best place to show the evolution of the subsurface temperatures which remains relevant. What we have is only the upwelling phase of the series of Kelvin waves last winter.

And now Let us look at the Atmosphere.
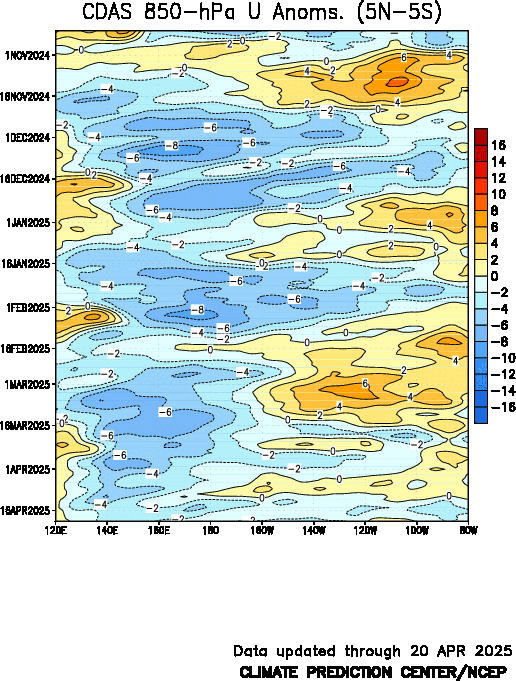
Low-Level Wind Anomalies near the Equator
Here are the low-level wind anomalies.
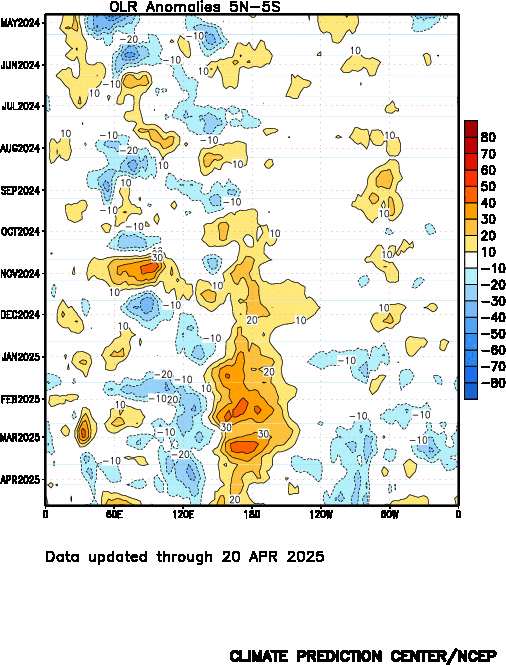
And now the Outgoing Longwave Radiation Anomalies which tells us where convection has been taking place.
And Now the Air Pressure which Shows up Mostly in an Index called the SOI.
This index provides an easy way to assess the location of and the relative strength of the Convection (Low Pressure) and the Subsidence (High Pressure) near the Equator. Experience shows that the extent to which the Atmospheric Air Pressure at Tahiti exceeds the Atmospheric Pressure at Darwin Australia when normalized is substantially correlated with the Precipitation Pattern of the entire World.
Below is the Southern Oscillation Index (SOI) reported by Queensland, Australia. The first column is the tentative daily reading, the second is the 30 day moving/running average and the third is the 90 day moving/running average.
| Date | Current Reading | 30-Day Average | 90 Day Average |
| Dec 27 | -2.02 | ||
| Dec 28 | -3.06 | ||
| Dec 29 | -5.50 | ||
| Dec 30 | +2.59 | ||
| Dec 31 | +9.76 | ||
| Jan 1 | +24.83 | ||
| Jan 2 | +36.75 | ||
| Seven Day Total | +63.35 | ||
| Seven Day Average | +9.05 |
* The reported value for December 23 is questionable. I have asked for clarification and so far no response. So for the time being I am calculating and reporting a seven day average. After we get to January 22 I will begin reporting the 30 day average and 60 days later I will begin to report a 90 day average. Between now and then if the December 23 value is correct or adequately explained I will begin reporting the 30 day average and 90 day average.
The seven day average as of January 2, 2017 is +9.05 which is a La Nina value. You can see the change during the week so obviously some storm systems were involved.
To some extent it is the change in the SOI that is of most importance. It had been increasing in September but now in October and November and through most of December has stabilized in the Neutral Range. That could change but for now the SOI is not signaling a La Nina but ENSO Neutral (not this seven day period however).
The MJO or Madden Julian Oscillation is an important factor in regulating the SOI and Kelvin Waves and other tropical weather characteristics. More information on the MJO can be found here. Here is another good resource. December was not particularly favorable for La Nina development and most likely neither will be January in terms of the MJO.The forecasts of the MJO are all over the place and not suggesting a strong Active or Inactive Phase of the MJO any time soon.The MJO being Inactive is more favorable for La Nina than the MJO being Active. But the MJO goes back and forth from being Active, Inactive, strong and weak so it has mostly a short-term impact. It is possible that a weak Inactive Phase of the MJO might be giving this dying La Nina a little reprieve but the forecast is that this will soon change to a weak Active Phase so it is not very significant other than on a weekly basis.
The MJO tends to be more important when the situation is ENSO Neutral and the MJO can start the process of an El Nino getting started. It is less significant re the initiation of a La Nina but is a factor. It is surprising how weak the MJO has been for months. But it may account for what seems like a cycling of the estimate of Nino 3.4 as the cool water is blown first to the west and then to the east. This impacts the upwelling also.
Forecasting the Evolution of ENSO
We have the December early-month report from CPC/IRI which I call the reading of the tea leaves in that it is based on a combination of model results and a survey of the views of meteorologists.
Figure 1 is based on a consensus of CPC and IRI forecasters, in association with the official CPC/IRI ENSO Diagnostic Discussion

Now we have the December 15, 2016 fully model-based version .

And here is the discussion that was released with the graphic.
What is the outlook for the ENSO status going forward? The most recent official diagnosis and outlook was issued one week ago in the NOAA/Climate Prediction Center ENSO Diagnostic Discussion, produced jointly by CPC and IRI; it carries a La Niña advisory and called for weak La Niña to last through winter 2016-17 (i.e., for December-February), and for a transition to neutral to occur by late winter. The latest set of model ENSO predictions, from mid-December, now available in the IRI/CPC ENSO prediction plume, is discussed below. Those predictions suggest that the SST could remain in the weak La Niña category during the rest of 2016 and into the early part of 2017, or may return to neutral by the New Year.
As of mid-November, 17% of the dynamical or statistical models predicts La Niña conditions for the initial Dec-Feb 2016-17 season, while 83% predict neutral ENSO. At lead times of 3 or more months into the future, statistical and dynamical models that incorporate information about the ocean’s observed subsurface thermal structure generally exhibit higher predictive skill than those that do not. For the Mar-May 2017 season, among models that do use subsurface temperature information, no model predicts La Niña conditions, 89% predicts ENSO-neutral conditions, and 11% predicts El Niño conditions. For all model types, the probabilities for La Niña are 9% for Jan-Mar 2016-17, and less than 5% for all subsequent seasons out to Aug-Oct 2017. The probability for neutral conditions is at least 70% for all seasons through the final season of Aug-Oct 2017, and rise to greater than 90% from Jan-Mar through Apr-Jun 2017. Probabilities for El Niño are near zero initially, rise to 5-10% by Mar-May 2017, and to 25-30% from Jun-Aug through the final season of Aug-Oct.
Here is the daily PDF and Spread Corrected version of the NOAA CFSv2 Forecast Model.
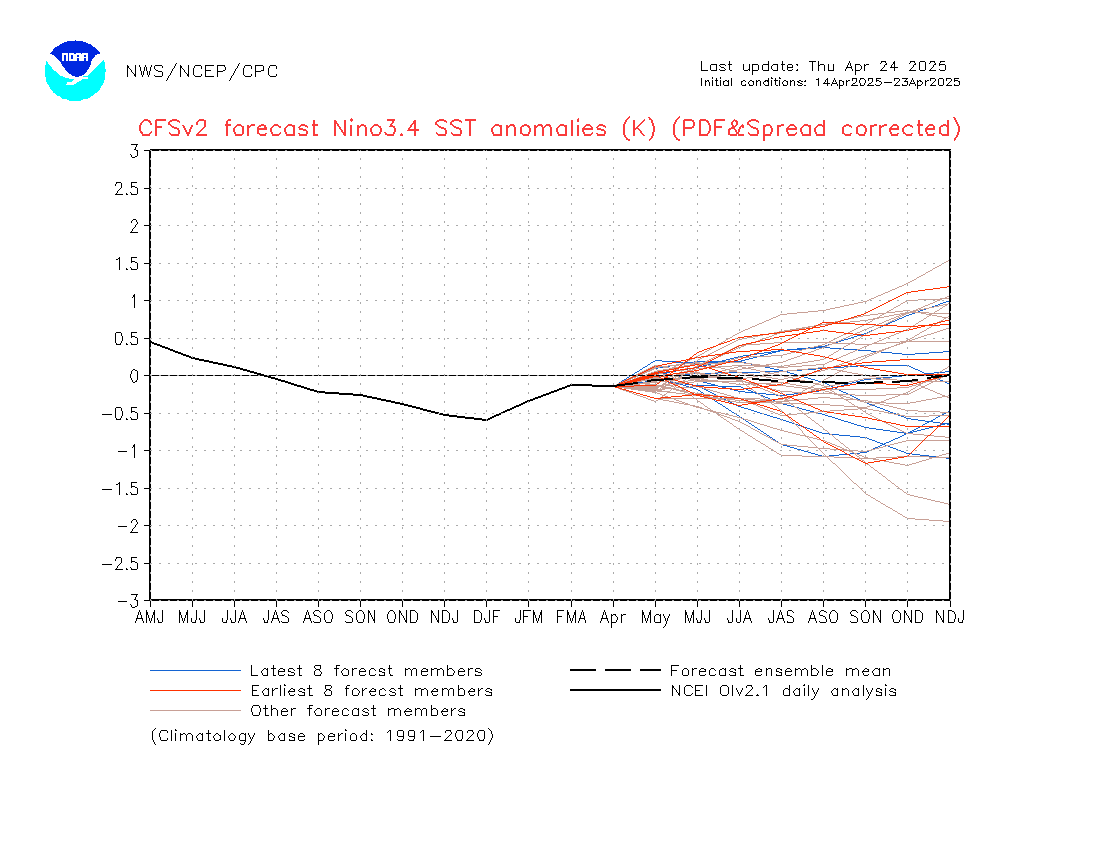
The full list of weekly values can be found here.
Forecasts from Other Meteorological Agencies.
Here is the Nino 3.4 report from the Australian BOM (it updates every two weeks)

Discussion (notice their threshold criteria are different from NOAA but also their actuals are higher than recorded by NOAA and yet Nino 3.4 is standard. So someone is incorrect OR WORSE.)
Here is the discussion.
El Niño–Southern Oscillation remains neutral
The El Niño–Southern Oscillation (ENSO) remains neutral—neither El Niño nor La Niña. All but one of the climate models surveyed by the Bureau indicate neutral conditions are likely to persist until at least early in the southern autumn. When ENSO is neutral, weather patterns over the Pacific region are typically close to normal. This means there is a lower likelihood that eastern Australia’s climate will be considerably wetter or drier than normal.
Although almost all ENSO indicators are firmly within their neutral range, cloud and rainfall patterns continue to show some weak La Niña-like characteristics. However, the central tropical Pacific Ocean has warmed in recent weeks, and further warming is expected in the coming months, suggesting cloud patterns are likely to return to normal during the southern summer. Similarly, warm waters in the eastern Indian Ocean have cooled considerably in recent weeks, with the onset of the southern monsoon, and hence cloud patterns have eased closer to normal.
The Indian Ocean Dipole has little influence on Australian climate during the months of December to April.
We also have the most recent JAMSTEC December 1, 2016 ENSO forecast.

The model continues to show ENSO Neutral or what they call a weak La Nina Modoki gradually ending. The potential for an El Nino had been taken out of the forecast last month but is back in the forecast again. The JAMSTEC Discussion is shown earlier in this report.
Indian Ocean IOD (It updates every two weeks)
The IOD Forecast is indirectly related to ENSO but in a complex way.

Discussion
Indian Ocean Dipole outlooks
The Indian Ocean Dipole (IOD) is neutral. The weekly index value to 1 January is −0.23 °C.
The May outlook suggests a neutral IOD for the end of autumn.
The influence of the IOD on Australian climate is weak during December to April. This is because the monsoon trough shifts south over the tropical Indian Ocean, changing wind patterns, preventing an IOD ocean temperature pattern from being able to form.
D. Putting it all Together.
Looks like this Cool Event is no longer even properly described as La Nina Conditions Apply.
Forecasting Beyond Five Years.
So in terms of long-term forecasting, none of this is very difficult to figure out actually if you are looking at say a five-year or longer forecast. The research on Ocean Cycles is fairly conclusive and widely available to those who seek it out. I have provided a lot of information on this in prior weeks and all of that information is preserved in Part II of my report in the Section on Low Frequency Cycles 3. Low Frequency Cycles such as PDO, AMO, IOBD, EATS. It includes decade by decade predictions through 2050. Predicting a particular year is far harder. Parts of that discussion are in the beginning section of this week’s Report.
E. Relevant Recent Articles and Reports
Weather in the News
Nothing to report
Weather Research in the News
Nothing to report.
Global Warming in the News
Nothing to report
F. Table of Contents for Page II of this Report Which Provides a lot of Background Information on Weather and Climate Science
The links below may take you directly to the set of information that you have selected but in some Internet Browsers it may first take you to the top of Page II where there is a TABLE OF CONTENTS and take a few extra seconds to get you to the specific section selected. If you do not feel like waiting, you can click a second time within the TABLE OF CONTENTS to get to the specific part of the webpage that interests you.
1. Very High Frequency (short-term) Cycles PNA, AO,NAO (but the AO and NAO may also have a low frequency component.)
2. Medium Frequency Cycles such as ENSO and IOD
3. Low Frequency Cycles such as PDO, AMO, IOBD, EATS.
4. Computer Models and Methodologies
5. Reserved for a Future Topic (Possibly Predictable Economic Impacts)
G. Table of Contents of Contents for Page III of this Report – Global Warming Which Some Call Climate Change.
The links below may take you directly to the set of information that you have selected but in some Internet Browsers it may first take you to the top of Page III where there is a TABLE OF CONTENTS and take a few extra seconds to get you to the specific section selected. If you do not feel like waiting, you can click a second time within the TABLE OF CONTENTS to get to the specific part of the webpage that interests you.
2. Climate Impacts of Global Warming
3. Economic Impacts of Global Warming
4. Reports from Around the World on Impacts of Global Warming
Useful Background Information
With respect to relating analog dates to ENSO Events, the following table might be useful. In most cases this table will allow the reader to draw appropriate conclusions from NOAA supplied analogs. If the analogs are not associated with an El Nino or La Nina they probably are not as easily interpreted. Remember, an analog is indicating a similarity to a weather pattern in the past. So if the analogs are not associated with a prior El Nino or prior La Nina the computer models are not likely to generate a forecast that is consistent with an El Nino or a La Nina.
| El Ninos | La Ninas | |||||||||
|---|---|---|---|---|---|---|---|---|---|---|
| Start | Finish | Max ONI | PDO | AMO | Start | Finish | Max ONI | PDO | AMO | |
| DJF 1950 | J FM 1951 | -1.4 | – | N | ||||||
| T | JJA 1951 | DJF 1952 | 0.9 | – | + | |||||
| DJF 1953 | DJF 1954 | 0.8 | – | + | AMJ 1954 | AMJ 1956 | -1.6 | – | + | |
| M | MAM 1957 | JJA 1958 | 1.7 | + | – | |||||
| M | SON 1958 | JFM 1959 | 0.6 | + | – | |||||
| M | JJA 1963 | JFM 1964 | 1.2 | – | – | AMJ 1964 | DJF 1965 | -0.8 | – | – |
| M | MJJ 1965 | MAM 1966 | 1.8 | – | – | NDJ 1967 | MAM 1968 | -0.8 | – | – |
| M | OND 1968 | MJJ 1969 | 1.0 | – | – | |||||
| T | JAS 1969 | DJF 1970 | 0.8 | N | – | JJA 1970 | DJF 1972 | -1.3 | – | – |
| T | AMJ 1972 | FMA 1973 | 2.0 | – | – | MJJ 1973 | JJA 1974 | -1.9 | – | – |
| SON 1974 | FMA 1976 | -1.6 | – | – | ||||||
| T | ASO 1976 | JFM 1977 | 0.8 | + | – | |||||
| M | ASO 1977 | DJF 1978 | 0.8 | N | – | |||||
| M | SON 1979 | JFM 1980 | 0.6 | + | – | |||||
| T | MAM 1982 | MJJ 1983 | 2.1 | + | – | SON 1984 | MJJ 1985 | -1.1 | + | – |
| M | ASO 1986 | JFM 1988 | 1.6 | + | – | AMJ 1988 | AMJ 1989 | -1.8 | – | – |
| M | MJJ 1991 | JJA 1992 | 1.6 | + | – | |||||
| M | SON 1994 | FMA 1995 | 1.0 | – | – | JAS 1995 | FMA 1996 | -1.0 | + | + |
| T | AMJ 1997 | AMJ 1998 | 2.3 | + | + | JJA 1998 | FMA 2001 | -1.6 | – | + |
| M | MJJ 2002 | JFM 2003 | 1.3 | + | N | |||||
| M | JJA 2004 | MAM 2005 | 0.7 | + | + | |||||
| T | ASO 2006 | DJF 2007 | 1.0 | – | + | JAS 2007 | MJJ 2008 | -1.4 | – | + |
| M | JJA 2009 | MAM 2010 | 1.3 | N | + | JJA 2010 | MAM 2011 | -1.4 | + | + |
| JAS 2011 | FMA 2012 | -0.9 | – | + | ||||||
| T | MAM 2015 | NA | 1.0 | + | N | |||||
ONI Recent History

The Aug/Sept/Oct reading has been issued and is currently listed as -0.7. The Sep/Oct/Nov preliminary estimate is -0.8 so there would now need for there to be two more periods of -0.5 or colder for this to be eligible to be formally recorded as a La Nina. I suspect there will be one more but not two. NOAA seems to be determined to make that happen. THEIR FUNDING MAY DEPEND ON THAT.
The full history of the ONI readings can be found here. The MEI index readings can be found here.


