Money Morning Article of the Week
by Peter Krauth, Money Morning
The U.S. Federal Reserve did gold stocks a big favor on Sept. 17 in not raising interest rates.
This sector has been mired in a correction since late 2011, but signs increasingly suggest that’s coming to an end.

The action in recent months has been encouraging, leading savvy investors to examine, or re-examine, gold stocks as one of the few values the market still has to offer.
Here’s what we see…
Gold Stocks Gain 10% During Week of Fed Meeting
In my recent article, “Gold Price Forecast Sees Rise Before 2016 – Check Out the Charts,” I detailed where gold has been in the last 12 months, as well price movement leading up to the Fed’s rate announcement.
Gold prices gained 2% in the days preceding the Fed’s decision and another 1% through the remainder of that trading day.
For their part, gold stocks also anticipated the Fed decision, gaining a whopping 6% as a group in just the four days before, and another 4% that same day, for a total of 10%.
Now let’s look how gold and gold stocks moved this past week since the Fed meeting.
Charts Show Bullish Sign for Gold Stocks
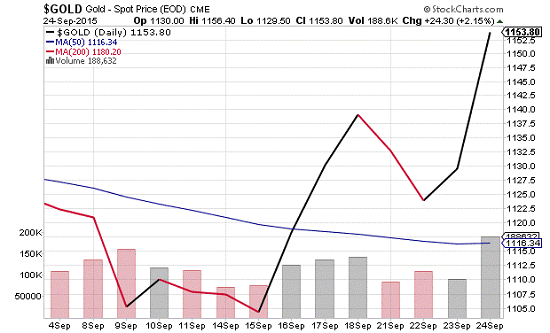
As the chart below shows, gold moved up strongly in the days before and the day after the Fed news, peaking at $1,140. Then it consolidated and retraced to $1,123 before shooting up to $1,154 by Sept. 24, just one week later.
Looking at gold stocks, here’s what they did in the week before and the week since Fed Chairwoman Janet Yellen spoke.

The Market Vectors Gold Miners ETF (NYSE Arca: GDX), which is a good proxy for major gold miners and royalty companies, also backed off over the next few days. But on Sept. 23, GDX put in a higher low than it had previously set on Sept. 14. GDX then shot up 7.24% the next day, Sept. 24, slicing through the 50-day moving average with ease and on big volume for the second time in a single week.
Now if we back up and view the GDX chart over the last four months, two notable points emerge.
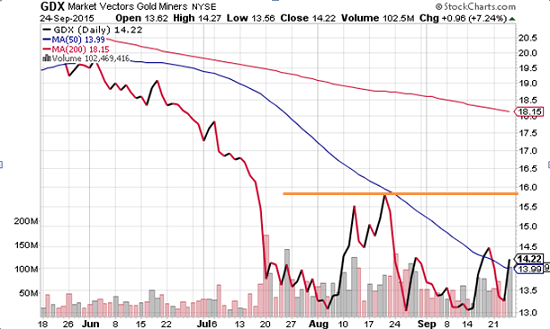
Since early August, GDX appears to have put it in a “triple bottom,” closing just north of $13 each time. And since late August, each subsequent low was slightly higher: $13.04 on Aug. 26, $13.12 on Sept. 14, and then $13.26 on Sept. 23.
This is significant in part because GDX represents the collective price action of the whole sector, the largest public gold miners and royalty companies, and not just a single miner.
The other takeaway from this chart is buying action.
As you can see from the bar charts, each time GDX went into rally mode over the past two months, it was on larger than usual volume. That may imply smart money players are stepping in and building their positions as they recognize value they simply can’t ignore.
Does that mean gold stocks are finally climbing out of their funk? It’s still a little early to tell, but the signs are encouraging.
To get there, the first price target would be to close above $15.81, the recent high of late August. From there, the next target is $18, right around the 200-day moving average.
If GDX can reach and then maintain itself above the 200-day moving average, odds will weigh heavily in favor of a renewed bull market for gold stocks.


