
Written by Steven Hansen
Every day I read about some pundit tossing out opinions on the economy growing faster or collapsing or whatever. These pundits include reputable economists.

Is it just me – but should you not have some analytical basis to forecast? Is pulling a forecast out of your ear really a forecast? That does not mean even with an analytical basis it would be correct, as there is no proven handle on economic dynamics. But still, at least you have a basis for forecasting.
It brings a smile to my face when I get my quarterly installment of the Survey of Professional Forecasters – a quarterly survey of approximately 50 economists forecasting the USA economy. It is the oldest such survey in the United States. The table below is a compilation of their forecasts for the quarter six months ahead.
Survey of Professional Forecasters
| Forecast Date | Period Forecast | Forecast | Actual (current forecast) |
| 3Q2014 | 1Q2015 | 3.1 | |
| 2Q2014 | 4Q2014 | 3.2 | 4.2 |
| 1Q2014 | 3Q2014 | 2.8 | -2.1 |
| 4Q2013 | 2Q2014 | 2.9 | 3.5 |
| 3Q2013 | 1Q2014 | 2.7 | 4.5 |
| 2Q2013 | 4Q2013 | 2.7 | 1.8 |
| 1Q2013 | 3Q2013 | 2.6 | 2.7 |
| 4Q2012 | 2Q2013 | 2 | 0.1 |
| 3Q2012 | 1Q2013 | 1.8 | 2.5 |
| 2Q2012 | 4Q2012 | 2.6 | 1.6 |
| 1Q2012 | 3Q2012 | 2.6 | 2.2 |
| 4Q2011 | 2Q2012 | 2.4 | 4.6 |
| 3Q2011 | 1Q2012 | 2.2 | 0.8 |
| 2Q2011 | 4Q2011 | 3.5 | 2.9 |
| 1Q2011 | 3Q2011 | 3.1 | -1.5 |
| 4Q2010 | 2Q2011 | 2.7 | 2.5 |
| 3Q2010 | 1Q2011 | 2.3 | 2.7 |
| 2Q2010 | 4Q2010 | 2.8 | 3.9 |
| 1Q2010 | 3Q2010 | 2.7 | 1.7 |
| 4Q2009 | 2Q2010 | 2.4 | 3.9 |
| 3Q2009 | 1Q2010 | 2.5 | 1.3 |
| 2Q2009 | 4Q2009 | 1.7 | -0.5 |
| 1Q2009 | 3Q2009 | 1 | -5.4 |
| 4Q2008 | 2Q2009 | 0.8 | -8.2 |
| 3Q2008 | 1Q2009 | 1.6 | -1.9 |
| 2Q2008 | 4Q2008 | 1.8 | 2 |
| 1Q2008 | 3Q2008 | 2.8 | -2.7 |
| 4Q2007 | 2Q2008 | 2.2 | 1.4 |
| 3Q2007 | 1Q2008 | 2.7 | 2.7 |
| 2Q2007 | 4Q2007 | 2.3 | 3.1 |
| 1Q2007 | 3Q2007 | 2.4 | 0.2 |
| Average | 2.42 | 1.15 | |
| Sigma | 0.6 | 2.9 |
Observations:
- The low standard deviation for the 31 quarterly forecasts shows a remarkable consistency (narrow spread).
- The high standard deviation for the 30 quarterly actuals shows a very wide spread.
- If the economists had been correct the real GDP would have grown by 21% since the beginning of 2007.
- The actual result was an economy that grew by less than 10% as measured by real GDP.
Conclusion:
- The economists have a very precise “science” that yields very inaccurate results. The word “science” is in quotation marks to indicate sarcasm.
One other thing I love about economists – they rarely (never?) forecast recessions. It is in the economist’s bible not to forecast bad times – my thinking is that if they say a recession is coming, then, even if they were wrong, the recession would still occur as the powers in the economy would pre-react [“Pre-react” to me is that if a mainstream group of economists forecast a recession, the markets and business would react as if it were a recession was a given – and a recession would follow]. So where should we look to forecast the economy?
Look at the graph below which has an good record of forecasting.
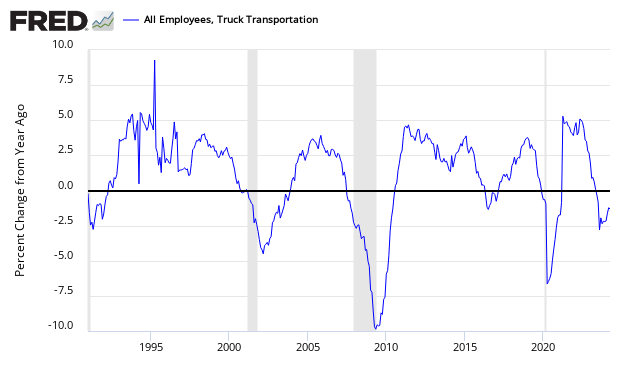
The truck transport portion of employment has provided a six month warning of impending recessions with no false warnings to date. Transport is an economic warning indicator because it moves goods well before final retail sales occur. Until people stop eating or buying goods, transport will remain one of the primary economic pulse points.
Will truck transport employment continue to be accurate? I do not know. There is always a danger that the characteristics of a particular recession will not cause an indicator to contract. But if you just forecast by guessing with a rule that you do not forecast a recession – then a recession will never be forecast, and the benefit of economic forecasting is lost. Catch-22.
An added caveat: The trucking index has far too short a history to have established any statistical record. The best we can say for it today is that it is 2-for-2 on predicting recessions.
Other Economic News this Week:
The Econintersect Economic Index for September 2014 is showing our index declined from last months 3 year high. Outside of our economic forecast – we are worried about the consumers’ ability to expand consumption although data is now showing consumer income is now growing faster than expenditures growth. The GDP expansion of 4.2% in 2Q2014 is overstated as 2.1% of the growth would be making up for the contraction in 1Q2014, and 1.4% of the growth is due to an inventory build. Still, there are no warning signs that the economy is stalling.
The ECRI WLI growth index value has been weakly in positive territory for almost two years. The index is indicating the economy six month from today will be slightly better than it is today.
Current ECRI WLI Growth Index

The market was expecting the weekly initial unemployment claims at 290,000 to 325,000 (consensus 305,000) vs the 280,000 reported. The more important (because of the volatility in the weekly reported claims and seasonality errors in adjusting the data) 4 week moving average moved from 304,250 (reported last week as 304,000) to 299,500.
Weekly Initial Unemployment Claims – 4 Week Average – Seasonally Adjusted – 2011 (red line), 2012 (green line), 2013 (blue line), 2014 (orange line)

/images/z unemployment.PNG
Bankruptcies this Week: NII Holdings (fka Nextel International), SIGA Technologies


