Written by Sig Silber
Updated at 6:30 pm EDT on August 13, 2021 mostly to add the Week 3- 4 Forecast which is generally favorable.
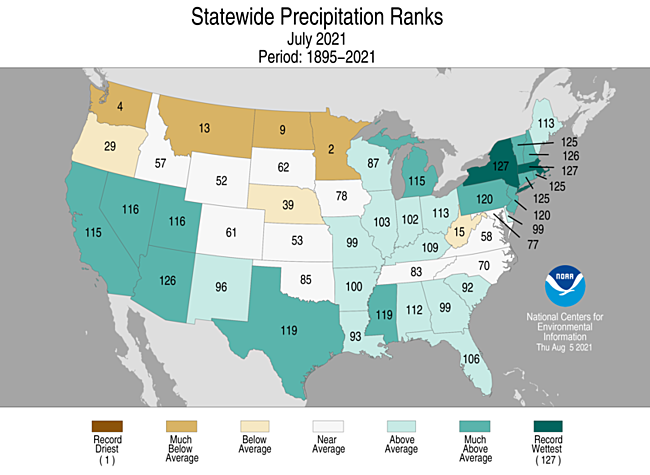
This week we follow a new format: In Part I we assess the recent, current and forecast weather situation; and in Part II we focus on impacts. This allows us in Part I to concentrate on the observation that both July and the first half of this year have been, on an overall basis, wetter than usual but no warmer than the average for this past decade. It is only speculation but one explanation is the temporary absence of La Nina Conditions which are expected to return.

Please share this article – Go to the very top of the page, right-hand side, for social media buttons. Please feel free to send this article to anyone who you think might benefit from reading it.
| In an attempt to keep the size of this article manageable, we have decided to publish it in two parts. In Part I, we will update the current situation, look at recent history and to some extent the forecast. In Part II we will focus on the economic impacts and regional reports, energy, and place special emphasis on the crop reports which now include an Executive Briefing which will be in Part II which will be published soon. |
ENSO Report

I have included the following graphic that I am allowing to continue to update.


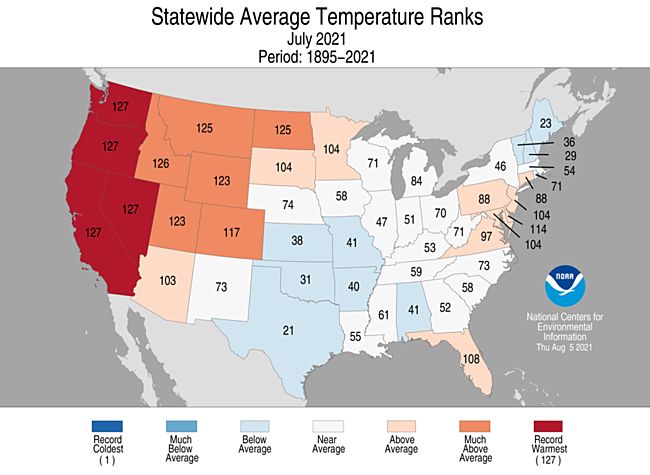
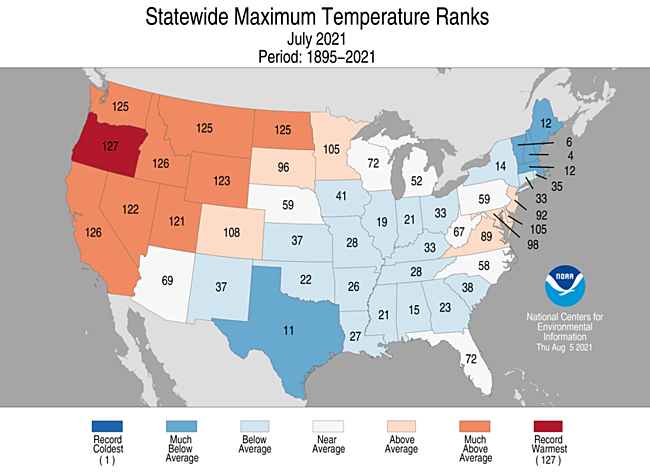
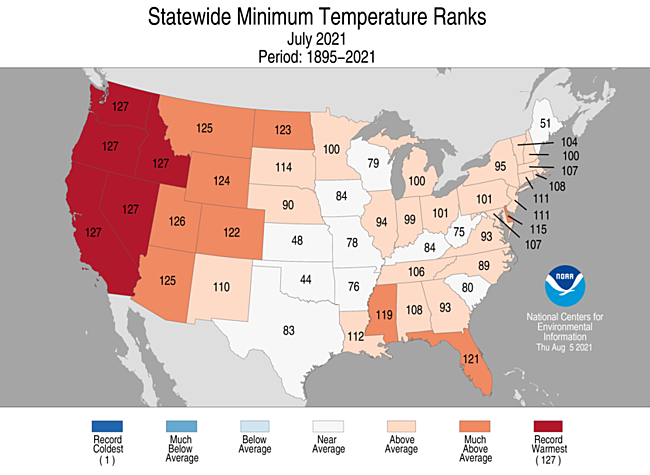
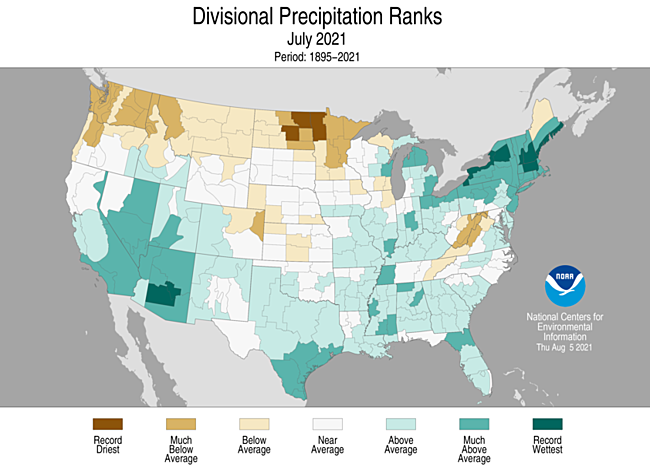
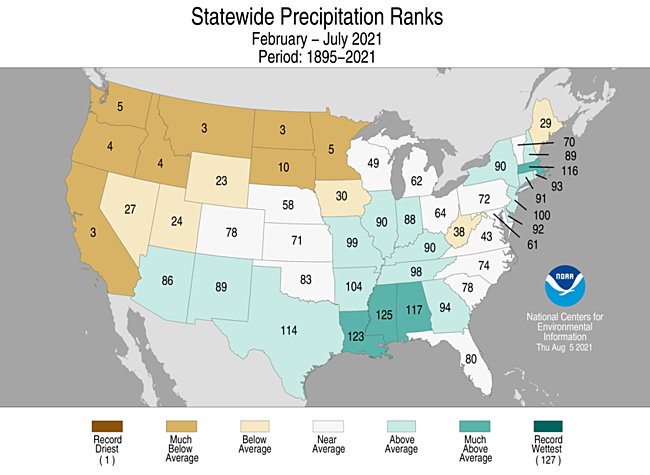
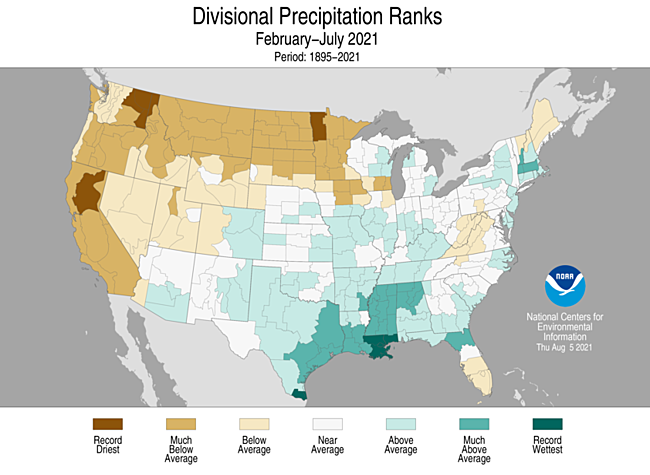
Review of July
[I wish I had a link for this report but I received it by email and I know it is legitimate. I know John Bateman. When I produced this article I neglected to switch on the show images in that email and did not notice the excellent graphics there. But the state ranking graphics that I substituted I think work better so I am not adding the graphics that I did not notice except for one summary graphic. Like with many things about statistics, it is difficult to capture everything in a single map so the maps that I have not shown provide more geographical information than my state ranking graphics but only show deviation from the average and I guess if you have good enough eyesight you might be able to tell the difference between 127 different colors and shades of those colors whereas the state ranking maps make it a lot easier to show the difference between different groups of deviation from average. If I had presented all the rankings by climate division that would have more close provided the geographic detail that is in the graphics that I did not use. I mention this only to make the point that I did not omit those maps on purpose and I have not added them because I think the state ranking graphics that I did use work better but I enjoyed looking at those other graphics when late last night while searching for a url the maps suddenly were visible to me. They are worth looking at mostly because they show how spotty precipitation can be but I do not think it would be useful for me to add them to the article and I do not have a url to refer readers to at this point for readers to be able to view those graphics. But I might get that and if so I will make that available in Part II. One has to say that NOAA produces really good graphics.]


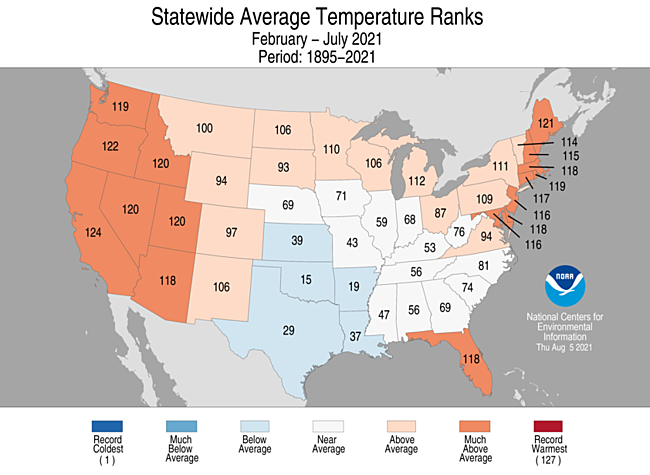
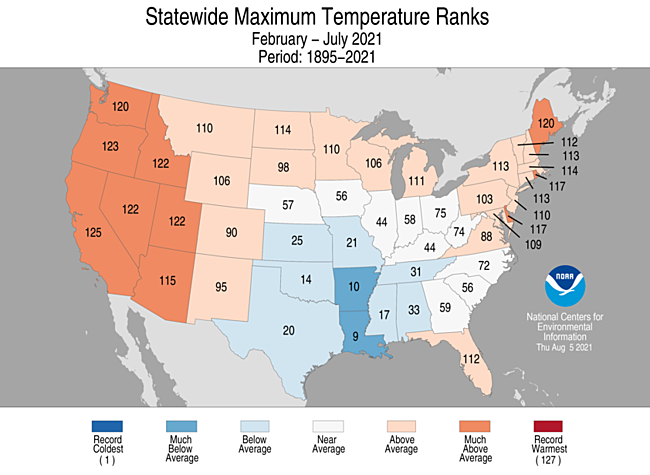
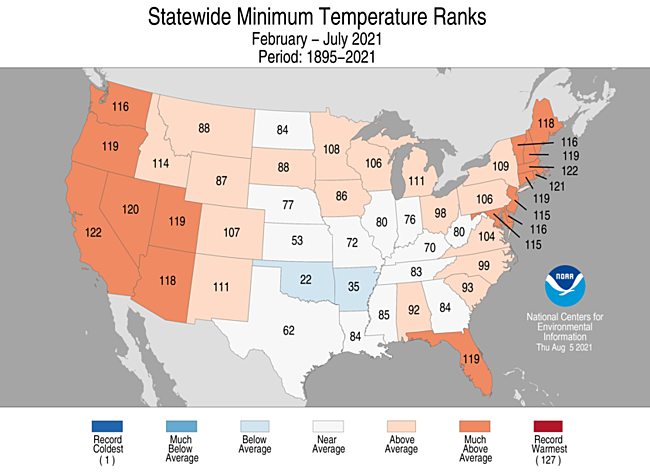
The state rankings are an excellent tool for doing this as they rank the weather in a state by how it fits in the 127 year history of that state.

Again we look at state rankings. I could not find the website where you can put in the start month and end month so I settled for the automatic six months i.e. Feb – Jul rather than the more desirable Jan – Jul but I think it is adequate for our purposes.

Regional Conditions (Will be Reported on in Part II
We might as well show the situation for the California Reservoirs here.


And it is always useful to look at the last seven days. I have stopped showing the Snow Water Equivalent as there is now essentially no snowpack of any significance. So rainfall is what counts now.

Let’s look at the current drought situation.


Here we look at four time periods: one week, one month, six months, and a full year.

Drought Discussion (The Regional links are live and will take you to the drought map for that Region)
This Week’s Drought Summary
Monsoonal moisture was squelched this week, in contrast to the heavy rainfall that had been pelting the southern Rockies and – to a lesser extent – much of the interior West. Totals between 1 and 2 inches were limited to a few patches in southeastern Arizona, central and south-central New Mexico, and scattered higher elevations in central Colorado and central Montana. West of the Plains, only part of northwestern Montana and northwestern Washington saw fairly widespread amounts of 1.5 to locally 3.0 inches. Farther east, significant rainfall evaded most areas of dryness and drought from the Plains to the Atlantic Seaboard, with a few dramatic exceptions. Most of interior Wisconsin recorded 2 to 5 inches of rainfall from north of Milwaukee into far southeastern Minnesota. Moderate to heavy rains were not as widespread elsewhere, with amounts exceeding an inch covering relatively small areas. The scattered areas of heavy rain included northeastern and part of southern North Dakota, northeastern South Dakota, a few areas from central Minnesota southward into central Iowa and southeastern Nebraska. Similarly, widely-scattered areas of 1 to locally 3 inches dotted the Midwest, lower Ohio Valley, central and southern Appalachians, and northern New England. But most of these regions recorded light precipitation, and other areas of dryness and drought across the contiguous states saw little or no precipitation. As a result, dry areas in the western Great Lakes region experienced significant improvement, but otherwise improvement was limited to relatively small, scattered areas where the heavy rains fell. Increased drought coverage and intensity was more common, as a large majority of these areas recorded light precipitation at best. Crops have been damaged by the lack of precipitation, with spring wheat and barley most significantly impacted. In primary producing states, 46 percent of the barley crop was in poor or very poor condition, compared to only 4 percent at this time last year. Similarly, about 60 percent of spring wheat in the primary producing states was in poor or very poor condition, compared to 7 percent at this time last year.
Northeast
Moderate rains eroded D0 from a small part of central Maine, but light precipitation kept conditions essentially unchanged in the rest of New England. Farther south, where precipitation was scarce, D0 and D1 areas generally expanded across West Virginia, Maryland, and portions of Pennsylvania, with a small part of central Delaware recording enough rain to eliminate D0 there.
Southeast
Similar to conditions in West Virginia and adjacent Maryland, abnormal dryness expanded and some moderate drought was introduced in parts of central and southwestern Virginia and western North Carolina. And similar to several other regions, isolated heavy rainfall induced small areas of improvement in central Virginia and near the Kentucky border. The rest of the Southeast Region remained free of any dryness.
South
Areas of dryness and drought remained restricted to a few relatively small areas, but coverage increased from last week, and surface moisture depletion was exacerbated by abnormally hot weather. New or expanded patches of D0 dotted Tennessee, Oklahoma, and Texas, with broader D0 coverage introduced in central and northeastern Arkansas. Dry conditions are relatively short-lived in this region, but the hot, dry weather is quickly depleting soil moisture, and the region could see more substantial expansion and intensification of dryness as August progresses. A small area of moderate drought was introduced within the D0 in the eastern Red River Valley where 60-day precipitation totals were under half of normal.
Midwest
It was feast or famine across this region. Heavy rains produced a broken pattern of improvement across southern Minnesota, central and northern Iowa, and southern Wisconsin. In stark contrast, drought across central and northern Minnesota intensified, and precipitation on time scales ranging from a couple months to almost a year was deficient enough to prompt the introduction of D4 in northern Minnesota – the first time drought of such intensity was identified in the state. Three-month totals there were 5 to 8 inches below normal, and 6-month shortages approached 10 inches. Longer-term deficits are also affecting central and northern Iowa, but the past few months have been wetter there, so D2 to D3 conditions were more prevalent. Farther south and east, dryness expanded slightly in some locales from Missouri to Michigan and Ohio, but nothing more intense from D0 covers the northern Ohio Valley states. Crops remained stressed, especially spring wheat and barley. In Minnesota, 37 percent of the barley crop was in poor or very poor conditions, as was 40 percent of spring wheat.
High Plains
Similar to some other regions, small scattered areas of heavy rain induced localized improvement, but most areas received little rainfall at best, leading to increasing moisture deficits and thus expansion and intensification of dryness and drought. Some improvement was noted in southwestern North Dakota, but much broader areas of deterioration were observed across eastern North Dakota and many areas from South Dakota through Nebraska and Kansas. Drought intensities of D3 and D4 now cover large portions of the Dakotas. Limited precipitation fell on Colorado and Wyoming, but decreased impacts and localized moderate rains led to 1-category improvements in central Colorado and southwestern Wyoming.
West
Little or no precipitation fell on most of the region, and drought intensity remained unchanged from last week in most areas. Some improvement from recent monsoonal rains were introduced in southern Utah while conditions deteriorated in central Washington and a few isolated patches in northern Utah, western California, and northern Oregon. Crops in Washington have suffered because of the drought, with 93 percent of their spring wheat and 66 percent of barley in poor or very poor conditions. The dryness, exacerbated by periods of intense heat, has led to the rapid development and expansion of wildfires. The Dixie Fire in northern California has scorched hundreds of thousands of acres, making it the second-largest fire in the state’s history. Fires in the western half of the contiguous states (including Colorado and Wyoming) have burned, on average, 30 square miles of total area every day since early June – an area approaching half the size of Washington, DC.
Caribbean
In Puerto Rico, the situation was similar to the past few weeks, with abundant rainfall everywhere but the southern and northwestern coastal regions, where D0 and D1 conditions remain. Small areas of D0 and D1 were shaved off the northern reaches of the dryness across the southern tier.
The U.S. Virgin Islands received some rain, but not enough to alter the drought status. The 7-day precipitation estimates (QPE) indicated that St. Thomas received 0.50 to 1.0 inch over most of the island with higher amounts on the northern edge. St. John received 0.25 to 0.50 inch for the most part, also with higher amounts on the northern edge. St. Croix received 0.50 to 1.5 inches over most of the island, with much higher amounts in the northwest and 0.25 to 0.50 on the eastern end of the island. The islands began receiving rain from a passing tropical storm after the 8 a.m. EDT cutoff on Aug. 10, which may be cause for improvement next week.
St. John remained at D1-L. The Windswept Beach CoCoRaHS station reported 0.27 inches. Other CoCoRaHS stations reported 0.49 and 0.54 inches. The year-to-date rainfall was 73% of normal. The Susannaberg DPW 3 Well remained more than 18 feet below land surface, the lowest point since late 2017.
St. Croix remained at D2-SL. Precipitation at Henry Rohlsen AP amounted to 1.99 inches. The CoCoRaHS stations reported from 0.37 to 3.06 inches. The year-to-date rainfall was 74% of normal. The Adventure 28 Well was 26.50 feet below land surface and at the lowest point since late 2016.
St. Thomas remained at D0-L. Precipitation at Cyril E. King AP was 0.70 inches, or above normal. The CoCoRaHS stations reported from 0.24 to 1.05 inches. The year-to-date rainfall was 86.6% of normal. The Grade School 3 Well was 11.11 feet below land surface, which is an improvement from several months ago when it was 15 feet below land surface, but it is still a low level for the well.
Pacific
Moderate precipitation fell on portions of the dry regions in Alaska. From the Alaska Range northward, the only area that did not receive substantial precipitation was the northeastern interior, so areas of D1 and D0 improved in many locales. Farther south, significant precipitation eased D0 conditions from the Kenai Peninsula to the Anchorage area and the southern Susitna Valley. In contrast, little if any precipitation fell northeast of Anchorage, an area receiving only 50 to 60 percent of normal since the start of June. A new area of moderate drought was introduced there.
In Hawaii, windward areas of Maui and the Big Island have received robust precipitation so far in August. On the other hand, most leeward areas are still very dry, except on the Kona slopes of the Big Island. Upcountry farmers in Maui have seen major crop losses to deer, which lack forage elsewhere. Some water use restrictions are in place there. As a result, D3 conditions were expanded throughout central Maui and Kahoolawe. But the enhanced moisture in other places led to improvements on the east-facing slopes of Haleakala in Maui and on the east- and northeast-facing slopes of the Big Island.
The Republic of Palau received more than 2 inches of rain at Palaui IAP (Airai) and Koror COOP, keeping the area free of dryness.
The Mariana Islands need an inch of rain to meet minimum water needs and received more than that in the past week for Guam and Rota. The three measurements for Saipan were 0.79, 0.92 and 1.96 inches.
The Federal States of Micronesia were previously free of dryness and drought, but abnormal dryness was introduced for Lukunor and Kapingamarangi this week. Chuuk received 0.21 inches; Kapingamarangi reported 0.80 inches; Lukunor got 0.61 inches; and Pingelap received 1.97 inches. Precipitation exceeded the weekly minimum of 2 inches to meet minimum water needs for Kosrae, Nukuoro, Pohnpei, Ulithi, Woleai and Yap.
In the Marshall Islands, Ailinglaplap and Jaluit remained abnormally dry, while all other islands were free of dryness. Rainfall for the week was low at Kwajalein and Mili, receiving 0.93 inches and 1.07 inches, respectively. Majuro received nearly 5 inches of rain, and the reservoir was at 30.393 million gallons on Aug. 9.
American Samoa remained free of drought as Pago Pago received 2.31 inches; Siufaga Ridge, 1.71 inches; and Toa Ridge got 2.59 inches.
Looking Ahead
During the next 5 days (August 12 – 16, 2021) should see a resurgence of monsoonal moisture in the southern Rockies. Generally 1.5 to locally over 4.0 inches are forecast in the southeastern quarter of Arizona, the southern half of New Mexico, and part of northwestern Texas, with moderate rain expected in adjacent areas. Farther east, 1.0 to 3.0 inches of rain are expected from the North Carolina mountains into central Virginia, with isolated larger totals in the higher elevations. Moderate to heavy rains (1 to 2 inches) are anticipated in a swath from central Kansas into the southern Great Lakes Region, and across western Pennsylvania. Light to locally moderate rainfall (0.5 to 1.5 inches) should fall in northernmost New England, and in a broken pattern from northern Arkansas through the Middle Ohio Valley. Other areas in the central Plains and the lower Mississippi Valley can anticipate light to locally moderate rainfall. Little if any precipitation is forecast from the western Great Lakes Region across the northern half of the Rockies to the entire length of the West Coast, and over most of central and southern Texas. Temperatures will be near or above normal through most of the contiguous states, particularly from the central and northern Plains westward, where many locations could average 6 to 10 degrees F above normal. The only area expecting subnormal readings are the southern halves of Arizona and New Mexico, where unusually heavy precipitation will keep daytime highs 3 to 9 degrees F below normal.
The CPC 6-10 day extended range outlook (August 17 – 21, 2021) favors subnormal rainfall from the Northeast into the central Great Lakes Region, and southward into the Middle Atlantic Region. Dryness is also favored – though with lower confidence – in southern Texas, and from the Great Basin to the Oregon and lower Washington coasts. Enhanced chances for surplus rainfall cover a broad area across the Rockies, Plains, lower Ohio Valley, part of the lower Mississippi Valley, and the southeastern quarter of the country. Odds also favor above-normal precipitation in the areas of dryness and drought across Alaska. Meanwhile, warmer than normal weather is expected from the central and northern Plains eastward into the Middle Atlantic Region and Northeast to the Atlantic Coast. Chances for abnormal warmth top 70 percent from the northern half of the Great Lakes Region through New England, topping 80 percent in Maine and adjacent Vermont and New Hampshire. Increased chances of warmth also cover the Gulf Coast Region, southern Texas, and northern California. In contrast, mild conditions are favored in the Pacific Northwest, the Southwest, much of the Rockies, the southern High Plains, and across the Carolinas and much of Georgia.
Soil Conditions
 |
 |
 |
 |
Pan Evaporation.

The result of the drought is very dry soil conditions in some areas. There is also some very wet areas.
| Last Week | This Week |
 |  |
Drought Outlook


Since we are entering fire season it is time to be showing the wildland fire potential outlook. These will update automatically shortly after the month changes which is very soon.


Crop Progress Reports are covered in Part II.

NASS Reports The NASS Reports including Executive Briefings are covered in Part II
Intermediate-Term Weather Forecast
Showing from left to right, Days 1- 5, 6 – 10, 8 – 14, and Weeks 3 – 4 You can click on these maps to have them enlarge. Also, the discussions that go with these forecast maps can be found here (first two weeks) and here (Weeks 3 and 4).
First Temperature
|
|
|
|


And then Precipitation
|
|
|


The Week 3-4 Discussion is always interesting so we include it in the article. Since we are publishing this week on a Thursday, we will have to add it later probably Friday afternoon [this has been done]...it is released fairly late in the day. Similar discussions for the 6 -10 Day and 8 – 14 Day Forecasts are available here.
Week 3-4 Forecast Discussion Valid Sat Aug 28 2021-Fri Sep 10 2021
ENSO-neutral conditions persist in atmosphere and ocean observations across the tropical Pacific. The Madden Julian Oscillation (MJO) is active over the Indian Ocean, and is predicted by dynamical model RMM indices to progress eastward towards the Maritime Continent in the next week. Uncertainty increases substantially for the continued eastward progression of the MJO active phase in week 2. Continued progression of the MJO across the Maritime Continent would have potential impacts on the Week 3-4 period, though this is somewhat uncertain. The temperature and precipitation forecasts for the Week 3-4 period are based primarily on dynamical model guidance, including the GEFS, ECMWF, JMA, CFS, and the SubX multi-model ensemble (MME). Along with the potential impacts of the MJO, decadal trends, as well as the evolution from the week-2 forecast, were also considered.
Dynamical models show a fair amount of variability in the predicted circulation pattern for the Week 3-4 period, however there are some consistent large-scale features. A ridge and associated positive 500-hPa height anomalies are forecast over the Aleutians, extending into the North Pacific. Blends of dynamical model forecasts, including the SubX MME, predict troughing and slightly below normal heights downstream, over the Pacific Northwest. A ridge and generally positive 500-hPa height anomalies are predicted by most model solutions over the northern central CONUS. The location and strength of these anomalies vary between different models, so the manual blend of temperature and precipitation tools and the SubX MME consensus forecast tools were primarily used as guidance.
Above normal temperatures and below normal precipitation are likely for the Aleutians and southwestern Mainland Alaska, under the predicted ridge. Below normal temperatures are favored for parts of northwestern Mainland Alaska under anomalous northwesterly flow. Elsewhere, equal chances of above and below normal temperatures and precipitation are predicted for remaining regions of Mainland Alaska and the Alaska Panhandle.
Above normal temperatures are forecast across most of the western and central CONUS and the Northeast region, as a result of slightly positive mid-level height anomalies and decadal trends. Equal chances of above and below normal temperatures are forecast for parts of the Pacific Northwest and along the California coast, associated with predicted troughing over the region, and supported by the manual blend of temperature tools and the SubX MME forecast. Equal chances of above and below normal temperatures are also predicted for southern areas of the Southwest Monsoon region, with the prediction of continued precipitation for the region. Below normal temperatures are likely for the Gulf Coast region, as supported by most dynamical model temperature forecasts, and associated with both currently unusually high soil moisture conditions and a potential for tropical storm activity during the period.
Below normal precipitation is likely for much of the Pacific Northwest region, as indicated by blends of precipitation tools and the SubX MME consensus precipitation forecast. An active monsoon and above normal precipitation is predicted for much of the Southwest region by a consensus of dynamical model forecasts, and consistent with the potential impacts of the MJO at the start of the Week 3-4 period. Dynamical model forecasts predict enhanced Atlantic tropical activity and a break in the subtropical ridge leading to likely above normal precipitation for much of the Gulf Coast and Southeast regions. Under southerly flow, above normal precipitation is predicted for much of the Northern Plains region, in blended precipitation forecast tools and the SubX MME precipitation tool.
The SubX MME indicates increased probabilities of above normal temperatures for all of the Hawaiian Islands in the Week 3-4 period. Model forecasts indicate greater uncertainty for the precipitation outlook for Hawaii during the Week 3-4 period, so equal chances of above and below normal precipitation are predicted.
Sustainable Agriculture. (This will be covered in Part II)
Energy News (This will be covered in Part II)
International

Science Feature (This will be covered in Part II)
Environmental News (This will be covered in Part II)
Major Sources of Information Used in this Weekly Report. We will not be using them all each week but the reader is welcome to refer to these resources.
|


Sequence of drought occurrence and impacts for commonly accepted drought types. All droughts originate from a deficiency of precipitation or meteorological drought but other types of drought and impacts cascade from this deficiency. (Source and more information: NDMC)
Source: National Drought Mitigation Center, University of Nebraska-Lincoln


