Written by Sig Silber
Tonight we feature a review of June and a very unique video. In that video, the processes that take place in soil are related to the processes that take place in a larger economy such as a city, state, or nation. I found it fascinating. We cover all our regular topics including the crop Progress Report and the intermediate-term weather forecast.

Please share this article – Go to the very top of the page, right-hand side, for social media buttons. Please feel free to send this article to anyone who you think might benefit from reading it.
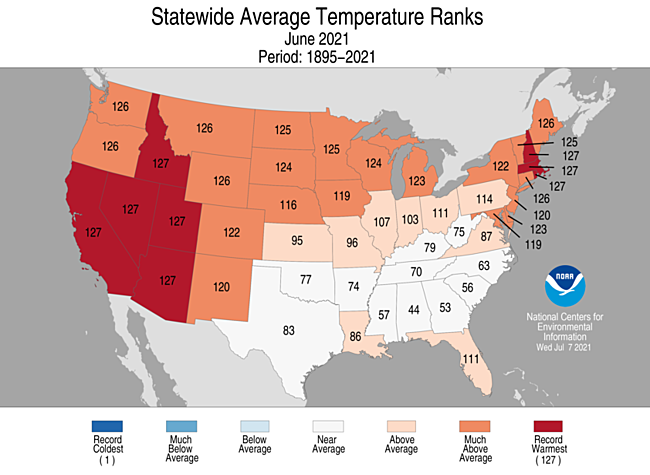
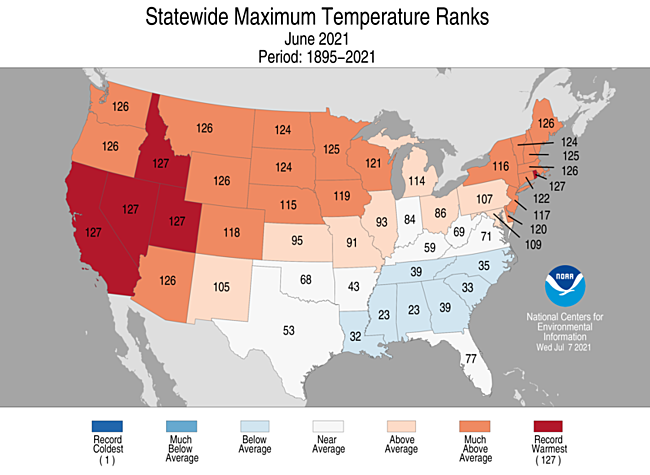
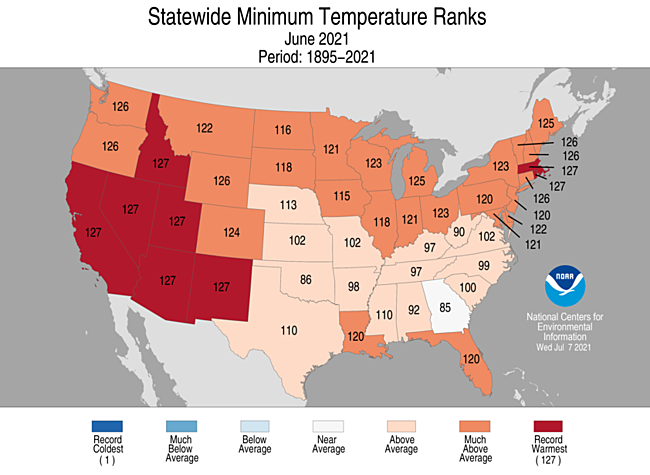
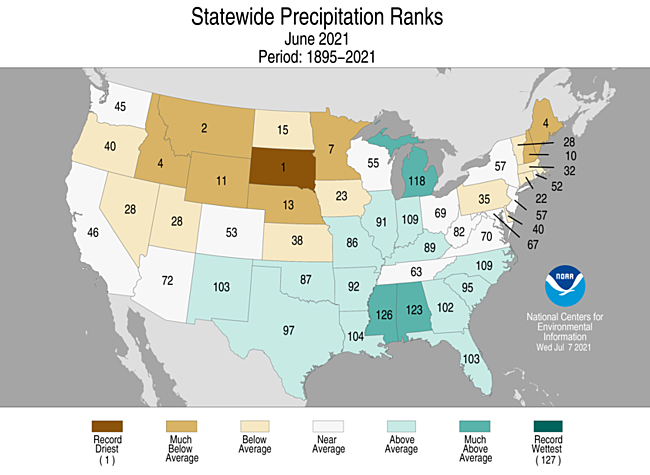
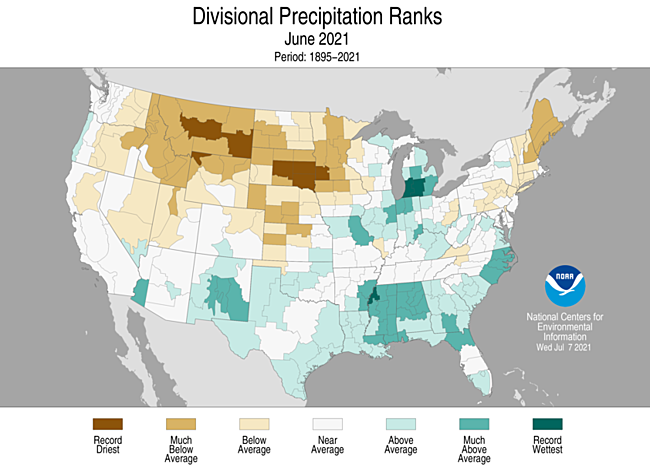
Looking back at June. Here states are ranked relative to their 127 years of recent history.
Sometimes it is useful to look at climate divisions.
Agriculture Sustainability Videos
Some of this is a little different, some actually very different…the speaker draws an analogy between the general economy and the micro-economy within the soil.


I love this video.
Reservoir Conditions
We might as well show the situation for the California Reservoirs here.

Here is what the SNOTEL data is telling us about Spring/Summer runoff. I am just showing the basin view.

And it is always useful to look at the last seven days.

I think we have all gotten sick at looking at the water year to date which by now does not change unless there was a Noah’s Ark event. So I am not showing it.
Let’s look at the current drought situation.


Here we look at four time periods: one week, one month, six months, and a full year.

Drought Discussion (The Regional links are live and will take you to the drought map for that Region)
This Week’s Drought Summary
The U.S. experienced the extremes this week, with expansion of drought in the West, a robust Southwest Monsoon in the Southwest, a tropical storm making landfall in the Southeast, and extreme flooding in southeastern Texas. In the West, mid-level ridging has resulted in much above-normal temperatures for the western third of the CONUS, exacerbating drought conditions in the Pacific Northwest, northern Great Basin, Northern Rockies, and along the Front Range. Above-normal temperatures also pushed into the northern High Plains, warranting further deterioration of drought conditions in locations where rainfall remained below-average for the week. The central and eastern Corn Belt was a battle ground of sorts, with some locations seeing improvement with this week’s heavy rainfall, while other locations missed out, warranting some degradation due to antecedent dryness. New Mexico and West Texas saw targeted reductions in drought coverage due to heavy precipitation associated with the robust Southwest Monsoon. In the eastern U.S., Tropical Storm Elsa made landfall and moved up the East Coast leaving in its wake a large swath of more than 2 inches of rainfall, with several locations receiving 5 to 10 inches of rainfall. The extra-tropical transition of Elsa warranted moderate drought (D1) removal along the Virginia/North Carolina border with 1-category improvements elsewhere along Elsa’s path up the East Coast. Frontal activity prior to Elsa’s passage warranted improvements to interior areas of the Northeast. Fire risk remains high across the West.
Northeast
Most of the Northeast is the beneficiary of much above-normal precipitation this week in the form of increased frontal activity and the passage of Tropical Storm Elsa along the Eastern Seaboard, with many locations receiving anywhere from 2 to 5 inches of rainfall, and exceeding 5 inches in some cases. This results in 1-category improvements in northwestern Pennsylvania and much of the southeastern half of New England, with the latter mainly corresponding to Elsa’s path. Unfortunately, Cape Cod, Nantucket, and Martha’s Vineyard missed out on the heavier amounts this week. This results in a status quo D1 (moderate drought) depiction for Cape Cod, which continues to suffer ground water depletions, while Martha’s Vineyard and Nantucket deteriorated to D0 and D1, respectively, as percent of normal precipitation has continued to drop over the past two months.
Southeast
Tropical Storm Elsa made landfall in the Big Bend of Florida on Wednesday, July 7. Before landfall, Elsa dropped anywhere from 5 to 8 inches of rainfall along much of the Florida Gulf Coast, but missed the remaining D0 (abnormally dry) area near the southern tip of the Florida Peninsula. Once making landfall, it continued to track northward and eastward along the I-95 corridor, leaving in its wake a swath of 3 inch and greater precipitation amounts (well in excess of 5 inches in some locations) from eastern Georgia to southeastern Virginia before moving into the Northeast. The swath of heavy precipitation was more than plenty to eliminate the ongoing abnormal dryness in coastal South Carolina and portions of central North Carolina and south-central Virginia. It was also enough to eliminate D1 (moderate drought) along the Virginia/North Carolina border. Unfortunately, the foothills and mountainous areas from Virginia to South Carolina were not so lucky, as 7-day precipitation was lacking, adding to short-term deficits (2 to 6 inch deficits in the last 90 days). D0 (abnormal dryness) was expanded slightly in upstate South Carolina and from Virginia into West Virginia in locations experiencing similar deficits.
South
A localized area of low pressure brought severe flooding to much of southeastern Texas, with many locations in and around the Houston metro area receiving 10 to 15 inches of rainfall. Some of the precipitation associated with this system made it farther westward, resulting in 1-category improvements (D0 and D1) along the Rio Grande. Western Texas, and extending into New Mexico, is experiencing improved ground conditions with this week’s rainfall, but also with antecedent conditions related to the early onset and robustness of the Southwest Monsoon, warranting 1-category improvements in the Trans-Pecos region and western parts of the Panhandle. Farther east in the Tennessee Valley, D0 coverage was reduced for many locations receiving 2 inches or more of rainfall. However, where the heavier amounts were not observed, short-term deficits continue to mount, with parts of northeastern Tennessee experiencing an expansion of abnormally dry (D0) conditions, with a small area deteriorating to moderate drought (D1) conditions, where 90-day deficits have increased to around 6 inches.
Midwest
Much of this week’s rain fell over the central and eastern Corn Belt and parts of the central Great Lakes. Where the heaviest rainfall was not observed, 1-category degradations were in order. This was particularly the case across much of central and northern Minnesota, where soil moisture percentiles have dropped to below the 5th percentile, D2 to D4 30 to 90-day SPIs depict the greatest coverage, and several USGS stations are reporting 7 to 28-day average stream flows that are below the 10th percentile. Farther south, Iowa and northern Illinois experienced a mix of improvement and deterioration based on where the heaviest precipitation fell or did not fall, respectively. This region has become a bit of a battleground in that respect, due to the antecedent, longer-term dryness (several locations experiencing 25 to 50 percent of normal precipitation in the last 90 days) and the recent heavy rains cutting into some of those deficits. Across the remainder of the central and eastern Corn Belt and the central Great Lakes, this week’s rainfall warranted 1-category improvements to D0 (abnormally dry) to D2 (severe drought) areas across the lower peninsula of Michigan and D0 areas in the Ohio Valley.
High Plains
The western half of the High Plains Region experienced above-normal average temperatures this week underneath a mid-level ridge, while the eastern half experienced below-normal average temperatures, associated with increased cloud-cover and heavy rainfall for several locations. Improvements were mainly designated to the Middle Missouri River basin, encompassing parts of eastern South Dakota and northeastern Nebraska, which received more than 2 inches of rainfall (more than 1 inch above-normal for the week). Elsewhere in the Dakotas, Nebraska, and Kansas, below-normal precipitation coupled with antecedent dryness warranted several 1-category deteriorations. In the western half of the High Plains Region, deteriorations were more a function of above-normal temperatures helping to exacerbate ongoing drought conditions in the Eastern Rockies and along the Front Range. Furthermore, this region is void of snowpack due to the below-normal rainy season in the West leading up to this period of above-normal temperatures since Spring, which has caused further depletion of soil moisture, stream flows, and ground water in many locations.
West
Extreme, record-breaking heat leading up to this week has resulted in rapid deteriorations in drought conditions across the Pacific Northwest, northern Great Basin, and Northern Rockies. Although the largest positive temperature anomalies shifted southward into the Desert Southwest and Four Corners Region this week, above-normal temperatures persisted across in the northwestern CONUS, resulting in continued degradations of drought conditions from the Pacific Northwest eastward to central Montana. A small area of improvement was warranted in northeastern Montana, where 1 to 2 inches of rainfall resulted in modest improvements to soil moisture and short-term SPIs. Farther southward in New Mexico, the robust Southwest Monsoon has resulted in drastic improvements in recent weeks. This week is more of the same, with several 1-category improvement across central and eastern portions of the state. In some cases, moisture has seeped several feet into the soils, at least down to 200 cm (per NASA SPoRT and ground reports). Improved shallow ground water conditions also support the improved depiction this week. However, fire concerns remain across the West as a whole, as there have been nearly 40 new wildfires reported since July 10 (89 as of July 14).
Caribbean
In Puerto Rico, small reductions in D0 (abnormally dry) coverage was warranted in the northeast, south-central, and Vieques (east of the main island), based on USGS average stream flows and wetter than normal conditions in the last 30 to 60 days.
Low rainfall amounts this week combined with sinking groundwater levels to maintain dry conditions on St. John, St. Thomas, and St. Croix again this week. Long-term abnormal dryness continued on St. Thomas, and long-term moderate drought continued on St. John. Short- and long-term severe drought continued this week on St. Croix.
Pacific
No changes were warranted to abnormally dry (D0) areas in Alaska this week.
Hawaii saw degradation from D2 (severe drought) to D3 (extreme drought) conditions in southern Maui and D2 expansion to the northern coast of the Big Island, as precipitation associated with the easterlies did not make it to the leeward slopes, resulting in a continued decline in range conditions and forage.
This week, rainfall measurements in Palau were 4.08 inches at the airport and at least 3.70 at the cooperative network site. Given these amounts, drought-free conditions continued for another week.
In American Samoa this week, rainfall ranged from 0.73 inches at Toa Ridge to 1.27 inches at Suifaga Ridge to 1.69 inches (with a missing day) at Pago Pago, and drought-free conditions continued there.
Saipan, Rota, and Guam all remained free of drought or abnormal dryness this week. On Rota, while conditions in the middle and latter part of June were drier, the last two weeks have seen 1.63 and 1.12 inches of rainfall, respectively. On Guam, 1.66 inches of rain fell this week. On Saipan, measured rain amounts reached as high as 2.17 inches.
In the Republic of the Marshall Islands, Ailinglapalap remained in short-term abnormal dryness. There, 1.15 inches of rain fell this week, continuing a stretch of weeks with mostly below 2 inches of rain. Kwajalein had their short-term abnormal dryness end this week with 3.26 inches of rain falling. Wotje received 8.57 inches of rain, and short- and long-term abnormal dryness ended. On Jaluit, only 0.85 inches of rain fell this week, marking the fifth consecutive week with less than 2 inches of rain. However, June’s total rainfall was 11.65 inches (largely due to a very wet first week of the month), so normal conditions continued for now. On Majuro, the week’s rainfall totaled 1.44 inches, marking the third consecutive week with less than 2 inches of rain. However, wet conditions before that kept any abnormal dryness at bay. Mili received 1.29 inches of rain, though with the previous three weeks being much wetter, conditions remained normal. No drought depiction was made for Utirik this week, as the data were missing.
All locations analyzed in the Federated States of Micronesia remained free of drought or abnormal dryness this week. Data at Fananu and Ulithi were missing, so no drought depictions were made there this week. On Yap, 1.01 inches of rain fell, marking the second consecutive week with less than 2 inches of rain; however, rainfall in May and June was sufficient. Woleai received 4.24 inches of rain this week, bringing their July total to 7.38 inches. Chuuk received 1.23 inches of rain this week, breaking a streak of three consecutive weeks with at least 2 inches of rain. Lukunor’s weekly rainfall totaled only 0.87 inches, though this came on the heels of 4.88 inches last week. Nukuoro received 3.39 inches of rain this week, bringing their weekly July total to 6.98 inches. Two inches of rain were recorded on Kapingamarangi, bringing their July total up to 9 inches. Pohnpei received 4.70 inches of rain, continuing a wet recent history for them. On Pingelap, 5 inches of rain fell, bringing their July total to 6.55 inches. Wet weather continued in Kosrae, where 6.55 inches of rain fell this week.
Looking Ahead
During the next 5 days (July 15 to 19), the West Coast, much of the Great Basin, and the Northern Rockies are favored to remain dry. Conversely, precipitation associated with the Southwest Monsoon is expected to continue across the Four Corners Region. In the eastern half of the U.S., a frontal boundary extending from the Central Plains to the Great Lakes is expected to move southward toward the Gulf Coast, bringing with it the potential for many areas from the Central Plains and Mississippi Valley to the East Coast to receive more than an inch of rainfall, with the highest amounts (2 inches or greater) extending from the Central Plains to the eastern Great Lakes. Maximum temperature anomalies are expected to increase across the Northern Tier (10°F to 15°F positive anomalies), while the southern half of the CONUS will experience seasonal to below-normal temperatures (less than 10°F negative anomalies).
The CPC 6-10 day extended range outlook (valid July 20 to 25) favors enhanced odds for above-normal temperatures across much of the West and Northern Tier eastward to the Great Lakes, underneath anomalous mid-level ridging. Enhanced odds for below-normal temperatures are favored across much of the Southern Tier of the CONUS and into the Northeast, associated with a weakness in the ridge in the west-central CONUS and troughing in the East. Below-normal precipitation across the Northern Tier is associated with the anomalous ridge over the western-central CONUS, with below-normal precipitation probabilities extending to the Northeast. An enhanced Southwest Monsoon favors increased precipitation chances in the Southwest and large portions of the Great Basin. Above-normal precipitation probabilities along the Gulf Coast and westward into Texas are associated with a mean frontal boundary. In Alaska, mid-level troughing over the Bering Strait increases odds for below-normal temperatures and above-normal precipitation across the Southwest and West Mainland, respectively, and eastern Aleutians. The eastern Alaska Mainland and Panhandle favor above-normal temperatures and below-normal precipitation, respectively, underneath a mean ridge.
Soil Conditions
The result of the drought is very dry soil conditions in some areas. There is also some very wet areas.

 |
 |
 |
 |

Drought Outlook


“Latest Seasonal Assessment – During the last four weeks, below-normal precipitation and an unprecedented heat wave in the Northwest abetted drought expansion and intensification in the West. At mid-July 2021, drought covered the Upper Midwest, the northern Plains, and almost all areas from the Rockies westward. Conditions promoted the rapid development and expansion of western wildfiress during the first half of July. Warmer and drier than normal conditions also prompted significant drought expansion across Hawaii. Meanwhile, farther south and east, a slow decline in drought extent and intensity continued. South and east of the northern Plains, drought is now restricted to parts of the Great Lakes, the upper Northeast, and southern Puerto Rico. This general pattern is expected to continue through October, with further improvements in the central and eastern states, and more expansion and intensification in the northern Plains, Rockies, Far West, and Hawaii. Any improvement there should be limited to the southern sections of the High Plains and Rockies, where heavy monsoon-related showers and thunderstorms are expected during the first few weeks of the period. Some abnormal dryness has developed recently in southern and eastern Alaska, but no drought development is expected there.”


Since we are entering fire season it is time to be showing the wildland fire potential outlook. These will update automatically shortly after the month changes.


Crop Progress Reports
 |
 |
 |
 |
 |
| Crop | Crop Progress | Crop Condition |
| Corn | Percent Silking and dough OK | Slight worse than last year. Mostly due to the Dakotas. |
| Soybeans | Blooming and setting pods OK to good. | Not so great. Mostly due to the Dakotas and Minnesota.. |
| Cotton | Squaring and setting bolls a bit slow possibly due to Louisiana. But it is a bit early. | Good |
| Winter Wheat | Harvested slow | NA |
| Spring Wheat | Headed very good | Very poor in the Dakotas and Washington State and Montana. |
| Sorghum | Headed and Coloring OK | Quite good |
| Rice | Headed Slow | OK |
| Oats | Headed Good | Poor compared to last year in the Dakotas, Texas and Minnesota. |
| Barley | Headed good | Very poor North Dakota, Washington State, and Montana. |
| Peanuts | Pegging OK | OK |
| Sugar Beets | NA | NA |
| Sunflowers | MA | NA |
| Pasture and Range | Poor especially Washington and Oregon |
Additional Information can be found here. Pretty much it is the same information as shown in the above tables but at the end there is some information on the methodology used.


NASS Reports
We were not sufficiently tempted by any of the reports available here. But that link will take you to all of the reports.
Intermediate-Term Weather Forecast
Showing from left to right, Days 1- 5, 6 – 10, 8 – 14, and Weeks 3 – 4 You can click on these maps to have them enlarge. Also, the discussions that go with these forecast maps can be found here (first two weeks) and here (Weeks 3 and 4).
First Temperature
|
|
|
|


And then Precipitation
|
|
|


The Week 3-4 Discussion is always interesting so we include it in the article. Similar discussions for the 6 -10 Day and 8 – 14 Day Forecasts are available here.
Week 3-4 Forecast Discussion Valid Sat Jul 24 2021-Fri Aug 06 2021
The Madden-Julian Oscillation (MJO) became increasingly coherent over the past week, with the enhanced convective phase over the Indian Ocean. Model-based MJO forecasts generally depict eastward propagation of this signal over the next two weeks, with differences in the predicted amplitude. Despite the increase in the intraseasonal signal, the MJO does not teleconnect strongly onto the Northern Hemisphere midlatitude pattern during the Boreal summer months, yielding little potential for a substantial pattern change originating from tropical convection. ENSO-neutral conditions also remain in place, and therefore long term trends remain the dominant driver in the statistical guidance for Week 3-4. The primary contribution from the increased MJO activity may be reduced potential for Atlantic tropical cyclone activity during late July and early August.
The dynamical model 500-hPa height anomaly guidance is generally consistent and quite similar to last week’s forecast, demonstrating the persistence of the broad scale pattern over North America in the guidance. Above-average height anomalies are forecast across the Northern Tier, with some differences among the models on the placement of the mean ridge axis. This pattern favors a continuation of potential heatwave outbreaks across the Northwest and north-central CONUS, with dynamical model temperature outlooks all depicting fairly high probabilities for above-average temperatures, albeit slightly lower than what was depicted last week. The height field across the rest of the U.S is fairly weak, which is typical during the Boreal summer months, and surface conditions such as soil moisture may play a role in the placement and extent of the temperature anomalies.
Consistent with the height anomaly and dynamical model temperature forecasts, the Week 3-4 outlook favors above average temperatures extending from the Northwest through the Central Rockies, northern Plains, and the upper Midwest. The autoblend of dynamical and statistical model guidance also depicts enhanced chances for above-average temperatures across New England, which are included in this outlook. Lower confidence in the temperature outlook exists across the remainder of the eastern third of the CONUS. Most of the dynamical models favor below-average temperatures along parts of the southern tier, and the ECMWF extends the area of favored below-average temperatures across much of the East. This signal is likely due to feedback in the model from enhanced soil moisture, and may be overdone. Therefore, below-average temperatures are favored across Texas and the Southeast where there is dynamical model consensus, and equal chances for below- and above-average temperatures are maintained for the Midwest.
Consistent with the forecast ridging, below-average precipitation is favored for the Northwest and Northern Plains. Most of the dynamical model guidance also extends enhanced chances for below-average rainfall southward across the Plains into Texas. The exception is the ECMWF, which depicts enhanced chances for above-average rainfall across most of Texas. Therefore, the outlook maintains equal chances for below- and above-average precipitation for most of Texas, with below-average favored across northern Texas and above-average favored for the Big Bend in association with monsoonal moisture. Dynamical models continue to show enhanced monsoon precipitation across the Four Corners, with the highest probabilities across Arizona. Enhanced chances for above-average precipitation extend into the Great Basin and as far north as Wyoming, though climatological precipitation in these regions is fairly light. Below-average rainfall is favored for the Florida Peninsula, as most of the dynamical model guidance depicts a suppressed pattern across the Gulf of Mexico and western Atlantic.
Enhanced chances for above-average temperatures across Alaska extend across the western and northern parts of the state, consistent with dynamical model guidance. Equal chances for above- and below-average temperatures are maintained across central and southeastern Alaska due to weaker signals. Similar to last week, enhanced precipitation is favored for western Alaska and along the North Slope, while below-average precipitation is more likely for southeastern Alaska and the Panhandle.
A multi-model ensemble mean of the Subseasonal Experimental (SubX) guidance depicts high probabilities for above-normal temperatures across most of Hawaii. Model depicted precipitation anomalies are quite small across the islands, but the SubX MME slightly favors above-average precipitation for the Big Island.
Energy News
No Report this week.
International

Science Feature
No Science Feature this week. We plan to review the February Winter Storm next week. F E B R U A R Y 2 0 2 1 E X T R E M E C O L D , S N O W ,
A N D I C E I N T H E S O U T H C E N T R A L U . S .ASA/NOAA
Environmental News
Nothing to report this week
Major Sources of Information Used in this Weekly Report. We will not be using them all each week but the reader is welcome to refer to these resources.
|


Sequence of drought occurrence and impacts for commonly accepted drought types. All droughts originate from a deficiency of precipitation or meteorological drought but other types of drought and impacts cascade from this deficiency. (Source: NDMC)
Source: National Drought Mitigation Center, University of Nebraska-Lincoln


