Written by Sig Silber
The EPA and the Army Corps of Engineers want to revise the definion of “Waters of the United States” (WOTUS). I guess that will happen now with every change of Administraton. NOAA says we may have a short revisit of La Nina this winter. Crop production continues to look good but not as good as recently. The weather may be catching up with it. In addition to the usual Crop Progress Report, there is an Executive Briefing that covers a number of crops but focuses on wheat. See our latest video in our weekly education program on sustainable agriculture. It is another long one this week but not as long as last week and it is not my favorite but it provides another perspective.

Tonight’s article contains all of our regular features and as usual, we include an intermediate-term weather forecast. I always enjoy the State Rankings with respect to temperature and precipitation. We also provide the latest NOAA update of the ENSO situation and forecast. I have also included some regional reports.
Please share this article – Go to the very top of the page, right-hand side, for social media buttons. Please feel free to send this article to anyone who you think might benefit from reading it.
ENSO Update [The WOTUS Proposal is at the End of the Article under Environmental News]


Contrasts


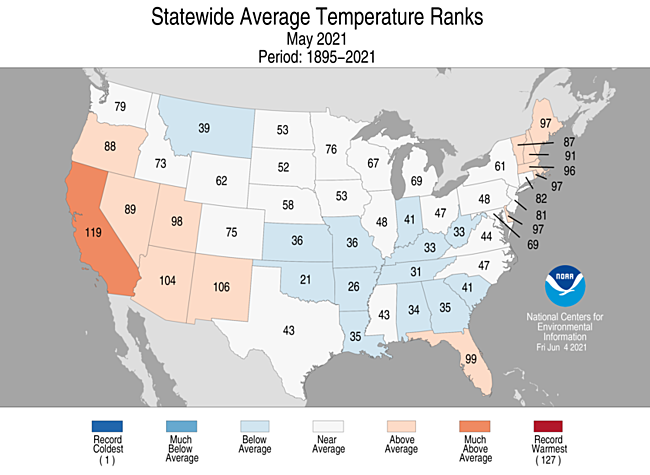
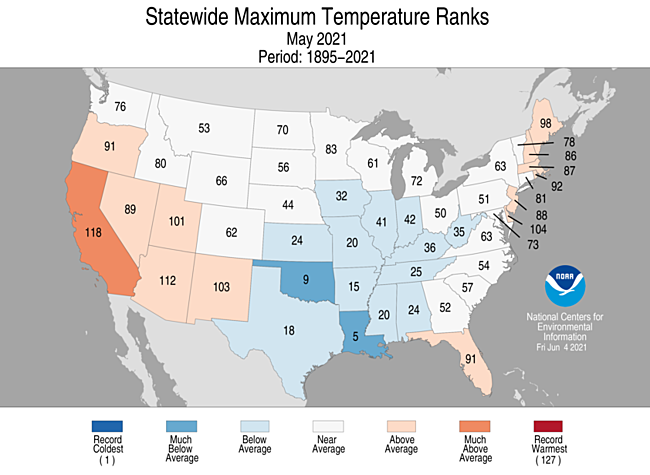
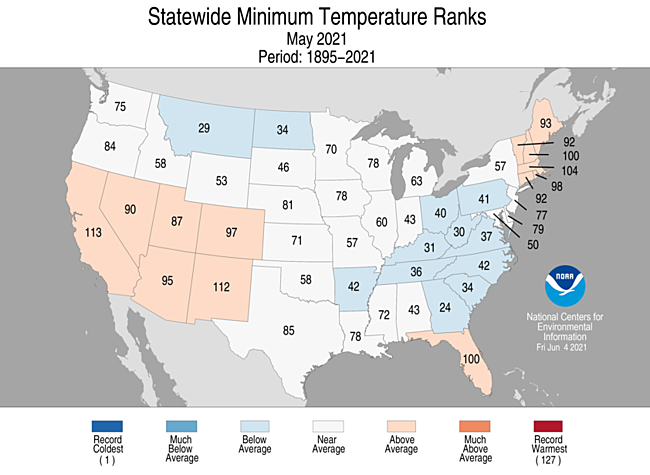
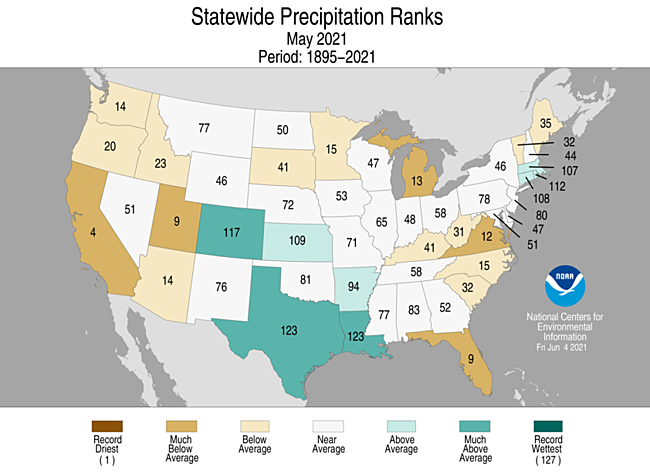
State Rankings for May with respect to temperature and precipitation. A state is ranked in terms of where May 2021 fits within the 127 Mays in the history of that state. So if it is the warmest in 127 years it would be ranked 127th and set a record. If is the coldest it would rank 1 and also set a record. Most will fit somewhere in between.

Here is a NOAA Summary Report on May

Despite a warm spring and year to date, May 2021 was just about average for both temperature and precipitation across the U.S., according to scientists from NOAA’s National Centers for Environmental Information.
But May also brought the first named Atlantic tropical storm of the hurricane season, Ana, near the end of the month.
Below are highlights from our May U.S. monthly climate report:
Climate by the numbers
May 2021
The average May temperature across the contiguous U.S. was 60.4 degrees F (0.2 of a degree above the 20th-century average), which ranked in the middle third of the 127-year record.
Below-average temperatures covered the northern Rockies, Central and Southern Plains, central Gulf Coast, Southeast and the Ohio Valley. The month saw above-average temperatures across parts of the West Coast, Southwest, New England and Florida.
The average precipitation for May was 2.94 inches (0.03 of an inch above average), which ranked in the middle third of the record.
A soggy setup brought the fifth-wettest May to Louisiana and Texas. California had its fourth-driest May, while Florida and Utah saw their ninth driest.
Meteorological spring and the year to date (YTD)
The average temperature for the contiguous U.S. during meteorological spring (March through May) was 52.6 degrees F (1.7 degrees above the 20th-century average), which ranked in the warmest third of the record. With a precipitation total of 7.53 inches (0.41 of an inch below average), this spring placed in the driest third of the climate record and was the driest since 2006.
The average U.S. temperature for the year to date (January through May) was 44.6 degrees F (1.3 degrees above average) and ranked in the middle third of the record. The first five months of 2021 were also quite dry, with a precipitation total of 11.65 inches — 0.74 of an inch below average — making it the driest YTD since 2012.

[Click to Enlarge the Above Image]
Other notable May climate highlights
Flooding emergency for parts of the Gulf Coast: Slow-moving thunderstorms dropped torrential rainfall across portions of coastal Texas and Louisiana on May 17-18, which resulted in widespread flash flooding, power outages and hundreds of water rescues. More than 1 foot of rain fell near Lake Charles, Louisiana, an area still recovering from damage caused by Hurricanes Laura and Delta last summer.
Early tropical storm sets record: Tropical Storm Ana formed in the Atlantic Ocean on May 22, making it a record seventh-consecutive hurricane season where at least one named storm formed in the Atlantic Basin before the official start of the season on June 1.
Drought improved overall, but some states got even drier: According to the U.S. Drought Monitor offsite link, 43.7% of the contiguous U.S. was in drought, down 4.7% from the end of April. However, drought intensified or expanded across California, Oregon, Washington, the northern Plains, parts of the Great Lakes, Puerto Rico and Hawaii.
Crop Situation Executive Briefing


Regional Conditions
The Southeast


Reservoir Conditions
Western Reservoirs

We might as well show the situation for the California Reservoirs here.

Let’s looks at some other information now.

We update the above map each time we publish but more frequent updates can be obtained here.
Here is what the SNOTEL data is telling us about Spring runoff. I am just showing the basin view.

And it is always useful to look at the last seven days.

I think we have all gotten sick at looking at the water year to date which by now does not change unless there was a Noah’s Ark event. So I am not showing it.

Let’s look at the current drought situation.


Here we look at four time periods: one week, one month, six months, and a full year.

Drought Discussion (The Regional links are live and will take you to the drought map for that Region)
This Week’s Drought Summary
Warm and dry conditions dominated the West while the southern Plains and South recorded the most precipitation for the week as well as cooler than normal temperatures. Temperatures were 3-6 degrees below normal over much of the southern Plains, and into the lower Mississippi Valley. Warmer than normal temperatures dominated from California to the Dakotas with departures of 9-12 degrees above normal and even higher in the northern Plains. With the active pattern continuing over the southern Plains, conditions have flipped over the last several weeks from one of drought to ample precipitation. A reassessment of conditions in several places in the West and northern Plains led to improvements, in light of some of the wetter conditions recently.
Northeast
Temperatures for the week were 4-8 degrees above normal, with portions of Vermont, New Hampshire, and Maine 8-12 degrees above normal. Precipitation was spotty with most areas dry, but pockets of above-normal precipitation were scattered throughout the region. Moderate drought conditions were expanded over western Maine and into northern New Hampshire and Vermont while abnormally dry conditions were increased over northern New York, eastern Massachusetts and west central New Jersey. Some abnormally dry conditions were removed in northern New Jersey and southern New York as well as in southern New Jersey.
Southeast
Most of the region recorded above-normal precipitation for the week, with only areas of northern Florida, western North Carolina, and portions of central and southern Georgia below normal. Temperatures this week were near normal to slightly below in the western areas of the region. Where the greatest rains fell along the coastal region of the Carolinas, improvements were made to severe and moderate drought, and the amount of abnormal dryness was reduced. Southern Georgia into northern Florida remained dry with a large expansion of abnormally dry conditions based on the short-term indicators. Central Florida had some rain, which allowed for some improvements to the abnormally dry conditions there. Rain in Tennessee alleviated abnormally dry conditions in the central area and portions of the eastern parts of the state.
Midwest
Temperatures were cooler than normal in the southern extent of the region and well above normal in the north. Departures were 9-12 degrees above normal in Minnesota and Wisconsin while they were 3 degrees below normal in southern Missouri and Illinois. Outside of western Kentucky, southern Illinois, southern Indiana and into northern Ohio, the rest of the region was drier than normal for the week, with very little rain at all in the upper Midwest. With the short term being quite dry and warm, drought expanded and intensified in much of the region this week. Moderate drought and abnormally dry conditions expanded in Minnesota, Wisconsin, and Iowa, where almost the entire region of each state saw degradation. Michigan had a large expansion of severe drought and moderate drought as well as an expansion of abnormally dry conditions in the upper peninsula. Some slight expansion of abnormally dry and moderate drought took place over northern portions of Illinois and Indiana while some abnormally dry conditions were removed from Indiana and Kentucky.
High Plains
A mostly dry week for the region, with some late precipitation in the period over North Dakota that will be addressed next week when the full extent of the rains can be taken into account. Some areas of Colorado had above-normal precipitation for the week. Temperatures were well above normal in the Dakotas where widespread areas of 12-15 degrees above normal were observed, with several places over 100 degrees F. Farther south in the region, the temperatures across Kansas were below normal. Portions of southwest North Dakota and northwest South Dakota were reassessed this week to take into account the wetter pattern lately. Improvements to the severe and extreme drought conditions were made based upon this reanalysis of data. In Nebraska, moderate drought and abnormally dry conditions spread over the northeast to central portions of the state, with some severe drought being introduced in the far northern counties. Southeast South Dakota had drought expand and intensify, with more moderate and severe drought being introduced. The plains of Colorado remained wet and further improvements were made to the abnormally dry and moderate drought conditions in the central portion of the state. Degradation took place in Wyoming where extreme drought was introduced in the northeast and moderate and severe drought expanded in the central and southwest portions of the state, with just a small pocket improved in the southwest.
South
With a continued wet pattern, temperatures were well below normal, with departures of 6-8 degrees below normal in portions of Texas and Oklahoma. The greatest rains fell from east Texas into the lower Mississippi Valley, but there were pockets of heavier rain from south Texas into the central portions of the state. As in past weeks, the wet pattern of the current week as well as a reassessment of conditions over the last 6-8 weeks allowed for continued and multi-category improvements over portions of Texas. The only extreme and exceptional drought left in the state is in the Trans-Pecos region.
West
A very dry week for the region, with only areas of New Mexico, northeast Arizona, western Colorado and northwest Washington having above-normal precipitation. Temperatures were well above normal with most areas 3-9 degrees above normal for the week. A reassessment of conditions in eastern New Mexico took place after the most recent rains, and this led to improvements in the region, with some being multi-category for the week. Eastern Washington saw conditions continuing to decline, and an expansion of moderate, severe, and extreme drought took place this week. Oregon was similar with widespread areas of degradation in the state and expansion of exceptional, extreme, severe, and moderate drought. Idaho also had widespread degradations with expansion of extreme, severe, and moderate drought and also a new introduction of exceptional drought. California continued to see the impacts of drought increase, and there was expansion of extreme and exceptional drought in the northern and central areas as well as along the coast of central California. A small area of exceptional drought was expanded in central Utah. As with the conditions in the northern Plains, some areas of eastern Montana were reassessed this week and a large area of extreme drought was removed while other areas of the state had an expansion of severe and moderate drought. Some of these same areas improved in Montana received rain after the cut-off for this week and could see further improvements next week.
Caribbean
Some heavy rains on Puerto Rico allowed for improvements on the eastern side of the island, with abnormally dry and moderate drought conditions showing some improvements.
Drought persists across the U.S. Virgin Islands, although increased rainfall in St. Thomas prompted improvement to D1 there. St. Croix and St. John remain in severe drought. King Airport near Charlotte Amalie in St. Thomas has recorded a fairly-typical 6.3 inches of rain in the last 9 weeks, following a four-month period (December 2020 – March 2021) with less than 4 inches of rain. Even though these are the driest months of the year at St. Thomas, the observed totals were less than half of normal.
The first week of June brought about ¾ of an inch of rain to Rohlsen Airport near Christiansted in St. Croix, which is slightly more than normal; however, this followed 10 consecutive months with below normal rainfall. About 23 inches of rainfall has accumulated since August 2020, which is nearly a foot below normal.
Windswept Beach in St. John recorded a near-normal 0.63 inch of rainfall for the week, but of the 15 weeks since late February, just 3 were wetter. Of the past 105 days, only 4 received more than 1/4 inch of rain, and less than 7.5 inches has fallen since February 1, 2021.
Pacific
In Hawaii, the trade winds continued to bring rainfall to the east-facing windward slopes. With the exception of Kona on the Big Island, leeward areas have been drier than normal. Degradation was widespread this week, with moderate drought introduced on Niihau and expanded on Oahu. Severe drought was expanded on both Molokai and Maui and moderate drought expanded on Lanai. Kahoolawe had severe drought introduced while moderate drought expanded on the Big Island. Abnormally dry conditions were improved in eastern Alaska based upon the recent rain and snow in the region.
Most locations across the U.S.-affiliated Pacific Islands have received sufficient to abundant rainfall the past few months, with impactful dryness limited to the northeastern Marshall Islands and the southernmost sections of Micronesia.
Some sites across the Marianas recorded below-normal rainfall from late winter into spring, which is a relatively dry time of year climatologically. In Guam, 6.7 inches fell during February – April 2021, or about 60 percent of normal. But May rains were more generous, topping 7 inches (170 percent of normal). Significant dryness is not an immediate concern, although rainfall around Saipan was only a few tenths of an inch above normal from May through early June.
Nearly 67 inches of rain doused Airai, Palau from February through early June 2021, compared to a normal closer to 40 inches.
Wet weather has also prevailed from western Micronesia through the southern and western Marshall Islands. Since March 1, totals in Micronesia ranged from about 26 inches at Ulithi to more than 87 inches at Kosrae – both near 150 percent of normal. Farther east, more than 60 inches of rain has doused Majuro since March, about twice the normal amount. Reservoirs there are only about 8 percent below the maximum.
Dryness remains problematic in the long term in southernmost Micronesia, and Kapingamarangi remains at D0(L) this week. Rainfall has increased markedly there since March. During the 10 months from May 2020 through February 2021, Kapingamarangi measured less than 39 inches of rain, or about 55 percent of (30 inches below) normal. Since then, over 47 inches have fallen in just over 3 months, which is almost double the normal. But despite the abundant rainfall of late, the effects of the earlier long-term dryness may be lingering though improving. A more definitive assessment of remaining impacts will occur later this month.
Significantly drier-than-normal weather persists at Wojte. Rainfall totals have not been sufficient to match typical water needs since late last year, and water conservation measures are in place. Since December 1, 2020 [just over 6 months], less than 15 inches of rain has fallen here, which is 8 to 9 inches below normal (63 percent).
In American Samoa, rainfall at Pago Pago has been below normal since spring, but enough to meet most water needs. March 1 – June 7, 2021 brought 26 inches of rain, or about 3/4 normal. In addition, July 2020 – February 2021 were exceptionally wet. More than 140 inches of rain pelted Pago Pago, exceeding normal by over 45 inches.
Looking Ahead
Over the next 5-7 days, it is anticipated that the best rains will be over the South, Southeast and into the Mid-Atlantic with some relief continuing in the northern Plains. Most all of the West remains dry, especially in the southwest, with some rain possible in the northwest. Above-normal temperatures will dominate the country with most areas from the West into the Midwest anticipating above-normal temperatures. Near-normal temperatures in the Southeast as well along the West Coast are expected.
The 6-10 day outlooks show the high probability of above-normal temperatures over most of the country from the Midwest and southern Plains to the West. Cooler than normal temperatures are anticipated in the East and to the Gulf Coast as well as into the lower Mississippi Valley and Texas. Below-normal precipitation is anticipated over most of the country, with the highest probabilities in the Midwest, northern Plains, northern Rocky Mountains and into the Great Basin. The highest probabilities of above-normal precipitation are along the Gulf Coast, northern Alaska and in Arizona.
Regional Reports
Soil Conditions
The result of the drought is very dry soil conditions in some areas. There is also some very wet areas.

 |
 |
 |
 |
Drought Outlook


Since we are entering fire season it is time to be showing the wildland fire potential outlook. These will update automatically shortly after the month changes.


Crop Progress Reports
 |
 |
 |
 |
 |
| Crop | Crop Progress | Crop Condition |
| Corn | Emerged looking good. | Just OK |
| Soybeans | Emerged looking very good | Just OK |
| Cotton | Planted and Squaring good | Two states not so good. |
| Winter Wheat | Headed OK Harvested too soon to tell | OK |
| Spring Wheat | Emerged good | Poor |
| Sorghum | Planted a bit slow | Quite good |
| Rice | OK | Good |
| Oats | Headed OK | Two states not so good |
| Barley | Emerged good | Poor |
| Peanuts | Planted ok | Not great |
| Sugar Beets | NA | NA |
| Sunflowers | Planted looking good | NA |
| Pasture and Range | Extremely Bad |
Additional Information can be found here. Pretty much it is the same information as shown in the above tables but at the end there is some information on the methodology used.

Agriculture Sustainability Videos
Introduction
Episode 9 Living Soil. This is a long video (100 minutes) but very good as it covers a lot of ground about how to deal with drought.
Episode 10
News
Nothing to report tonight.
Intermediate-Term Weather Forecast
Showing from left to right, Days 1- 5, 6 – 10, 8 – 14, and Weeks 3 – 4 You can click on these maps to have them enlarge. Also, the discussions that go with these forecast maps can be found here (first two weeks) and here (Weeks 3 and 4).
First Temperature
|
|
|
|


And then Precipitation
|
|
|


The Week 3-4 Discussion is always interesting so we include it in the article. Similar discussions for the 6 -10 Day and 8 – 14 Day Forecasts are available here.
Week 3-4 Forecast Discussion Valid Sat Jun 26 2021-Fri Jul 09 2021
ENSO-neutral conditions continue with near normal sea surface temperatures (SSTs) across much of the equatorial Pacific Ocean. The MJO is inactive as indicated by the RMM index, and there is no clear emerging signal in the next couple weeks. Absent any ENSO or MJO signals, the Week 3-4 temperature and precipitation outlooks are based primarily on dynamical model guidance including the GEFS, CFS, Canadian, ECMWF, JMA, and the Subseasonal Experiment (SubX) multi-model ensemble (MME) of experimental and operational ensemble prediction systems, with additional considerations for decadal climate trends and soil moisture conditions, as well as the predicted evolution of the pattern from Week-2 forecasts.
Dynamical model guidance is generally consistent with respect to the predicted 500-hPa height anomaly patterns during the week 3-4 period. Dynamical model 500-hPa height anomaly forecasts for week 3-4 indicate some persistence of the forecast for the week 2 period. All dynamical models predict continued positive 500-hPa height anomalies from the North Pacific eastward across much of the CONUS, with greater positive anomalies expanding eastward across most of the northern CONUS in weeks 3 and 4. The ECMWF predicts an evolution of the pattern from the week 2 period to greater positive 500-hPa height anomalies and ridging over the northwestern CONUS, while the GEFS and SubX MME indicate more persistence of troughing over the Aleutians and ridging over the eastern North Pacific, as in the week 2 period. Overall, there is significant spread among dynamical model forecasts on the locations and amplitudes of the greatest positive 500-hPa height anomalies. The manual blend of dynamical model 500-hPa height anomalies was weighted heavily to the ECMWF and GEFS, resulting in positive 500-hPa height anomalies forecast across the CONUS, with the exception of near average height anomalies over parts of southern Arizona and Texas. Positive 500-hPa height anomalies are forecast across most of southern Alaska as well, with near average of slightly negative 500-Pa height anomalies over northern areas of the state. The Week 3-4 temperature and precipitation outlooks largely follow the ECMWF, GEFS and SubX MME forecasts.
The dynamical model guidance is in reasonably good agreement on the spatial pattern of anomalous temperatures during the Week 3-4 period. Below normal temperatures are favored from parts of the Southern Plains through the Central Gulf Coast related to the potential for enhanced precipitation and currently high observed soil moisture. Above normal temperatures are favored across much of the remainder of the CONUS, with higher probabilities over the West, exceeding 70 percent over the Central Rockies, under anomalous ridging and above normal 500-hPa heights. These higher probabilities extend northeast to include the Northern Plains, attributable in part to anomalously low soil moisture. Increased probabilities for above normal temperatures are favored across Mainland Alaska, the Aleutians and the Alaska Panhandle due to strong decadal climate trends at high latitudes.
Predicted anomalous ridging and above normal 500-hPa heights, as well as long term dry trends, enhance the likelihood of below normal precipitation for much of the western CONUS, outside most of the Southwest Monsoon region and climatologically dry areas of California and Nevada. Above median precipitation is likely over the western and central Gulf Coast states extending northeastward to the Ohio Valley, supported by the ECMWF, GEFS and SubX MME forecasts. Equal chances of above and below median precipitation are forecast for Alaska, as differences among dynamical model forecasts indicate greater uncertainty for the region.
Enhanced chances for above normal temperatures are forecast for Hawaii with higher probabilities over the northwestern Hawaiian Islands (Lihue and Honolulu) for Week 3-4, as predicted by the SubX MME. Equal chances of below or above median precipitation are forecast for Hawaii, based on little to no signal during the week 3-4 period, as predicted by the SubX MME.
Energy News
Nothing to report this week.
International Agricuture Outlook

Science Feature
No Science Feature this week
But a response to the Academy of Sciences Report that Recommended Research on Solar Geoengineering.
Indigenous peoples urge Harvard to scrap solar geoengineering project
Environmental News
News Releases from Headquarters›Water (OW)
EPA, Army Announce Intent to Revise Definition of WOTUS
06/09/2021
Contact Information:
EPA Press Office ([email protected])
WASHINGTON – Today, the U.S. Environmental Protection Agency (EPA) and Department of the Army (the agencies) are announcing their intent to (WOTUS) to better protect our nation’s vital water resources that support public health, environmental protection, agricultural activity, and economic growth. As described in an EPA declaration requesting remand of the 2020 Navigable Waters Protection Rule, a broad array of stakeholders – including states, Tribes, local governments, scientists, and non-governmental organizations – are seeing destructive impacts to critical water bodies under the 2020 rule.
“After reviewing the Navigable Waters Protection Rule as directed by President Biden, the EPA and Department of the Army have determined that this rule is leading to significant environmental degradation,” said EPA Administrator Michael S. Regan. “We are committed to establishing a durable definition of ‘waters of the United States’ based on Supreme Court precedent and drawing from the lessons learned from the current and previous regulations, as well as input from a wide array of stakeholders, so we can better protect our nation’s waters, foster economic growth, and support thriving communities.”
“Communities deserve to have our nation’s waters protected. However, the Navigable Waters Protection Rule has resulted in a 25 percentage point reduction in determinations of waters that would otherwise be afforded protection,” said Acting Assistant Secretary of the Army for Civil Works Jaime A. Pinkham. “Together, the Department of the Army and EPA will develop a rule that is informed by our technical expertise, is straightforward to implement by our agencies and our state and Tribal co-regulators, and is shaped by the lived experience of local communities.”
Upon review of the Navigable Waters Protection Rule, the agencies have determined that the rule is significantly reducing clean water protections. The lack of protections is particularly significant in arid states, like New Mexico and Arizona, where nearly every one of over 1,500 streams assessed has been found to be non-jurisdictional. The agencies are also aware of 333 projects that would have required Section 404 permitting prior to the Navigable Waters Protection Rule, but no longer do.
As a result of these findings, today, the Department of Justice is filing a motion requesting remand of the rule. Today’s action reflects the agencies’ intent to initiate a new rulemaking process that restores the protections in place prior to the 2015 WOTUS implementation, and anticipates developing a new rule that defines WOTUS and is informed by a robust engagement process as well as the experience of implementing the pre-2015 rule, the Obama-era Clean Water Rule, and the Trump-era Navigable Waters Protection Rule.
The agencies’ new regulatory effort will be guided by the following considerations:
Protecting water resources and our communities consistent with the Clean Water Act.
The latest science and the effects of climate change on our waters.
Emphasizing a rule with a practical implementation approach for state and Tribal partners.
Reflecting the experience of and input received from landowners, the agricultural community that fuels and feeds the world, states, Tribes, local governments, community organizations, environmental groups, and disadvantaged communities with environmental justice concerns.
The agencies are committed to meaningful stakeholder engagement to ensure that a revised definition of WOTUS considers essential clean water protections, as well as how the use of water supports key economic sectors. Further details of the agencies’ plans, including opportunity for public participation, will be conveyed in a forthcoming action. To learn more about the definition of waters of the United States, visit: https://www.epa.gov/wotus.
Background
The Clean Water Act prohibits the discharge of pollutants from a point source to navigable waters unless otherwise authorized under the Act. Navigable waters are defined in the Act as “the waters of the United States, including the territorial seas.” Thus, “waters of the United States” (WOTUS) is a threshold term establishing the geographic scope of federal jurisdiction under the Clean Water Act. The term “waters of the United States” is not defined by the Act but has been defined by EPA and the Army in regulations since the 1970s and jointly implemented in the agencies’ respective programmatic activities.
The 2020 Navigable Waters Protection Rule was identified in President Biden’s Executive Order 13990, which directs federal agencies to review all existing regulations, orders, guidance documents, policies, and any other similar agency actions promulgated, issued, or adopted between January 20, 2017, and January 20, 2021. See Fact Sheet: List of Agency Actions for Review, available at: https://www.whitehouse.gov/briefing-room/statements-releases/2021/01/20/fact-sheet-list-of-agency-actions-for-review/.
Major Sources of Information Used in this Weekly Report. We will not be using them all each week but the reader is welcome to refer to these resources.
|


