Global Economic Intersection
Advertisement
  • Home
  • Economics
  • Finance
  • Politics
  • Investments
    • Invest in Amazon $250
  • Cryptocurrency
    • Best Bitcoin Accounts
    • Bitcoin Robot
      • Quantum AI
      • Bitcoin Era
      • Bitcoin Aussie System
      • Bitcoin Profit
      • Bitcoin Code
      • eKrona Cryptocurrency
      • Bitcoin Up
      • Bitcoin Prime
      • Yuan Pay Group
      • Immediate Profit
      • BitQH
      • Bitcoin Loophole
      • Crypto Boom
      • Bitcoin Treasure
      • Bitcoin Lucro
      • Bitcoin System
      • Oil Profit
      • The News Spy
      • Bitcoin Buyer
      • Bitcoin Inform
      • Immediate Edge
      • Bitcoin Evolution
      • Cryptohopper
      • Ethereum Trader
      • BitQL
      • Quantum Code
      • Bitcoin Revolution
      • British Trade Platform
      • British Bitcoin Profit
    • Bitcoin Reddit
    • Celebrities
      • Dr. Chris Brown Bitcoin
      • Teeka Tiwari Bitcoin
      • Russell Brand Bitcoin
      • Holly Willoughby Bitcoin
No Result
View All Result
Global Economic Intersection
No Result
View All Result
Home Uncategorized

NOAA Updates The Outlook For June, 2021 – Small Changes That May Be Meaningful

admin by admin
September 6, 2021
in Uncategorized
0
0
SHARES
10
VIEWS
Share on FacebookShare on Twitter

Written by Sig Silber

At the end of every month, NOAA issues an update of their Early Outlook for the following month – in this case June. The Early Outlook as usual, together with their Four-Season forecast, was issued on the Third Thursday of the month. Now, eleven days later, there have been some significant changes. The June Drought Forecast was also issued today and is quite interesting. Is the change from the Seasonal Drought Forecast significant or just random variability? It is not possible to tell at this point. We expect a rotation of the drought area at some point but it will not be more than a tease unless it persists into autumn.

Some housekeeping: On May 20, 2021, we published Part I of our analysis of the NOAA Four -Season Outlook and that can be accessed here. In that report, the June 2021 Early Outlook was issued. This article presents the NOAA update of their Early temperature and precipitation Outlooks for June and the Drought Forecast for the month of June.


Please share this article – Go to the very top of the page, right-hand side for social media buttons. Also, feel free to send this article to anyone you feel will benefit from it. You can find the latest version of all our weather articles by consulting the Directory by clicking here and then clicking on the latest version of the article which is of interest to you.


First, we will compare the NOAA Early Outlook for June 2021 with the newly issued update.

Early Outlook Temperature

https://www.cpc.ncep.noaa.gov/products/predictions/long_range/lead14/off14_temp.gif

Updated Temperature Forecast

https://www.cpc.ncep.noaa.gov/products/predictions/long_range/lead14/off14_prcp.gif

It is a lot cooler. The probabilities for being warmer are actually higher for the Great Lakes and the Northeast but look at the blue (cool) anomaly centered over Texas but extending to the north and east also. Alaska is cooler also.

Early Outlook Precipitation

https://www.cpc.ncep.noaa.gov/products/predictions/long_range/lead14/off14_prcp.gif

Updated Precipitation Forecast

The dry anomaly has shifted north. The southern wet anomaly is much larger. The probabilities are really high for SE Texas and Louisiana. There is also a small wet anomaly in the North Central area. Alaska is less wet.

Here we compare the prior forecast to the new forecast as above but in a more compact format. This is simply the maps already presented organized in a different way to make comparison easier. Later, we show the forecast for almost the entire month broken into four parts.

May 20, 2021 Forecast for June 2021May 31, 2021, Forecast for June 2021
Temperature

https://www.cpc.ncep.noaa.gov/products/predictions/long_range/lead14/off14_temp.gif

https://www.cpc.ncep.noaa.gov/products/predictions/long_range/lead14/off14_prcp.gif

Precipitation

https://www.cpc.ncep.noaa.gov/products/predictions/long_range/lead14/off14_prcp.gif

It is not an enormous change but it is substantial given that only eleven days have passed since the Early Outlook was issued. In this arrangement of the maps you can see the general correlation between wet and cool and also between warm and dry. That should not be a surprise.

Here is the discussion released with the forecast.

30-DAY OUTLOOK DISCUSSION FOR JUNE 2021

The update to the June 2021 temperature and precipitation outlooks are driven primarily by the most recent short-, medium- and extended-range model guidance as well as the most recently available subseasonal and monthly integrated forecast products. The MJO has become less coherent in recent weeks and does not play as much of a role in the updated outlook, while soil moisture anomalies continued to inform the June temperature outlook.

Changes to the June temperature outlook are generally small overall. The outlook continues to favor above-normal temperatures in an inverted horseshoe pattern encompassing areas from the Southwest CONUS to the Pacific Northwest across the northern Plains and Great Lakes to the Northeast and mid-Atlantic. Strong ridging anticipated during much of the first half of June increases odds for above-normal temperatures for the Northeast, Great Lakes and mid-Atlantic compared to the mid-month outlook. Also, highest probabilities for above-normal temperatures in the western CONUS have been shifted to the northwest and are now focused in the central Great Basin and western Rockies where ridging and warmer-than-normal temperatures (some potentially extreme) are likely during the first week of June.

The most substantial change in the updated June outlook, is the inclusion of favored below-normal temperatures for the southern Plains, lower Mississippi Valley and western Gulf coast. The mid-month outlook did note the uncertainty in this region and potential cooler temperatures with a forecast area of Equal-Chances (EC) due to negative 500-hPa heights indicative of weakened sub-tropical ridging and enhanced cloudiness and precipitation. Model guidance through the end of May 2021 across time scales has become more clear and increased the likelihood of the conditions described above. Substantial further support for this addition is the recent heavy rainfall, especially for parts of east Texas and Louisiana, which has maintained or increased anomalously wet surface conditions across this region. Some minor changes are made in Alaska in the update, but forecast confidence is low and only very slight tilts from climatological odds are depicted for the state.

For precipitation, the updated June 2021 outlook illustrates some minor adjustments in general from the mid-month outlook. Favored below-normal precipitation remains for the northern Rockies and Pacific Northwest, but has been removed from parts of the eastern Southwest and southern High Plains. Model guidance favors some rainfall early in the month in this region where normal precipitation totals are relatively low.

In addition to the potential MJO influence noted in the mid-month discussion below, model guidance across time scales has increased confidence for above-normal precipitation for a region from Texas to the lower Ohio Valley, mid-South, Gulf coast, Southeast and lower mid-Atlantic. Greatest odds are for parts of eastern Texas and Louisiana.

Other minor changes include the addition of a small region of favored above-normal precipitation for parts of the northern Plains and upper Mississippi Valley, but confidence is low. High uncertainty due to varying signals in the available forecast tools across time scales in Alaska has led to a forecast of EC for the state of Alaska in the updated June outlook.

This discussion explains the changes and the reasons for the changes.

We agree with the NOAA assessment that ENSO has transitioned from La Nina to Neutral. But it is useful to see what the basis for that decision was and how it might impact weather. So I am showing two additional graphics that are in addition to those issued by NOAA with their ENSO Update and their Four Season forecast. Here is the first.

Subsurface Heat Anomalies

Ignore the bottom part of this graphic but just look at the top which is a cross-section of the Equator in the Pacific. ENSO is measured from 120W to 170W. What counts is the surface temperature and it looks to me like we indeed are no longer in La Nina because the warm water has reached the surface east of where the NINO 3.4 Index is measured and where La Nina is measured, the temperature anomaly shown is negative but warmer than -0.5C. But the above is just the information along the Equator and ENSO is measured + and – 5 degrees north and south of the Equator not just along the Equator. So we go to the next set of graphics.

Current SST and wind anomalies

For the moment, ignore the top part of this graphic which shows absolute temperatures at the surface and winds. The bottom part of the graphic shows the temperature anomalies. Reading the Legend is difficult so it is hard to be sure what the green represents but we see a contour labeled 0.0C. So the area west of that contour can not be as much as 0.5C different so this supports the above graphic.
The top part of the graphic is also interesting as it is showing the absolute temperature of the surface not the anomaly and 28F is warm enough to generate substantial evaporation and thus clouds which does not happen in this area during a La Nina. So we are clearly in ENSO Neutral and that should be impacting our weather but not necessarily immediately.
I am not showing it here because the situation changes quickly but there are two tropical events right now in the Eastern Pacific one of which could possibly provide moisture to the Southwest. I have not read the National Hurricane Center comments on that tropical event. Ok I just did and TS Blanca is not likely to impact CONUS but the fact that tropical events off the west coast of Central America are happening creates the potential for one of them to add moisture to the mix in June.
I have not frozen either of these graphics so they will update in the article.

Visual Consistency Testing.

It is useful to see how the full-month forecast fits with the set of partial-month forecasts that we have. These will continue to update in this article. It is important to remember that with the partial-month forecasts, we generally have about 25 days of the subsequent month to look at when we do this at the end of the month as we are doing now. It depends on what day of the week the month ends. So this month, which ended on a Monday, we have short-term forecasts that cover 25 of the 30 days in June so we are in pretty good shape to see if the whole is equal to the sum of the parts.

First Temperature

Day 3 Max Temperature6 - 10 Day Forecast Temperature8 - 14 Day Temperature3 - 4 Week Temperature
The new monthly forecast is to the right. Does it appear to be reflective of the four parts of the month for which we have forecasts? →

↑

← The forecast for the month is fairly consistent with the 25 days of short-term forecasts that we currently have at the time this article was published.

We are missing five days but the way NOAA works, the forecast for the last week of the month is weighted less than the earlier weeks in their forecast for the month as the last week is generally much more uncertain.

And Precipitation

Five day QPF6 - 10 Day Forecast Precipitation8 - 14 Day Precipitation3 - 4 Week Precipitation

The new monthly forecast is to the right. Does it appear to be reflective of the four parts of the month for which we have forecasts? →

↑

←The forecast for the month is pretty consistent with the 25 days of short-term forecasts that we currently have at the time this article was published.

Sometimes it is useful to compare the three-month outlook to the forecast for the first of the three months. It shows how much the pattern changes over the three-month period.

https://www.cpc.ncep.noaa.gov/products/predictions/multi_season/13_seasonal_outlooks/color/page2.gif

One can mentally subtract the First-Month Outlook from the Three-month Outlook and create the Outlook for the last two months in the three-month period.

For both temperature and precipitation, if you assume the colors in the maps are assigned correctly, it is a simple algebra equation to solve the month two/three forecast probability for a given location = (3XThree-Month Probability – Month One Probability)/2*. So you can derive the month two/three forecast this way. You can do that calculation easily for where you live or for the entire map.
It would appear that the July and August 2021 maps will need to be only slightly different than the three-month maps to make the three-month forecast work. It is important to remember that here we are comparing a one-month forecast issued today with a three-month forecast issued on May 20, 2021, eleven days ago. This always raises the question of whether the end-of-month update suggests a needed change in the forecasts for the subsequent two months or beyond which is why we present this analysis. The precipitation change may suggest that there will be subsequent changes in the precipitation forecast when the Seasonal Outlook is updated on June 17, 2021.
There are some reversals i.e. where the seasonal forecast and the June forecast change from wet to dry or the reverse or the temperature forecast went from warm to cold or the reverse. So this means that where that has occurred, the forecasts for July and August would need to have fairly high probabilities in those areas to have the outcome be as shown in the seasonal forecast. We are not focusing too much on that because transitioning from La Nina to ENSO Neutral probably meant that we should not have put a lot of faith in the Seasonal Outlook to begin with. The area involved is the area impacted by the North American Monsoon (NAM) and if you are not highly confident that you can predict the NAM Monsoon, you are not going to be very confdent that you can predict the weather in those areas impacted by the North American Monsoon. A friend of mine has taken a stab at doing that so here is the link for those who might find it of interest. Some things have changed since Andy Church prepared this analysis and he plans to update it probably in mid June. His focus is on New Mexico but much of what he presents applies to the entire Southwest and also the Great Plains. We will provide updates on the Monsoon once we get closer to the possible onset of the NAM.
*The concept is that the probabilities of a deviation from climatology in the First Month and the combined Month Two- and Three-forecast that one derives must average out to the probabilities shown in the three-month maps.

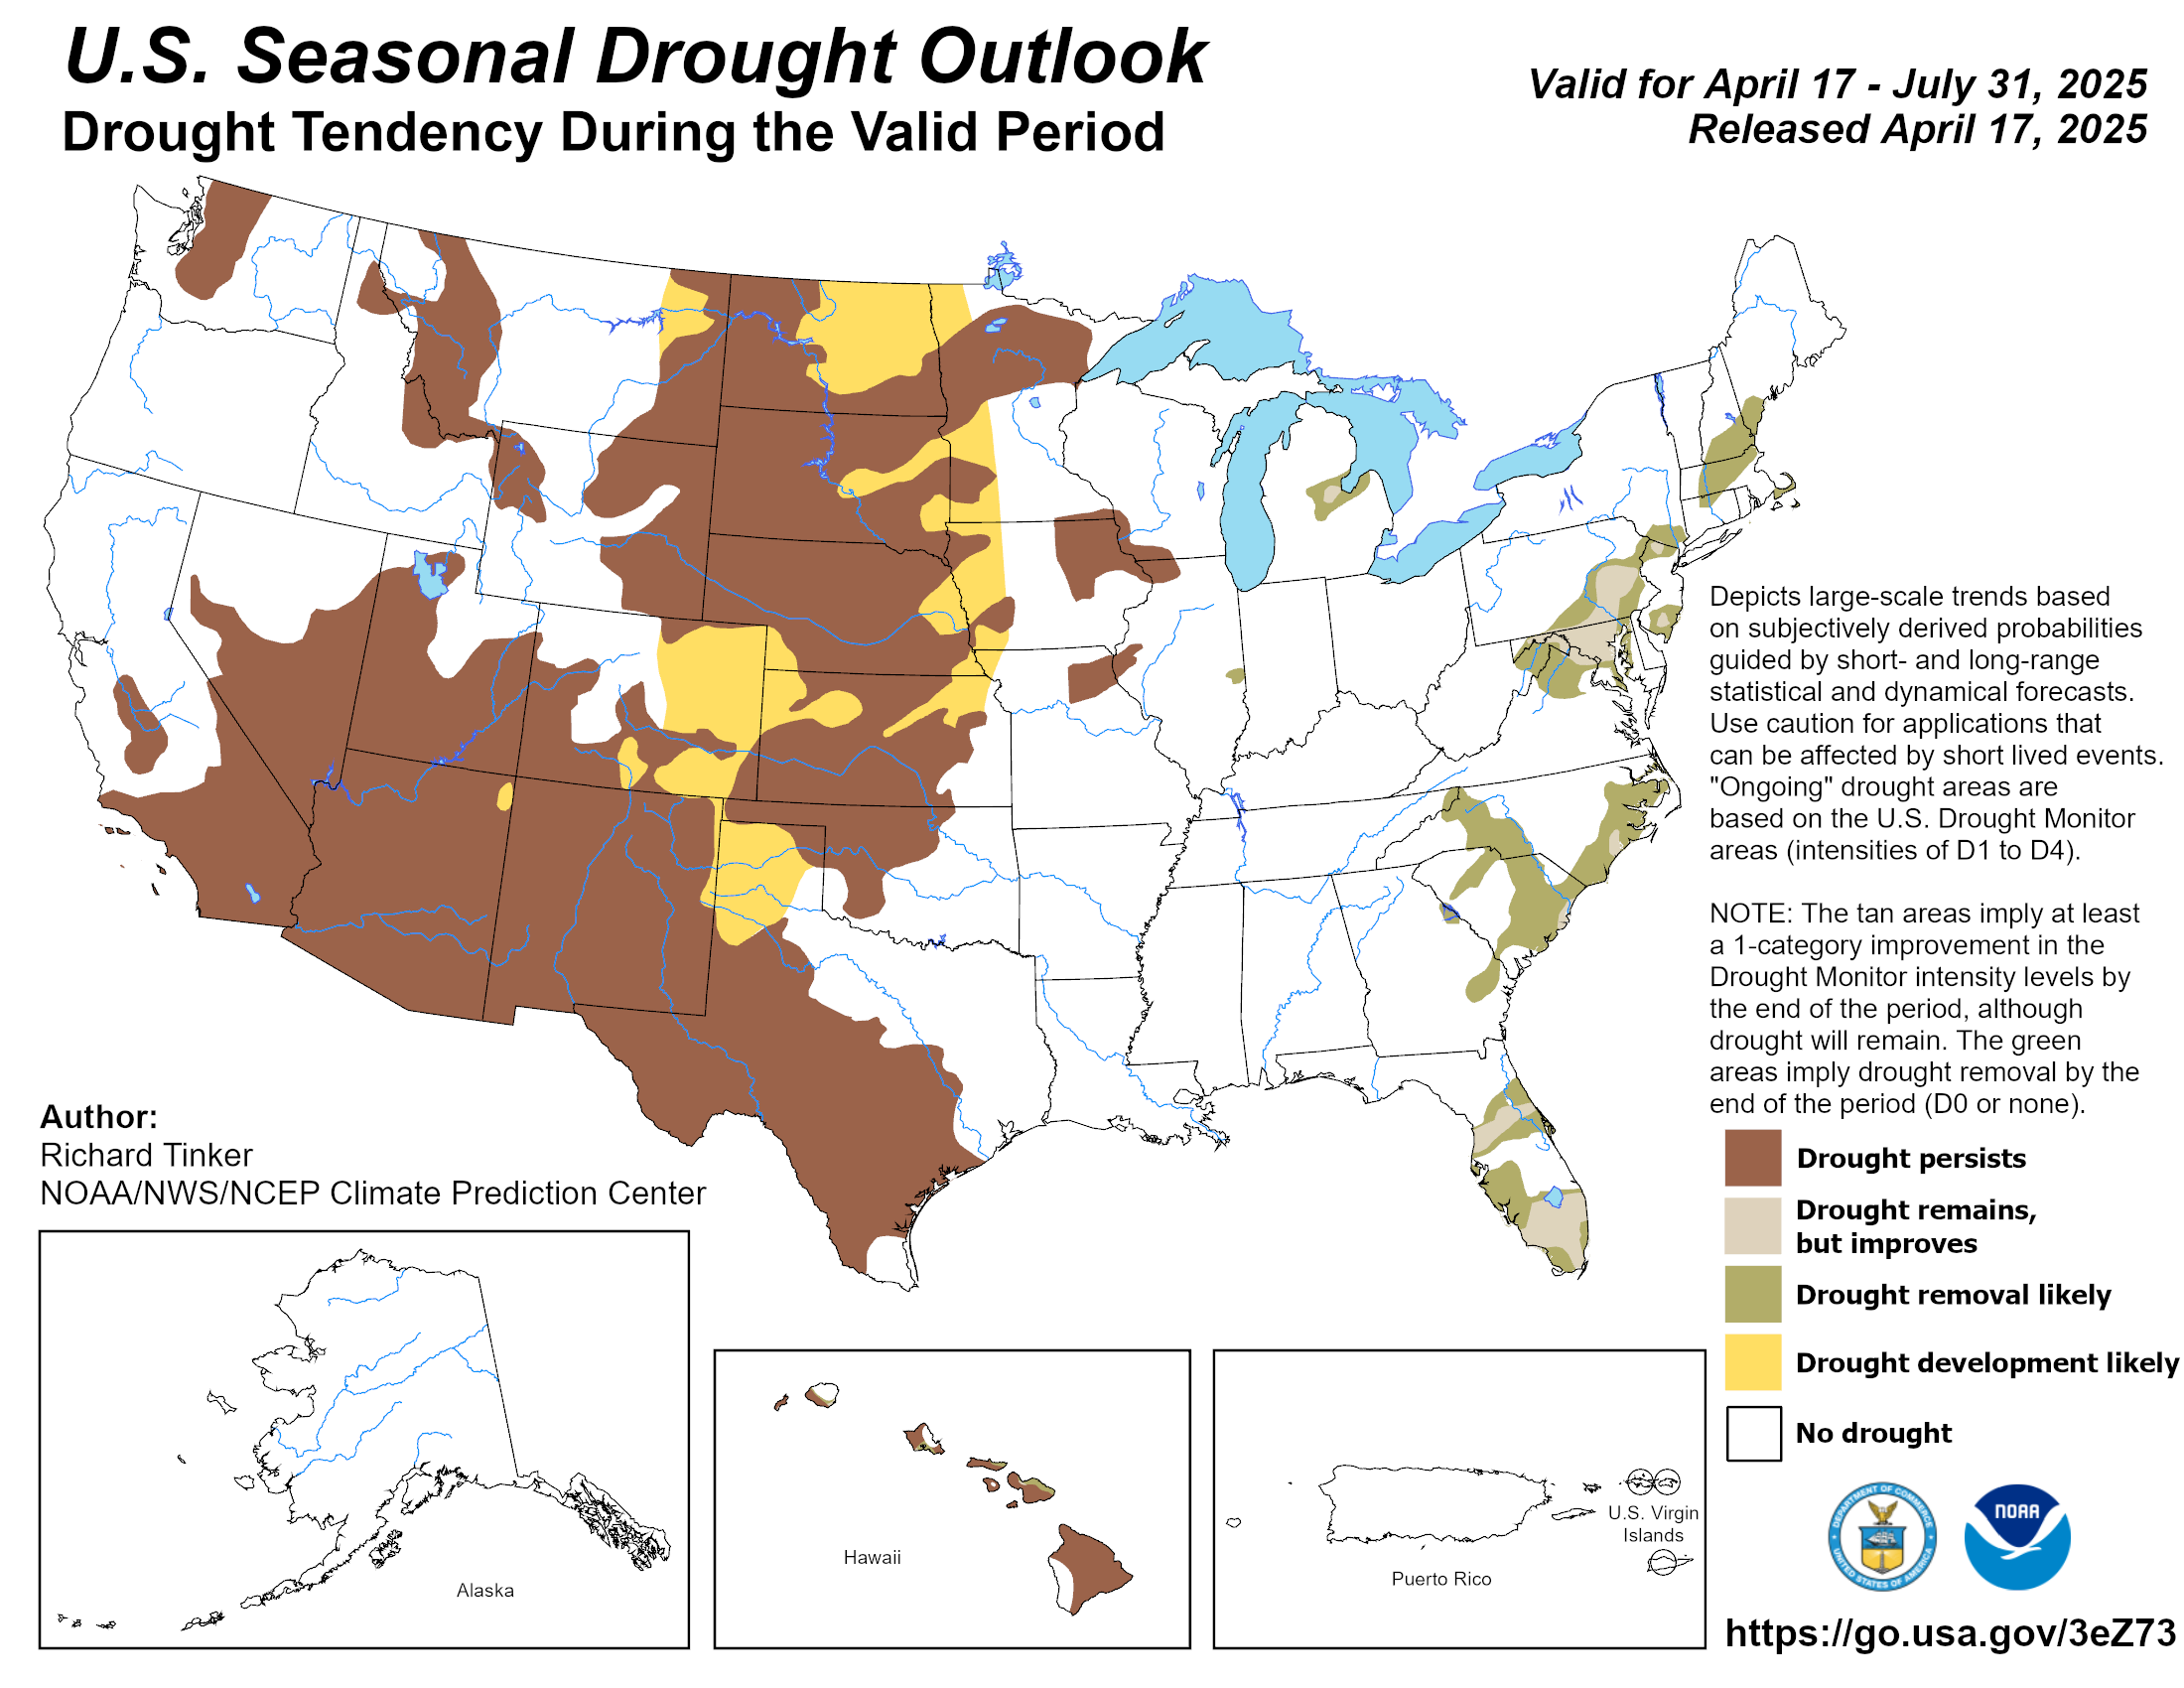
And with respect to drought, this was also issued on May 31, 2021

New drought forecast

This map shows the updated June part of what has been previously forecast for the three-month period.
It shows some projected improvement in Texas, Eastern New Mexico and some Mid-Atlantic coastal areas. It shows some projected degradation in the northern part of the West.
Here is the discussion issued with the new drought forecast. There is a long format and a short format and we are providing the short format discussion tonight. The shorter version is easier to follow

Latest Monthly Assessment – Heavy precipitation over the south-central CONUS during May is likely to result in either drought removal or improvement across central Texas and Oklahoma. Persistence is likely for western Texas and also throughout the long-term drought areas of the West. Development is also favored to occur across parts of Washington, Oregon, Idaho and Montana by the end of June due to forecasts favoring below normal precipitation and above normal temperatures. Broad persistence is favored for much of the northern Great Plains due to the long-term drought conditions and varying precipitation forecasts throughout the month. Forecast confidence is low for the northern to central Great Plains since June is one of the wetter months of the year. Drought persistence is also forecast for the Midwest.

Drought removal for parts of the eastern U.S. is most likely across parts of Virginia and the Carolinas due to a relatively wet forecast throughout June. Any lingering drought across southwest Florida is likely to end during June. Persistence is more likely for New England.

Alaska is forecast to remain drought-free through the end of June. Drought persistence is forecast for the Hawaii Islands and development is also favored during the June. Due to a recent drying trend and the latest precipitation forecasts, drought persistence is favored for Puerto Rico.

This seems to be consistent with the temperature and precipitation forecasts. The map shows improvement for Eastern New Mexico but this is not mentioned in the discussion. So that is a mystery but the precipitation forecast suggests that some improvement will indeed occur.

Has the Drought Forecast changed?

May 20th Seasonal OutlookMay 31st Single Month of June Outlook
http://www.cpc.ncep.noaa.gov/products/expert_assessment/sdohomeweb.pngNew drought forecast
You can see some differences. We are comparing apples to oranges to some extent. The map on the left is a seasonal forecast issued on May 20, 2021 and the map on the right is a one month forecast issued today. We see projected drought relief in Western Texas and Eastern New Mexico. We see some expansion of the drought in the Northwest but not as much as was forecast on May 20 for May 20 through August. So different people might read these tea leaves differently. I see it to some extent being a clockwise rotation of the drought. But it may just be some wet weather in late May and early June in areas that are typically dry this time of the year so that small changes in the actual versus forecasted precipitation shows up in changes in the drought. Both maps should be using the new definition of Climate Normals since that adjustment was made with the May 20, 2021 NOAA release.

Is there “persistence” in the forecast?

Looking back on May 2021 to relate the forecast for June to the actuals in May.

First May 2021 Temperature (30 out of 31 days).

https://hprcc.unl.edu/products/maps/acis/MonthTDeptUS.png

And then May Precipitation (30 out of 31 days).

https://hprcc.unl.edu/products/maps/acis/MonthPNormUS.png

We then show the new forecast and the prior month’s actuals (less one day) side by side.

Prior Month (usually missing one day)Forecast for current Month
Temperature

https://hprcc.unl.edu/products/maps/acis/MonthTDeptUS.png

https://www.cpc.ncep.noaa.gov/products/predictions/long_range/lead14/off14_prcp.gif

Precipitation

https://hprcc.unl.edu/products/maps/acis/MonthPNormUS.png

The forecast for June temperature is somewhat consistent with the May temperature actuals.
The forecast for June precipitation is somewhat consistent with the May precipitation actuals.
I conclude that NOAA does see some persistence from May to June. Part of the reason for that is that May did not turn out as forecast.

Conclusion

The purpose of this article was to present the updated Outlook for June 2021 and compare it with the Early Outlook. It is not to critique the updated Outlook for June based on our opinions but we point out possible inconsistencies if we find them. We have assessed the extent to which the monthly outlook seems to fit with the other forecasts provided by NOAA. In reality, all forecasts are obsolete when issued as the situation changes day by day or six hours by six hours i.e. each new model run. In our other articles, we continually examine the current forecasts from NOAA including Day 1- 5, 6-10, 8-14, and Week 3 and 4. So we are continually looking at approximately 25 days into the future.

On June 10, 2021, IRI/CBC will issue their ENSO forecast and we will present that and critique it. We do not expect any surprises with the NOAA June 10 Report. It is an ongoing process and we attempt to provide our readers with the best current assessment of the next approximately 25 days (except when we cover the Four-Season Analysis or medium-frequency cycles such as ENSO in which cases we are looking farther out than 25 days), so our analysis is pretty much ongoing. We also publish a “LIVE” Weather Article which updates in real-time to reflect NOAA Weather Headlines and for those interested provides detailed information down to current warnings in place. All of our reports including past versions of these reports can be located via the Directory/Archive which can be accessed here.

Previous Post

Oil, Gas, And Fracking News Read 30May 2021 – Part 1

Next Post

Bear Markets Matter More Than You Think

Related Posts

Scammers Steal $300K Using Fake Blur Airdrop Websites
Uncategorized

FBI Warns Investors Of Crypto-Stealing Play-to-Earn Games

by John Wanguba
March 10, 2023
Maersk Almost Completing Russia Exit After The Sale Of Logistics Sites
Uncategorized

Maersk Almost Completing Russia Exit After The Sale Of Logistics Sites

by John Wanguba
February 20, 2023
Why Is ‘Staking’ At The Center Of Crypto’s Latest Regulation Scuffle
Uncategorized

Why Is ‘Staking’ At The Center Of Crypto’s Latest Regulation Scuffle

by John Wanguba
February 14, 2023
Mexico's Pemex Dismantled Resources Worth $342M From Two Top Fields
Uncategorized

Mexico’s Pemex Dismantled Resources Worth $342M From Two Top Fields

by John Wanguba
January 20, 2023
Oil Giant Schlumberger Rebrands Itself As SLB For Low-Carbon Future
Uncategorized

Oil Giant Schlumberger Rebrands Itself As SLB For Low-Carbon Future

by John Wanguba
October 26, 2022
Next Post

Bear Markets Matter More Than You Think

Leave a Reply Cancel reply

Your email address will not be published. Required fields are marked *

Browse by Category

  • Business
  • Econ Intersect News
  • Economics
  • Finance
  • Politics
  • Uncategorized

Browse by Tags

adoption altcoins bank banking banks Binance Bitcoin Bitcoin adoption Bitcoin market blockchain BTC business China crypto crypto adoption cryptocurrency crypto exchange crypto market crypto regulation decentralized finance DeFi Elon Musk ETH Ethereum Europe Federal Reserve finance FTX inflation investment market analysis Metaverse NFT nonfungible tokens oil market price analysis recession regulation Russia stock market technology Tesla the UK the US Twitter

Archives

  • June 2023
  • May 2023
  • April 2023
  • March 2023
  • February 2023
  • January 2023
  • December 2022
  • November 2022
  • October 2022
  • September 2022
  • August 2022
  • July 2022
  • June 2022
  • May 2022
  • April 2022
  • March 2022
  • February 2022
  • January 2022
  • December 2021
  • November 2021
  • October 2021
  • September 2021
  • August 2021
  • July 2021
  • June 2021
  • May 2021
  • April 2021
  • March 2021
  • February 2021
  • January 2021
  • December 2020
  • November 2020
  • October 2020
  • September 2020
  • August 2020
  • July 2020
  • June 2020
  • May 2020
  • April 2020
  • March 2020
  • February 2020
  • January 2020
  • December 2019
  • November 2019
  • October 2019
  • September 2019
  • August 2019
  • July 2019
  • June 2019
  • May 2019
  • April 2019
  • March 2019
  • February 2019
  • January 2019
  • December 2018
  • November 2018
  • October 2018
  • September 2018
  • August 2018
  • July 2018
  • June 2018
  • May 2018
  • April 2018
  • March 2018
  • February 2018
  • January 2018
  • December 2017
  • November 2017
  • October 2017
  • September 2017
  • August 2017
  • July 2017
  • June 2017
  • May 2017
  • April 2017
  • March 2017
  • February 2017
  • January 2017
  • December 2016
  • November 2016
  • October 2016
  • September 2016
  • August 2016
  • July 2016
  • June 2016
  • May 2016
  • April 2016
  • March 2016
  • February 2016
  • January 2016
  • December 2015
  • November 2015
  • October 2015
  • September 2015
  • August 2015
  • July 2015
  • June 2015
  • May 2015
  • April 2015
  • March 2015
  • February 2015
  • January 2015
  • December 2014
  • November 2014
  • October 2014
  • September 2014
  • August 2014
  • July 2014
  • June 2014
  • May 2014
  • April 2014
  • March 2014
  • February 2014
  • January 2014
  • December 2013
  • November 2013
  • October 2013
  • September 2013
  • August 2013
  • July 2013
  • June 2013
  • May 2013
  • April 2013
  • March 2013
  • February 2013
  • January 2013
  • December 2012
  • November 2012
  • October 2012
  • September 2012
  • August 2012
  • July 2012
  • June 2012
  • May 2012
  • April 2012
  • March 2012
  • February 2012
  • January 2012
  • December 2011
  • November 2011
  • October 2011
  • September 2011
  • August 2011
  • July 2011
  • June 2011
  • May 2011
  • April 2011
  • March 2011
  • February 2011
  • January 2011
  • December 2010
  • August 2010
  • August 2009

Categories

  • Business
  • Econ Intersect News
  • Economics
  • Finance
  • Politics
  • Uncategorized
Global Economic Intersection

After nearly 11 years of 24/7/365 operation, Global Economic Intersection co-founders Steven Hansen and John Lounsbury are retiring. The new owner, a global media company in London, is in the process of completing the set-up of Global Economic Intersection files in their system and publishing platform. The official website ownership transfer took place on 24 August.

Categories

  • Business
  • Econ Intersect News
  • Economics
  • Finance
  • Politics
  • Uncategorized

Recent Posts

  • What Are BRC-30 Tokens?
  • XRP’s Explosive Boom Results In Record-Breaking Address Activity
  • What To Consider When Evaluating Low-Code And No-Code Platforms

© Copyright 2021 EconIntersect - Economic news, analysis and opinion.

No Result
View All Result
  • Home
  • Contact Us
  • Bitcoin Robot
    • Bitcoin Profit
    • Bitcoin Code
    • Quantum AI
    • eKrona Cryptocurrency
    • Bitcoin Up
    • Bitcoin Prime
    • Yuan Pay Group
    • Immediate Profit
    • BitIQ
    • Bitcoin Loophole
    • Crypto Boom
    • Bitcoin Era
    • Bitcoin Treasure
    • Bitcoin Lucro
    • Bitcoin System
    • Oil Profit
    • The News Spy
    • British Bitcoin Profit
    • Bitcoin Trader
  • Bitcoin Reddit

© Copyright 2021 EconIntersect - Economic news, analysis and opinion.

en English
ar Arabicbg Bulgarianda Danishnl Dutchen Englishfi Finnishfr Frenchde Germanel Greekit Italianja Japaneselv Latvianno Norwegianpl Polishpt Portuguesero Romanianes Spanishsv Swedish