Written by Sig Silber
HEADLINES –
– .Another round of late-season snow moving into the northern Rockies as above normal temperatures linger across the northern Plains to parts of the eastern U.S
– Scattered Thunderstorms through the Plains will produce locally heavy rains, isolated Flash Flooding and the risk of Severe Weather

This article provides continuous updates for a variety of Weather and Weather-Related Threats as well as a general weather forecast. These are “Live” maps that continually update. Please pay attention to the Mesoscale Events maps — Mesoscale Events are potentially life-threatening situations.
Please share this article – Go to the very top of the page, right-hand side for social media buttons. Also, feel free to send this email to anyone you feel will benefit from it.
For those interested in longer-term forecasts, we just published the new NOAA Seasonal Outlook and it can be accessed here.
Readers can scan through this article or jump to where they want to go via the links to the right. To get back to the Directory, hit the back arrow at the top of the URL bar on your screen. But in many cases, one of my Editors has graciously inserted a Return to Directory link to click so that is even easier. This is so high tech that I hardly believe it. |
|
CONUS Focal Points

Short Range Focal Points
Short Range Forecast Discussion NWS Weather Prediction Center College Park MD 400 AM EDT Sun May 23 2021
Valid 12Z Sun May 23 2021 – 12Z Tue May 25 2021
…Another round of late-season snow moving into the northern Rockies as above normal temperatures linger across the northern Plains to parts of the eastern U.S…
…Scattered Thunderstorms through the Plains will produce locally heavy rains, isolated Flash Flooding and the risk of Severe Weather…
The mid to upper level flow will remain highly amplified across the lower 48 over the next two days with a strong closed low lifting northeast from the Great Basin and through the Northern Rockies, while an upper level ridge along the Mississippi pushes east into the Southeast. In this flow regime, a low pressure system is forecast to intensify as it lifts northward through the Rockies today. This will bring another round of mountain snow across the northern Rockies with a soaking cold rain for the lower elevations, possibly mixing with wet snow into tonight. The intensifying low will also push a strong frontal boundary across the High Plains where thunderstorms could become severe today and into tonight. The low pressure system should continue to move north into the Canadian prairies on Monday but the snow will be slow to taper off in the northern Rockies as winds become strong and gusty from the west to northwest. The strong winds will then spread eastward across the northern Plains by Tuesday as the low begins to move eastward.
Farther south across the Plains, the threat of severe thunderstorms should diminish slightly on Monday as the main energy associated with the low lifts into southern Canada. However, the tropical plume of moisture from the Gulf of Mexico remains open for the next few days as winds continue to circulate around a large high pressure system over the eastern U.S. This will support at least scattered thunderstorms from the western Gulf Coast up across many of the Plains states into Tuesday. This may lead to locally heavy rains, isolated flash flooding and continued threat of severe weather.
Given this highly amplified weather pattern, temperatures are expected to be 10 to 20 degrees below average in the West in contrast with equally above average temperatures from the northern to central Plains eastward across much of the Mississippi Valley and eastern U.S. Some record high temperatures are possible today in the urban corridor from Boston to Washington DC, where highs are forecast in the upper 80s to low 90s. Meanwhile, the fire weather threat across portions of the Four-Corner region should gradually diminish as the low pressure system moves away.
Interestingly, the above average temperature region will also encompass all of the historical region of the Brood X periodic cicada. This will ensure additional warming of the soil and expansion of the regions of emergence and continued active cicada singing where they have already surfaced.
We try to keep this up to date but if is not you can find the updated version here.
When you click on this image it takes you to the SPC Fire Warning Page and you get a set of maps for Days 1, 2, 3 – 8, etc. You can then click on those for more detailed information. The map is a bit blurry as I tried to make it a bit larger than the map provided by NOAA but should be able to see where the current wildfire risks are. But if you click on this map, you will get to see three maps that show the risk for different time periods.

Thunderstorm Risk

This should play out something like shown in this 60 Hour Forecast Animation
Here is a national animation of weather fronts and precipitation forecasts with four 6-hour projections of the conditions that will apply covering the next 24 hours and a second day of two 12-hour projections the second of which is the forecast for 48 hours out and to the extent it applies for 12 hours, this animation is intended to provide coverage out to 60 hours. Beyond 60 hours, additional maps are available at links provided below. The explanation for the coding used in these maps, i.e. the full legend, can be found here although it includes some symbols that are no longer shown in the graphic because they are implemented by color-coding.

The two maps below break it down by day and may be easier to read.
Now, the Day One and Two CONUS Forecasts: These Maps Update Daily.
Day One CONUS Forecast | Day Two CONUS Forecast |
|
|
These graphics update and can be clicked on to enlarge. You can see where the weather will be | |
 | |


During the winter much of our weather originates in the Pacific. That is why we pay attention to the near-term history of storms arriving.
Temperature

A version that shows a 40 hour animation and some other views can be found here

– Return to Directory
Day 3 – 7 Hazards
Valid Monday May 24 2021 – Friday May 28 2021
Hazards:
– Heavy rain across portions of the Central/Southern Plains, and the Middle Mississippi Valley, Tue-Fri, May 25-May 28.
– Flooding possible across portions of the Lower Mississippi Valley and the Southern Plains.
– Flooding occurring or imminent across portions of the Central Plains, the Middle Mississippi Valley, the Lower Mississippi Valley, and the Southern Plains.
– Flooding likely across portions of the Central Plains, the Middle Mississippi Valley, the Lower Mississippi Valley, and the Southern Plains.
– Much above normal temperatures across portions of the Southeast, the Southern Appalachians, and the Tennessee Valley, Mon-Wed, May 24-May 26.
– Much above normal temperatures across portions of the Great Lakes, Tue, May 25.
– Much above normal temperatures across portions of the Mid-Atlantic and the Northeast, Wed, May 26.
Detailed Summary:
Heavy rain and anomalous warmth will be the main hazards across the CONUS during the medium range period (Monday, May 24th – Friday, May 28th). Upper level troughing in the West will produce showers in the Pacific Northwest and Northern Rockies/Plains on Monday as a surface low pressure system churns across southern Canada.
This system will produce rain and thunderstorms in the Southern/Central Plains, Upper Mississippi Valley, Ohio Valley and Mid-Atlantic. The upper-level low behind this system will pull a fetch of Gulf moisture leading to the enhancement of rain and thunderstorms across the Plains and Upper/Middle Mississippi Valley through Friday where a few inches of rain are likely. There seems to be decent agreement on the general area of heavy rain, particularly over the Central Plains into the Middle Mississippi Valley through mid-week. Temperatures will rise to much above normal levels for the Detroit-Cleveland areas as the warm front lifts through the area on Tuesday. High temperatures will be between 15 and 20 degrees above average that day.
It is during this same period that the Southeast will be beneath a dome of high pressure. This area of high pressure paired with southerly flow will lead to the likelihood of anomalously warm weather for parts of the DC-New England I-95 corridor as well a large portion of the Southeast mid-late week. Parts of the Southeast may experience record breaking high temperatures during this period.
Alaska will remain quiet in the medium range, with an area of low pressure keeping most of the heavy precipitation off the southern coast.
(This is updated only during the week) Note the first list is weather highlights, this list is hazards. Not sure there is that much of a difference but they come from two different parts of NOAA. The Day 3 – 7 Hazards List does not update on weekends. But it is still useful as it remains valid for the period of time it covers. Of course, all forecasts are subject to change. Later we show a map of the hazards. Perhaps we should show them together.
Click here for the latest complete Day 3 -7 Hazards forecast which updates only on weekdays. It includes the full discussion which I do not update in this article but only present the highlights.
– Return to Directory
Ski Snow Reports
New Feature – Ski Reports. (We may be a tad premature but not by much). It is difficult to find reports that auto-update on-screen (and they are very long) but these links will get you to them – If you have additional suggestions make them in the comments section after every GEI Article and we may add those links. We will try to not have too much overlap as that can add to the confusion.
We will update the above map (or maps) weekly (or more often when the situation is changing rapidly) but more frequent updates can be obtained here.
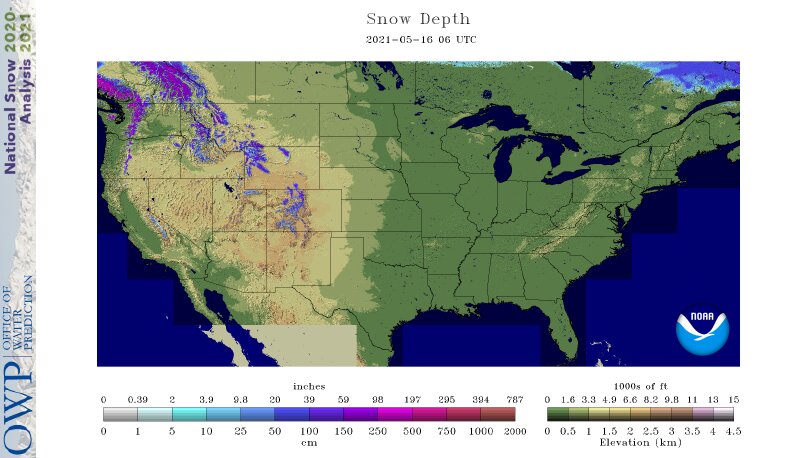
Snow Forecasts.
Day 1

Day 2

Additional snow information can be found here and here.
We also include drought information in this section.


More information can be found here.
May Drought Outlook.

Seasonal Outlook Issued May 20, 2021

Here is the short version of the discussion that was released with the new forecast.
Latest Seasonal Assessment – Drought improved across parts of Texas, northeastern Colorado, central Wyoming and the Northeast in the past month due to heavy rainfall, while drought developed or intensified in many parts of California, the Pacific Northwest, Northern Intermountain West, Northern Rockies, and the Carolinas due to increasing precipitation deficits. Drought persistence or development is favored for most of the West and High Plains, based on elevated probabilities of below normal precipitation and above normal temperatures for June-July-August. Drought removal or improvement is expected across east-central Texas along with most of Oklahoma due to heavy recent rainfall and additional heavy rainfall forecast for the rest of May.Lack of a rainfall signal from monthly and seasonal precipitation outlooks supports drought persistence across the Midwest. The Great Plains and Corn Belt will be closely monitored in the monthly drought outlooks through the summer. The wet monthly and seasonal outlooks along with the onset of the convective season strongly support removal across the small drought areas in southern Florida. The persistence forecast for the Northeast is based on a weak rainfall signal and likelihood of above normal temperatures during June-July-August along with a favorable time for soil moisture discharge.
Alaska is forecast to remain drought-free through the end of August. Drought is favored to persist across Puerto Rico during the next few months. Drought development and persistence is forecast across the leeward sides of the Hawaiian Islands.
– Return to Directory
Tropical Events
I am replacing the large with three small maps but you can click on them to get larger versions. Even though they are small maps you should be able to tell if there is activity and If I see activity I will make the map where there is activity full size and when available add other related maps. Sorry for any confusion but the NHC maps do not update during the Winter except if there is activity. We leave them in simply because if there is a storm NOAA will start to update the relevant map even though it is not normally updated during the off season. The maps are a bit small but if you click the map you can see the date and time when it was updated.
| the Central Pacific. | the Eastern Pacific | the Atlantic and the Gulf of Mexico |
 |  |  |
Atlantic and Gulf of Mexico

The Eastern Pacific
NA
The Central Pacific
NA
Updates on individual named storms can be obtained here.
And the Western Pacific


Weekly Tropical Forecast

– Return to Directory
Intermediate-Term Weather Forecast
And shifting to the Alaska and CONUS Intermediate-Term Weather Forecast showing from left to right, Days 1- 5, 6 – 10, 8 – 14 and Weeks 3 – 4 You can click on these maps to have them enlarge, there are larger versions in the Addendum (More Weather the link is shown at the end of this section, and there are larger versions of these maps in the Addendum. Also, the discussions that go with these forecast maps can be found here (first two weeks) and here (Weeks 3 and 4).
First Temperature
|
|
|
|


And then Precipitation
|
|
|


For those interested in more detail, there are additional weather maps and information in the MORE WEATHER Addendum. The link to the Addendum is here. |
– Return to Directory
Mesoscale Events
The following map shows where mesoscale events are occurring or forecast. If you do not see any areas highlight on this map than there are no mesoscale events taking place or forecast. A mesoscale event is a very serious situation for a very small area and detailed information is provided for these events when they occur or are forecast. If a mesoscale event is shown, click on the map and more detail on the event will be shown.

Two different parts of the NWS issue this map and they are not always in agreement although they are pretty close. They (Norman Oklahoma and College Park Maryland) issue the alerts when they realize the need, so it is best to look on both maps and click one or both if you see areas highlighted.

This next map showing where “Headlines” have been issued for convection (and an animation of the recent movement of storms) should update and you should be able to click on to get additional details but if it does not update when you click on it, click here.
There is a slight difference between convection and thunderstorms. The below map shows where “Headlines” have been issued for Thunderstorms. You should be able to click on the map to get additional details but if it does not update, you can click here.

The map below shows the current wildfire risk which becomes more significant as we move into Summer. When you click on this image it takes you to the SPC Fire Warning Page and you get a set of maps for Days 1, 2, 3 – 8, etc. You can then click on those for more detailed information. The map is a bit blurry as I tried to make it a bit larger than the map provided by NOAA but should be able to see where the current wildfire risks are. But if you click on this map, you will get to see three maps that show the risk for different time periods.
– Return to Directory
Now the Day 3 – 7 Hazards Outlook Maps

The orange and red outlined areas are what is most concerning of the forecasted Day 3 – 7 Hazards. This graphic does not update during the weekend. There is a discussion that goes with this graphic and you can access that discussion here.
The following is provided to help the reader relate the maps to how NWS will describe an area of the U.S.

– Return to Directory
Now to our More Detailed Weather Report
This graphic is about Atmospheric Rivers i.e. thick concentrated movements of water moisture. More explanation on Atmospheric Rivers can be found by clicking here or if you want more theoretical information by clicking here. The idea is that we have now concluded that moisture often moves via narrow but deep channels in the atmosphere (especially when the source of the moisture is over water) rather than being very spread out. This raises the potential for extreme precipitation events.


500 MB Mid-Atmosphere View
The map below is the mid-atmosphere 3-Day chart rather than the surface highs and lows and weather features. In some cases, it provides a clearer less confusing picture as it shows only the major pressure gradients. This graphic auto-updates so when you look at it you will see NOAA’s latest thinking. The speed at which these troughs and ridges travel across the nation will determine the timing of weather impacts. This graphic auto-updates I think every six hours and it changes a lot. Thinking about clockwise movements around High-Pressure Systems and counterclockwise movements around Low-Pressure Systems provides a lot of information.


| Day 3 Above, 6 Below | Day 4 Above,7 Below | Day 5 Above. |
|  |  |
 |  |  |
Here are the precipitation forecasts. First the cumulative for Days 1 – 3

Then cumulative for Days 1 – 5

Then cumulative for Days 1 – 7
Now we look at the forecast for the Maximum Temperature three days out.
Looking ahead to next week.

– Return to Directory
Additional Tools to Obtain Watches and Warnings
| Current watches, warnings, and advisories issued by the agencies of the National Weather Service. Hazards should show up in the various maps but the below links will take you to all outstanding watches and warnings in each category which may include some categories not covered in the various maps or difficult to find. So if there is a category of interest, click on the appropriate link below. |
|
Below you will see a number of different maps that are updated in real-time, making this a “live” report. If a part of one or more of the maps shows an area that is highlighted, you can click on it and get the full current report. By having the reader click on these active situations rather than having GEI do so, you will not miss any events in which you might have an interest and which we had not noticed and the page will not get cluttered with warnings, etc that have since expired.
Our focus here is events that are likely to last in the range of six hours but there can be longer or shorter events that are addressed by the Storm Prediction Center which is the main source of the information in this article. Long-term major events like a Hurricane are more likely to be in a separate article. But that may not always be the case. Since in general, all the links on this page transfer you into the NOAA system, in order to get back into this article you need to either close the tab to which you were transferred or click back on the tab that has this article.
| Live Warning Maps which If Severe Weather is Shown can be Clicked on to get more detail about these events. If there is a current warning shown on the map, click on the map for additional information related to the event. | These maps are updated as risks are identified. |
| This is the current graphic showing any mesoscale discussions (MD’s) which are in effect over the contiguous United States. Please read the description of the purpose of our MD’s for further information. Details on all valid MD’s may be found on our Current Mesoscale Discussions page. |  |
| Convective Outlooks | |
|---|---|
| This is today’s forecast for organized severe thunderstorms over the contiguous United States. Please read the description of the risk categories for further information. You may find the latest Day 1 Outlook available as well as all Outlooks issued today online. | Today’s Outlook |
 | |
| This is tomorrow’s forecast for organized severe thunderstorms over the contiguous United States. Please read the description of the risk categories for further information. The latest Day 2 Outlook is available as well as all Outlooks that have been issued today. | Tomorrow’s Outlook |
 | |
| This is the day after tomorrow’s (day 3) forecast for organized severe thunderstorms over the contiguous United States. Please read the description of the risk categories for further information. The latest Day 3 Outlook is available as well as all Outlooks that have been issued today. | Day 3 Outlook |
 | |
| This is the day 4-8 forecast for organized severe thunderstorms over the contiguous United States. The latest Day 4-8 Outlook is available as well as all Outlooks that have been issued today. Note: A severe weather area depicted in the Day 4-8 period indicates a 30% or higher probability for severe thunderstorms (e.g. a 30% chance that a severe thunderstorm will occur within 25 miles of any point). | Day 4-8 Outlook |
 | |
| The Thunderstorm Outlooks depict the probability of thunderstorms across the contiguous United States in 4 or 8 hour time periods. The probabilistic forecast directly expresses the best estimate of a thunderstorm occurring within 12 miles of a point. The three probabilistic forecast thresholds are 10, 40, and 70 percent. | Thunderstorm Outlook |
 | |
| Fire Weather Outlooks | |
| This is today’s forecast for organized wildfires over the contiguous United States. Please read the description of the risk categories for further information about this product. | Today’s Outlook |
| |
| This is tomorrow’s forecast for organized wildfires over the contiguous United States. Please read the description of the risk categories for further information about this product. | Tomorrow’s Outlook |
 | |
| This is day 3-8 forecast for organized wildfires over the contiguous United States. Please read the description of the risk categories for further information about this product. | Day 3-8 Outlook |
 | |


