Written by Sig Silber
Slightly Updated at 7:15 pm EDT March 29, 2021
Some are calling the current drought in the West a “Megadrought”. I am not convinced that it has risen to that level although the term itself is not well defined. We will discuss this a bit tonight. We provide some updated information on La Nina. We show the state rankings with respect to temperature and precipitation for the three months of meteorological winter. This article contains all of our regular features and as usual, we include an intermediate-term weather forecast.

Please share this article – Go to the very top of the page, right-hand side, for social media buttons. Please feel free to send this article to anyone who you think might benefit from reading it.
First, let us start with a short ENSO Update.


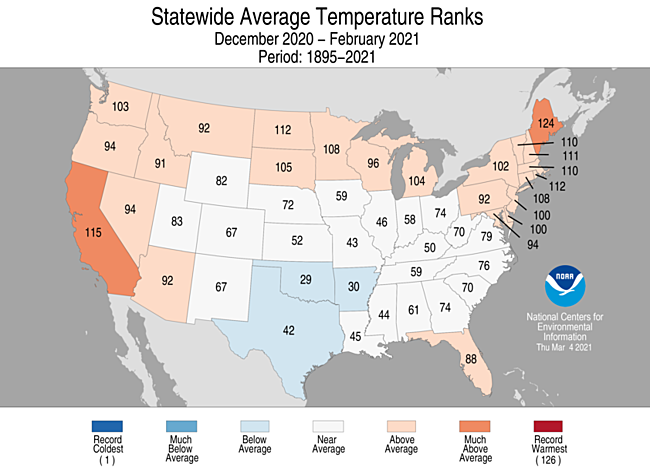
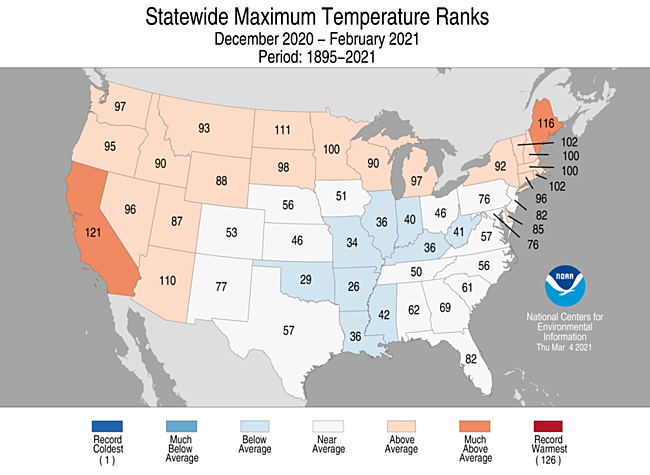
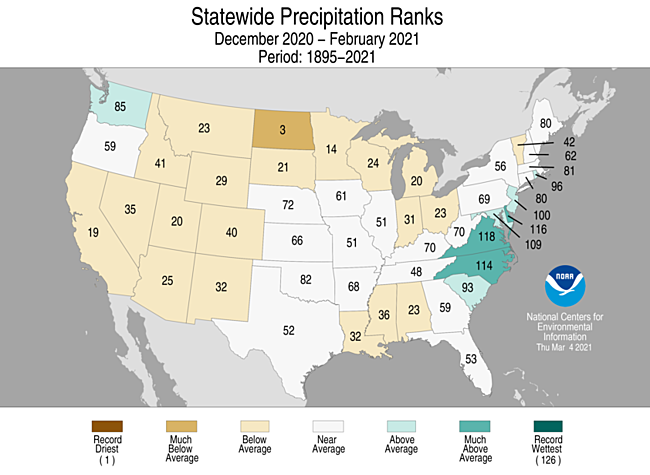
Let’s look at State Rankings for the three-month period Dec – Feb which is meteorological winter.
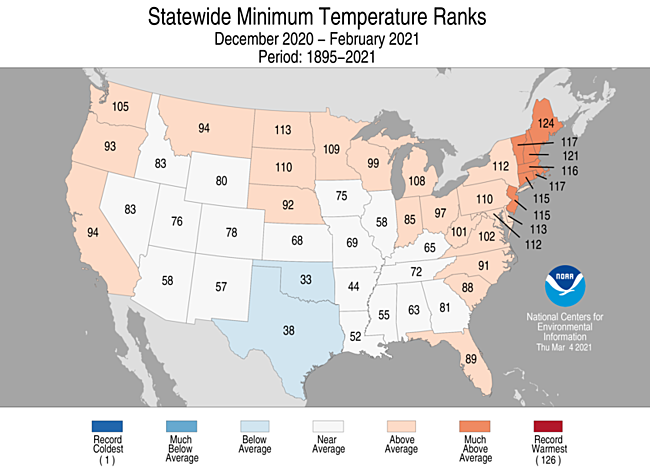
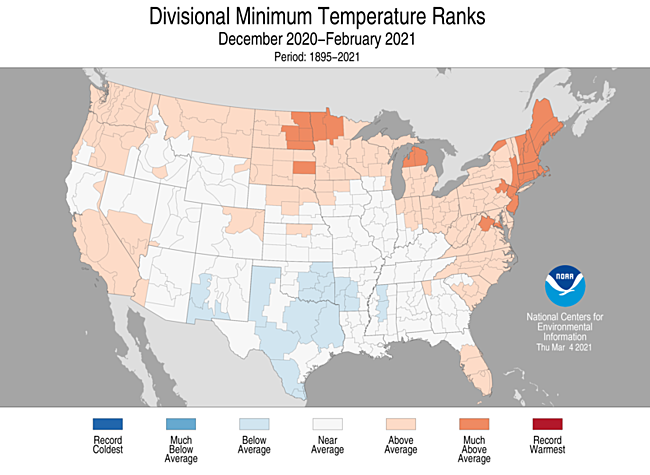
We do not usually do it but let us look at the climate divisions with respect to Minimum Temperatures.
And then precipitation
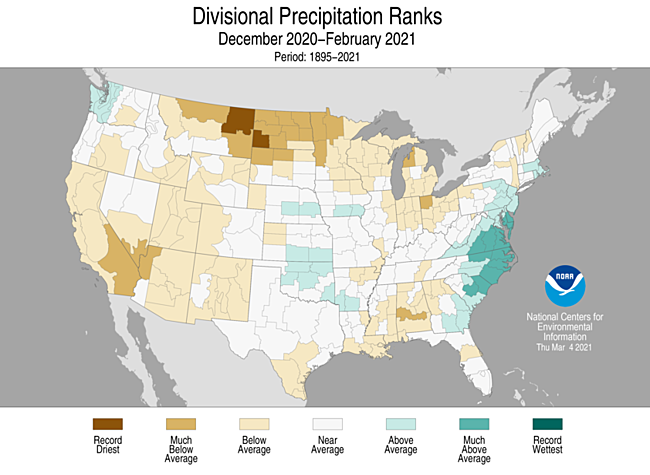
And precipitation by climate division
Western Drought. Is it a Megadrought?
I could have generated the following myself and it would show better but everything takes time so when I find something useful I do.

But let us now focus on the Sierra Nevada mountains which are very important for California.


California/Nevada Update


I have slipped in a more readable current reservoir storage.


Southern Plains Update


Intermountain West Update


But not every part of the U.S. is in drought.


But we are not going to ignore the drought or the poor prospects of an adequate Spring runoff. So that’s where we start:
| Last Week | This Week |
 |  |
| Last Week | This Week |
 | |
Recent Events.

Here is what the SNOTEL data is telling us about Spring runoff.

And here is the water year.

And it is always useful to look at the last seven days.

Let’s look at the current drought situation.

And the week to week change

Here we look at four-time periods: one week, one month, six months, and a full year.

Drought Discussion (The Regional links are live and will take you to the drought map for that Region)
A couple of low pressure systems resulted in widespread precipitation (0.5 to 3 inches, locally more) across the central and southern Plains, Ohio and Tennessee Valleys, Southeast, and Mid-Atlantic from March 16 to 22. However, mostly dry weather persisted across southern Texas, the Florida Peninsula, northern New England, the Great Lakes, and northern Plains. Periods of rain and high-elevation snow occurred across the Pacific Northwest, northern California, and the central Rockies, but the Southwest remained mostly dry. As of March 23, 7-day maximum temperatures averaged above normal across the northern Plains and Upper Mississippi Valley.
Northeast
Following below normal precipitation during the first half of March, widespread precipitation (0.5 to 1.5 inches) overspread the northern Mid-Atlantic and southern New England. However, much of Maine, northern New Hampshire and Vermont, Upstate New York, and parts of Massachusetts remained mostly dry. Therefore, a slight increase in D0 (abnormal dryness) and D1 (moderate drought) was made. Although 28-day streamflows generally are running average, soil moisture and SPI values at various time scales support the ongoing D0 and D1. Also, areas east of Lake Erie (northeast Pennsylvania and western New York) had an expansion of D0 this week.
Southeast
On March 17 and 18, a severe weather outbreak occurred with numerous tornado reports across Alabama, Georgia, Florida, North Carolina, and southeast Virginia. In addition to the severe weather, widespread rainfall (0.5 to 2 inches, locally more) soaked much of the Southeast which prompted a 1-category improvement to ongoing D0 (abnormal dryness) and D1 (moderate drought). 28-day streamflows and 60 day SPI values continue to support lingering areas of D0-D1 across Alabama. Parts of northern and central Georgia received less rainfall this past week which prompted an increase in abnormal dryness (D0) based largely on 60-day SPI. The Florida Peninsula remained mostly dry this past week and the D0 (abnormal dryness) was expanded. D1 (short-term moderate drought) was added to mainland areas of Monroe County in south Florida where less than 2 inches of rainfall has occurred during the past 90 days and fire danger is very high.
South
The severe weather outbreak that affected the Southeast Region began across the Lower Mississippi Valley on March 17 and local rainfall amounts exceeded 2 inches across parts of Arkansas, Louisiana, and Mississippi where 1-category improvements were made. More widespread rainfall amounts of more than 1.5 inches increased soil moisture throughout nearly all of Tennessee. Based on this past week’s rainfall of 1 to 3 inches and improving soil moisture conditions, improvements were made to much of Oklahoma and parts of northern to central Texas. Small 2-category improvements were justified for the northeast Texas Panhandle and northwest Oklahoma where the heaviest rainfall occurred. Periods of above normal temperatures, enhanced surface winds, and below normal precipitation this month supported a continued worsening of drought conditions throughout southern Texas. Soil moisture declines rapidly from central to west Texas where indicators support D3 (extreme) to D4 (exceptional) drought categories.
Midwest
Widespread precipitation (0.5 to 2 inches) fell from Missouri east to Kentucky, Illinois, Indiana, and Ohio on March 17 and 18. This recent precipitation maintained saturated soils, high streamflows, and minor to moderate river flooding across the Middle Mississippi Valley and Lower Ohio Valley. In areas that were drier preceding this precipitation, extending from northeast Missouri east to Ohio, a large decrease in D0 (abnormal dryness) and D1 (moderate drought) coverage was warranted. However, this recent rainfall had to be balanced with longer term SPIs. There was a sharp northward cutoff to this precipitation and D0-D1 coverage was increased across lower Michigan, extreme northern Indiana, and southern Wisconsin based on soil moisture and SPI values at various time scales.
High Plains
Frequent precipitation during the past two weeks continues to result in additional improvements to parts of the central Plains and central Rockies. 7-day total amounts (March 16-22) ranged from 1 to 3 inches, locally more, across a broad region including south-central Nebraska and much of Kansas. As of March 22, Grand Island Nebraska has received 6.95″ so far this month which makes it the wettest March on record. The drought amelioration extends west to the central Rockies where numerous improvements were made including a two-category change from D3 to D1 in southwest El Paso County and southeast Teller County as SPIs are now D1 at all timescales. The removal of D3 in southeast Colorado and southwest Kansas was based on: SPIs are either neutral or positive dating back to 6 months and improving soil moisture conditions. In contrast to the major improvements across the central Rockies and central Plains during the past two weeks, persistent dryness continues to support additional expansion of D2 (severe) and D3 (extreme) drought across parts of North Dakota.
West
A slight expansion of severe drought (D2) was made to northeast Montana, based on 90-day SPI and soil moisture below the 10th percentile. These low soil moisture conditions are related to the lack of snowfall this winter. In contrast to the northern high Plains, snow water content is running close to average for late March and led to the elimination of abnormal dryness (D0) across south-central Montana. Since parts of western Arizona and southeast California have received little to no precipitation during the past two month, D3 (extreme) and D4 (exceptional) drought were slightly increased. This expansion of D3-D4 was supported by 9-month SPI values which covers the failed 2020 monsoon and this past winter. An expansion of D2 (severe) and extreme (D3) drought across parts of southern California was based on large water year to date precipitation deficits and 6-month SPI values. No other changes were made at this time to the remainder of California as 6 to 12 month SPIs generally support the current depiction and snow water content is running near two-thirds of average for the Sierra Nevada Mountains. During subsequent weeks, the drought depiction will be reassessed across California. Although much of the precipitation this past week fell along the coast or over the Cascades, a reassessment of longer term SPIs dating back 6 to 12 months supported removal of the D2 (severe) drought in southwest Oregon. Due in part to recent high-elevation snow and rainfall during the past two weeks, a slight decrease in D3 (extreme) and D4 (exceptional) drought was made to northern and northeast New Mexico. However, widespread D4 persists across southeast New Mexico where dust storms have been quite frequent this month and soil moisture remains in the lowest one percentile.
Alaska, Hawaii, and Puerto Rico
Abnormal dryness continues for northern and eastern Mainland Alaska with no changes this week. As of mid-March the water year precipitation remains below 70 percent for northeast parts of Alaska.
Numerous preliminary reports of 6-day totals, ending on March 13, exceeded 10 inches across parts of these islands and maximum amounts of more than 20 inches were reported. Based on this heavy rainfall during mid-March, a broad 1-category improvement was made to Hawaii which results in limiting long-term drought (D1) to only Maui.
After above normal precipitation resulted in a decrease of abnormal dryness (D0) and short-term moderate drought (D1) during the previous week, drier weather returned and no changes were made to Puerto Rico.
Pacific Islands
The weather features across the U.S.-Affiliated Pacific Islands (USAPI) during this USDM week (03/17/21-03/23/21) included near-equatorial troughs which persisted across Palau and Yap State, accompanied early in the week by a weak circulation; an Inter-Tropical Convergence Zone (ITCZ) across the central to eastern Federated States of Micronesia (FSM) and southern Marshall Islands (RMI), fed by wind-speed convergence and interlaced with surface troughs; and a dry trade-wind regime across the Marianas with minor interference from weak shear lines or surface troughs. South of the equator, American Samoa encountered a surface trough, mid- to upper-level low pressure, and nearby surface low early in the week, with a high pressure ridge taking control later in the week.
Satellite-based estimates of 7-day precipitation (QPE) showed a band of precipitation stretching east-west across Micronesia (the ITCZ), with areas of 2+ inches over Palau and Yap State, and areas of 4+ inches further east. The areas with the heaviest precipitation were between the equator and 5 degrees North latitude over central FSM, and southern portions of the RMI. Patchy areas of up to 1 inch of rain were detected by this tool near and over parts of the Marianas, but mostly no rain was indicated for the northern parts of the USAPI. A large area of 4+ inches of rain, with embedded 10+ inches, was indicated south of the Samoan Islands, with 2+ inches sweeping across American Samoa.
Both Palau and American Samoa were wet (more than the 2-inch and 1-inch, respectively, weekly minimum precipitation needed to meet most water needs) this week. Weekly rainfall totals in Palau included 2.48 inches at the Palau IAP and 3.40 inches at Koror COOP/ROR, and, in American Samoa, 1.94 inches at Pago Pago, 2.11 inches at the automated station at Toa Ridge, and 3.12 inches at the automated station at Siufaga Ridge. With monthly totals above the corresponding monthly minimums through March 23, D-Nothing continued at Palau and Tutuila.
With the exception of the NPS automated station at Saipan (1.13 inches), this week was dry (below the 1-inch weekly minimum needed to meet most water needs) in the Marianas. Based on data received for the week, a third of an inch or less was recorded at Guam (0.39 inch), Rota (0.11), Tinian (0.17), Saipan ASOS (0.22), and Saipan IAP (0.03). Guam (2.51 inches) and Rota (2.76 inches) had more than 2 inches for the month so far, but that was still below the corresponding monthly minimum. The Saipan stations had about an inch or less (1.30 at NPS, 0.60 at ASOS, and 0.21 at IAP). Abnormal dryness (D0-S) continued at Guam and Rota and moderate drought (D1-S) continued at Saipan.
The ITCZ gave eastern and southern portions of the FSM a wet week, with rainfall totals in the east ranging from 2.11 inches at Pohnpei to 3.27 inches at Kosrae, and in the south ranging from 1.98 inches at Kapingamarangi to 3.25 inches at Nukuoro, based on data through March 22 or 23. It was a dry week (less than the 2-inch weekly minimum) at stations in the western FSM and at Pingelap (1.34 inches) in the east. Weekly totals at the western stations ranged from 1.17 inches at Fananu to 1.45 inches at Yap. Ulithi reported 0.26 inch but with 3 days missing. Monthly totals were below the monthly minimum (for this point in March) at Nukuoro (5.31 inches) and Lukunor (5.70), but wet at the other FSM stations. D0-S continued this week at Fananu due to the dry week, but with 7.67 inches of rain for the month so far, improvement may be made next week if sufficient rain falls. D3-SL continued at Kapingamarangi, but with 6.07 inches so far this month, improvement may be made next week if sufficient rain falls to improve conditions on the ground. D-Nothing continued at the rest of the FSM stations.
In the Marshall Islands, no data was received from Utirik this week so an analysis could not be made for this station. The ITCZ soaked parts of the southern RMI while northern portions were dry. Mili recorded 8.67 inches of rain this week, Ailinglaplap 4.36 inches, Jaluit 3.01 inches, and Majuro 2.33 inches. On the dry side, Kwajalein reported 0.91 inch and Wotje 0.45 inch. With the month-to-date total (9.32 inches) now well above the 8-inch monthly minimum, Jaluit was improved from D0-S to D-Nothing. D1-S continued at Kwajalein, where the monthly total rainfall so far was 5.33 inches, and D3-S continued at Wotje where only 0.45 inch of rain has been reported for the month. The reservoir level at Majuro on March 22 was 25.2 million gallons, or 70% of maximum which was below the 80% threshold for concern, but sufficient rain has been falling to keep the status D-Nothing. D-Nothing continued at the rest of the RMI stations.
Virgin Islands
The weather conditions across the U.S. Virgin Islands (USVI) during this USDM week (03/17/21-03/23/21) were dominated by upper-level ridging and surface high pressure. Patchy shallow moisture fed spotty light showers triggered by weak trade-wind perturbations, but dry stable air was the rule.
Radar-based estimates of rainfall (QPE) for the 7 days ending at 12z on Tuesday showed a fourth of an inch or less of precipitation across western portions of St. Croix and St. Thomas, with less than a tenth of an inch to no precipitation further east. USGS data showed groundwater levels continuing to decline across all three islands. Reports indicated browning of vegetation across St. John.
Weekly rainfall totals on St. Croix ranged from no measurable rain at East Hill to 0.30 inch at the CoCoRaHS station at Frederiksted 0.5 N, on St. Thomas ranged from 0.06 inch at Anna’s Retreat 2.5 ESE to 0.22 inch at Charlotte Amalie West 4.2 WNW, and on St. John from 0.12 inch at Cruz Bay 1.6 E to 0.23 inch at Windswept Beach and 0.65 inch at Cruz Bay 0.8 NE. Weekly normal rainfall is about a third of an inch at the airport stations. Monthly rainfall totals (through March 23) ranged from 0.23 inch (Rohlsen AP) to 1.53 inches (Frederiksted 0.5 N) on St. Croix, from 0.07 inch (Anna’s Retreat 2.5 ESE) to 0.81 inch (Charlotte Amalie 1.4 NE) on St. Thomas, and from 0.44 inch (Cruz Bay 1.6 E) to 0.79 inch (Cruz Bay 0.8 NE) on St. John. Rohlsen AP had the fifth driest March so far (out of 62 years) while King AP ranked 13th driest out of 58 years and East Hill 22nd driest out of 48 years. Both King AP and East Hill had the seventh driest year-to-date. With the continued dryness, D1-SL continued on St. Croix and D2-S continued on St. Thomas and St. John.
Looking Ahead
During the next 5 days (March 25 to 29), a pair of low pressure systems are forecast to bring widespread precipitation (0.5 to 2 inches, locally more) to the Lower and Middle Mississippi Valley, Ohio and Tennessee Valleys, and Northeast. Farther to the south across the Florida Peninsula and southern Texas, dry weather is likely to persist. Little to no precipitation is also forecast for the northern Great Plains. Additional snow is expected throughout the Rockies, Intermountain West, and Cascades.
The CPC 6-10 day extended range outlook (valid from March 30 to April 3) favors near normal temperatures for much of the lower 48 in a variable pattern. Probabilities of above normal temperatures are elevated for the northern Plains, Florida, and California. Below normal temperatures are most likely across Alaska. Above normal precipitation is favored for the Northeast, Mid-Atlantic, western Gulf Coast, Rio Grande Valley, and Alaska. Increased chances of below normal precipitation are forecast across the Upper Mississippi Valley, much of the Plains, and throughout the West.
The result of the drought is very dry soil conditions

March Drought Outlook


Since we are entering fire season it is time to start showing the wildland fire potential outlook. These will update automatically shortly after the month changes.


Crop Conditions

NASS Reports.


Let us take a look at energy

Intermediate-Term Weather Forecast
Showing from left to right, Days 1- 5, 6 – 10, 8 – 14, and Weeks 3 – 4 You can click on these maps to have them enlarge. Also, the discussions that go with these forecast maps can be found here (first two weeks) and here (Weeks 3 and 4).
First Temperature
|
|
|
|


And then Precipitation
|
|
|


The Week 3-4 Discussion is always interesting.
Week 3-4 Forecast Discussion Valid Sat Apr 10 2021-Fri Apr 23 2021
La Nina conditions persist over the tropical Pacific. However, the weekly Nino 3.4 sea surface temperature (SST) anomaly was observed to be about -0.5 degree C, and conditions are likely to transition to ENSO-neutral during spring. The Madden Julian Oscillation (MJO) is active over the Indian Ocean as determined by the RMM indices, and forecast by dynamical models to progress into the Western Pacific in the next couple weeks. The impacts of the current MJO and ENSO states and the decadal trends over the CONUS are mostly consistent with current dynamical model forecasts for temperature.
The Week 3-4 temperature and precipitation outlooks are based primarily on dynamical model forecasts from the NCEP CFS, ECMWF, and JMA, and the Subseasonal Experiment (SubX) multi-model ensemble (MME) of experimental and operational ensemble prediction systems. Additional considerations were given to La Nina conditions and decadal trends, as well as the predicted evolution of the pattern from Week-2 forecasts.
There is overall good agreement among dynamical model forecasts of the 500-hPa height pattern for week 3-4, which indicates general persistence of the pattern forecast for week 2 with some increased uncertainty and deamplification. A ridge and positive 500-hPa height anomalies are forecast over the North Pacific and parts of the Aleutian Islands. Troughing is predicted to the west of the Alaska Mainland in the manual blend of dynamical and statistical model 500-hPa heights. Near zero 500-hPa height anomalies and troughing are predicted over western North America, including parts of the northwestern CONUS. Some models, such as the ECCC Canadian ensemble predict greater magnitude negative 500-hPa height anomalies over Alaska, western Canada, and parts of the northwestern CONUS. However, greater weight was given to the ECMWF ensemble model forecast, which depicts only weak negative 500-hPa anomalies over parts of the Northern Rockies, and an amplified ridge and positive 500-hPa height anomalies over the Northeast region. The GEFS and SubX MME mean forecasts are generally consistent with the ECMWF 500-hPa height forecast.
IElevated probabilities of above normal temperatures are indicated across much of the CONUS from the Rocky Mountains eastward to the Atlantic coast, under a ridge and predicted positive 500-hPa height anomalies. Equal chances (EC) of above and below normal temperatures are forecast for most areas of the Pacifc Coast states, under near average 500-hPa heights. Below normal temperatures are favored for western areas of Washington and Oregon, supported by dynamical model forecasts and consistent with lingering La Nina conditions. The highest confidence of above normal temperatures is indicated for the Southern Plains and the eastern half of the CONUS, with probabilities exceeding 70 percent over much of the region and exceeding 80 percent over the Northeast region and much of Texas, supported by dynamical model forecasts from the ECMWF and NCEP GEFS.
Predicted anomalous northerly flow results in increased probabilities of below normal temperatures for southern Mainland Alaska, while decadal trends lead to predicted above normal temperatures for northern Mainland Alaska, consistent with dynamical model forecasts from the GEFS and ECMWF and with the manual blend of models.
The dynamical model guidance is in reasonably good agreement on the spatial pattern of anomalous precipitation during the week 3-4 period. Below median precipitation is favored throughout much of the CONUS from the Central Rockies eastward into the Central Plains and for most of the eastern half of the CONUS, under a predicted ridge and mostly positive 500-hPa height anomalies. However, above median precipitation is predicted from northeastern North Dakota into the western Great Lakes region by the ECMWF and GEFS dynamical model precipitation forecasts. Probabilities exceed 60 percent for below median precipitation over much of the Southeast and parts of the Mid-Atlantic, under positive 500-hPa height anomalies. Above median precipitation is forecast for parts of southeastern New Mexico and western Texas, with the northward flow of surface moisture predicted by the GEFS and the SubX MME means. Above median precipitation is favored for the central western coast of Mainland Alaska into the Alaska Interior, associated with enhanced westerly flow.
Above normal temperatures are favored over Hawaii, shifting to equal chances from the northwest to the southeast, given decreasing sea surface temperature anomalies oriented similarly. The SubX MME anomaly forecast indicates likely above median precipitation over northwestern islands of Hawaii for the week 3-4 period.
International

This week fortunately we do have a map.

In the box are shown the major resources we use. We will not be using them all each week but the reader is welcome to refer to these resources.
Double Dip La Nina Continued
I want to attempt to present a paper that explains why we have more La Ninas than El Ninos. I think you can read the full paper here. I am not positive of that because I am registered with ResearchGate but they did not ask me to log in so I think you can access the full article but hopefully I will present enough for readers to understand the concept.
I have not made any progress on this since last week but I am leaving it in the article for those who may want to think about the issue and I will try to expand the discussion below next week.


The rest of the discussion is later on in the article. And consider this an introduction because some of my readers may be familiar with this but for me, it is uncharted territory. So I need to do a lot more research. But what caught my interest was the part of the discussion not shown here but in the slides that are presented later in this article which suggests that the Pacific Decadal Oscillation or PDO does not explain as much about weather cycles (what I call low-frequency weather cycles) as I have assumed and that there are other factors now that need to be included in the analysis. One of the two is the Pacific Meridional Model or PMM mentioned in the Abstract. If that is the case, and I can come across some other references to this it is very important – let me just say it that way.
I have moved the other slides I made to somewhere close to the end of this article. I will be coming back to this topic very soon. I am not sure yet if this theory if you want to call it that explains why we may have a two-year La Nina this time around. It is not clear that we will but some of the models suggest it. Not all La Nina’s are dry for the Southwest but most are. So if the ratio of two-year La Ninas to one-year La Ninas is increasing, that is very important. I could have held back all this information until was read to fully discuss it but that did not seem to be proper. Some of my readers may know more about this and can leave me messages in the comment section that follows every article I publish.
I also see the possible connection of what is discussed in this paper with the storm we just had. In the article I posted last night on the NOAA four-season forecast I provided some snapshots of the Equatorial Pacific which showed a lack of movement of the cool and warm anomalies. I showed four snapshots which basically covered three months but I could have gone back many more months and it would have looked similar. You can see that set of graphics here. The importance of that is this La Nina is not decaying rapidly. So it could last into next winter or fade for a short period of time and later regain La Nina Status. I am not making any predictions here but I am raising the question of has something fundamentally changed?
I am certainly familiar with the deliveries to Elephant Butte the major reservoir on the Rio Grande and I am familiar with the deliveries to the three beneficiaries of that project namely an irrigation district in New Mexico, a similar irritation district in El Paso County Texas, and Mexico. Shortly after the MegaNino of 1997 and the subsequent La Nina of 1998 deliveries declined to Elephant Butte Reservoir and to the three (there is actually a fourth in good years when there is surplus water available to Hudspeth County Tx under a Warren Act Contract). I concluded that this was a normal change of phase of the PDO but perhaps there is more to it. So that explains my interest in the topic and although I frame the issue in a New Mexico context it impacts essentially all of the U.S.


Just what is the Pacific Meridional Mode?
This may help a bit. It is a second reference to the issue and this time an NOAA article. BTW, the fish are never wrong. We create indices on observed fish behavior. If their behavior deviates from what our indices suggest their behavior should be, it is not because the fish are confused it is because our indices or models no longer are accurate.
This graphic also might help


4 | DISCUSSION AND SUMMARY
From the present study, it is necessary to discuss two possible factors responsible for modulating La Niña persistence. The first is the preceding El Niño amplitude. From a linear perspective, the discharging amount is proportional to the El Niño amplitude. With strong discharging, significant SSTA cooling could last more than 2 years. The preceding El Niño amplitude also affects the intensity of the interbasin SSTA gradient by influencing the adjustment time of the Indian and tropical Atlantic Oceans to the Pacific SSTA (Wu et al., 2019). More specifically, the delayed response of SST cooling over the Indian and tropical Atlantic Oceans, in comparison with the Pacific cooling, allows the easterly wind anomaly over the western Pacific to be dominated even after the La Niña decaying phase. This initiates a La Niña that tends to persist up to 2 years. However, the role of the Indian Ocean capacitor effect on western Pacific wind anomalies has been questioned by Chen et al. (2016). Using data analysis and numerical experiment, the authors claim that the Indian Ocean basin warming during mature El Niño wintertime events has little effect on the easterly anomalies in the equatorial western Pacific, and the local process over the western Pacific has more influence over the Indian Ocean capacitor effect. Further numerical experiments may provide quantitative insight in to the importance of these factors, which is beyond the scope of this study. The second factor is a recharging/discharging efficiency with respect to anomalous wind-stress/WSC relevant to SSTA patterns, which contributes to ENSO phase transition. This was the focus of this study. An EP-type El Niño preceding a La Niña leads to strong discharge by positive WSC (0 – 15N) that is widely spread over the Pacific basin, which induces a strong and long-lasting La Niña. When a La Niña develops through the mid-latitude connection (PMM or NPO), SSTA cooling and a tropical easterly wind anomaly expand to the North Pacific. In this case, an anomalous negative WSC is weak and, thus, the recharging efficiency by equatorial Rossby waves is low. Consequently, to understand La Niña persistence, it is reasonable to consider both the preceding El Niño amplitude and recharging/discharging efficiency by anomalous SST/wind-stress patterns as the La Niña evolves. In this study, we investigated how the evolution of single- and multi-year La Niña events differs from their onset phase by analysing both observational and climate model data sets. Our analyses showed that there was a significant difference in the evolution between the two types of La Niña events, even from their initial development associated with a mid-latitude connection. These differences are described as follows (Figure 10).
1. A weak CP-type (Niño-4 > Niño-3) El Niño tends to exist one year prior to a single-year La Niña event, whereas a strong EP-type (Niño-3 > Niño-4) El Niño tends to exist prior to a multi-year La Niña event.
2. For single-year La Niña events, negative WSC, associated with CP-type El Niño and confined to the western Pacific, induces weak discharge that leads to a weak La Niña. In contrast, a widely extended negative WSC of a multi-year La Niña in the Pacific basin causes efficient discharge, resulting in a strong La Niña.
3. From the decay of an El Niño to a La Niña developing period, SSTA cooling is initiated by anomalous easterly wind in the eastern Pacific for single-year La Niña. However, for multi-year La Niña events, SSTA cooling is triggered by a mid-latitudinal influence (i.e., PMM/NPO). Such a difference in initiation of a La Niña explains why the meridional width of multi-year La Niña events exceeds that of single-year La Niña events.
4. During a La Niña peak period, single-year La Niña events have an equatorially confined SST cooling structure; however, multi-year La Niña events have intensified SSTA cooling and meridionally expanded easterly wind anomalies. In addition, the overall structure of multi-year La Niña events is shifted westward. Comprehensively, the SST structure of multi-year La Niña events is similar to Mega-ENSO. Thus, the recharging process of a singleyear La Niña is strong due to equatorially confined SST cooling/strong WSC, whereas that of a multi-year La Niña is relatively weak due to meridionally expanded SST cooling/weak WSC.
5. During a La Niña decaying period, the SSTA cooling of a single-year La Niña disappears with strong recharging, resulting in the termination of the La Niña. For multi-year La Niña, the SSTA cooling persists with a weak recharge. Because of the insufficient recharge, the surface cooling in the equatorial Pacific persists until the following summer. Bjerknes feedback is then initiated, resulting in the development of a second La Niña in boreal winter (Chen et al. 2016).
6. The iteration of processes 3 through 5 for a multiyear La Niña may lead to the development of another La Niña in the subsequent winter.
In summary, by analysing the statistically significant differences in precursory signals between single- and multi-year La Niña events, we observed that a midlatitude connection associated with the PMM/NPO, such as the meridional expansion of anomalous SST and wind stress fields, is critical for La Niña persistence. This indicates that there is similar dynamics operating during mega-ENSO and multi-year La Niña events. These results have important implications for improved ENSO prediction and provide an appropriate alternative interpretation to the state-of-the-art climate models in predicting multiyear La Niña events.
Major Sources of Information Used in this Weekly Report
|
.


