Written by Sig Silber
Updated at 6:30 pm EST to reflect the Week 3 – 4 weather forecast that returns the situation to pretty much warm and dry.
We cover an enormous amount of ground tonight. I want to focus on the impact of a moratorium on oil and gas leasing on Federal Property. But first, we look at the state rankings of temperature and precipitation in February and have a wonderful video of an agricultural sustainability panel discussion in Europe. The article tonight covers too many things to even mention in this summary. We even have a USDA Executive Briefing. As usual, we include a lot of other information including an intermediate-term weather forecast.

Please share this article – Go to the very top of the page, right-hand side, for social media buttons. Please feel free to send this article to anyone who you think might benefit from reading it.

But we are not going to ignore the drought or the poor prospects of an adequate Spring runoff. So that’s where we start:
| Last Week | This Week |
 |  |

Farm to Fork – Europe’s Plan to have Agriculture be more sustainable and Green.
Please read the rest of this article and then come back and watch this very interesting video.

Ecological Drought Webinar: An Introduction Click Here
Ecological Drought: Planning for Resilience Click Here
Ecological Drought Webinar: Drought, Wildfire, and Recovery Click Here
There will be a fourth webinar in the series. But it has not happened yet.
A couple of examples of the information provided by these three webinars in this case from the third webinar.


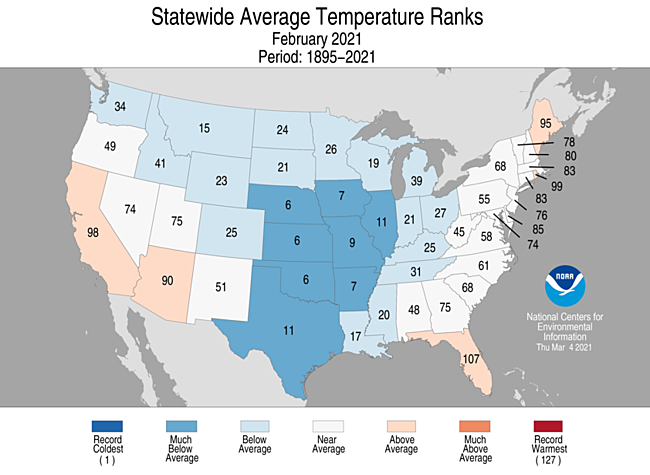
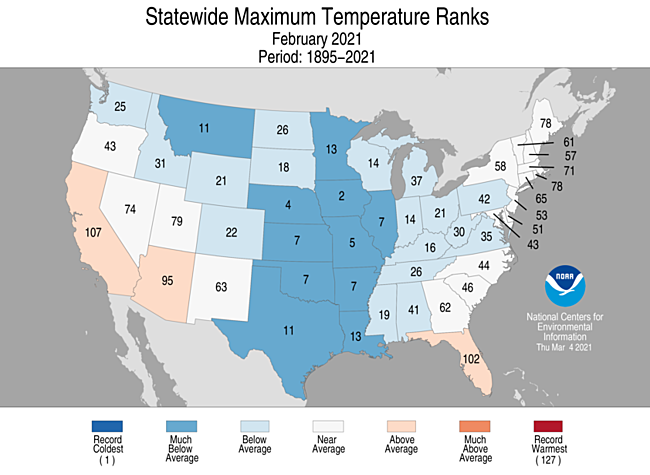
Let us take a look at the state rankings for February.

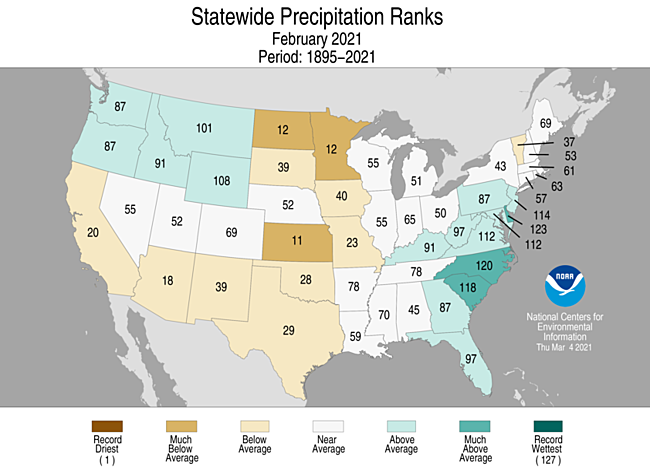
For precipitation, we like to take a look a the climate divisions within states

ENSO Update. This happens every month on the second Thursday


Where Things Stand in terms of Spring Runoff


This is a good place to look at the California Reservoirs

Key Reservoirs


Let’s look at the current drought situation.

And the week to week change

Here we look at four-time periods: one week, one month, six months, and a full year.

Drought Discussion (The Regional links are live and will take you to the drought map for that Region)
This Week’s Drought Summary
During the current period, most of the country was dry. There was some precipitation along the Gulf Coast and into the Southeast, with the greatest amounts over southern Georgia. Some storms impacted the Pacific Northwest as well, with coastal areas recording the most precipitation, especially on the coastal regions of far northwest California, southwest Oregon, and northwest Washington. Some scattered showers were recorded over the central Plains and New England, but generally these were not associated with significant precipitation. Temperatures were warmer than normal over much of the northern Plains and into the central Plains and Midwest with temperatures greater than 15 degrees above normal in the Dakotas. This took care of any remaining snows through the region and started the spring thaw on soils. Cooler than normal temperatures were recorded over much of the East and into the South where temperatures were 3-6 degrees below normal for the week. Cooler than normal conditions dominated much of New England with temperatures 9-12 degrees below normal.
Northeast
A cooler than normal week in the region was observed with temperatures generally below normal; the greatest departures were in New England areas, with some readings 10 degrees below normal. It was a fairly dry week, as all areas were below normal for precipitation. Drought status remained unchanged this week but there were a few areas in which abnormally dry conditions were expanded. In response to short- to mid-term dryness, abnormally dry conditions were expanded in eastern New York, southern Vermont, and western Massachusetts. Another area with abnormally dry expansion was in north central New York along Lake Ontario.
Southeast
The wettest part of the CONUS region was here with portions of southern Georgia recording up to 3 inches of rain. Outside of a few other pockets of rain in northern Florida and southwest Alabama as well as coastal areas of South Carolina, it was a dry week in the region. However, temperatures were well below normal, with departures of 6-8 degrees below normal in southeast Georgia, northern Florida, eastern South Carolina and central Mississippi. With dryness going back at least 6 months, the Alabama Forestry Commission noted an uptick in fire activity with over 100 wildfires burning in the state from March 6-9, compared to just 11 fires last year during the same period. The 2021 fire season in Alabama is eerily similar to that of 2016, which was also a dry year that saw 330 wildfires burn 6,000 acres from January through March 9. So far this year, 315 wildfires have burned 5,900 acres. With the dry conditions in portions of Alabama, moderate drought was expanded this week while areas of abnormally dry conditions were expanded in Georgia, Alabama, south Florida and Mississippi. Normal rainfall in the region is about 1.20-1.50 inches a week this time of year. As dry conditions prevail, the landscape is changing rapidly and deficits are accumulating. Short-term indicators are signaling that a rapidly developing “flash drought” may occur, especially if temperatures go above normal without substantial precipitation.
Midwest
Most of the region was warmer than normal for the week, with areas of the upper Midwest 15-20 degrees above normal for the week. Almost the entire region was dry this week, continuing a pattern of dryness over the last month. As the spring thaw continues, the warmth and dryness has allowed for expansion of abnormally dry conditions over northern Ohio, northern Indiana, Michigan, northeast Iowa, as well as in central and southern Missouri. Moderate drought was expanded over northern Minnesota and a new area of moderate drought was introduced in southeast Michigan and northwest Ohio. Outside of Kentucky, the region has been dry and will need to be watched closely for further degradation if this continues, especially as we go further into spring.
High Plains
Dry conditions dominated the region, outside of some showers that impacted eastern Colorado and western Kansas. Warmer than normal conditions were widespread, with the Dakotas into Nebraska recording temperatures that were 15-20 degrees above normal for the week. The Army Corps of Engineers are considering conservation measures on the Missouri River basin if dry conditions continue. The 2021 calendar year runoff in the basin is anticipated at 21.8 MAF, or 84% of average. This eliminated most remaining snow in the region and began the spring thaw of soils. Due to ongoing dryness in the Dakotas, severe drought was pushed eastward this week and moderate drought was expanded to the east as well into western Minnesota. Livestock producers in the Dakotas are already separating out their animals in anticipation of needing to sell some off due to drought in the region. Another aspect of a winter with very little snow is that fire danger has rapidly increased in North Dakota. The local National Weather Service offices have started making their fire weather products more than a month early in response to the drought conditions. So far, 33 fires have burned more than 20,000 acres in North Dakota. In Kansas, abnormally dry and moderate drought conditions were pushed to the east in response to the most recent dryness in the region and above-normal temperatures.
South
Temperatures were mixed in the region. Most of Texas and Oklahoma saw temperatures up to 3-6 degrees above normal while most of east Texas, southern Arkansas, Louisiana, and Mississippi were 3-6 degrees below normal. Dry conditions dominated the region with only portions of northern Oklahoma seeing any above-normal precipitation. Hay prices remained firm in the region with low hay stocks, due to drought, and producers needing to feed more during the recent cold snap in February. During this period, drought expanded and intensified over most of Texas and western Oklahoma where a mix of both short- and long-term issues are still embedded. A new area of exceptional drought was introduced over south Texas. In Louisiana, Arkansas, and Mississippi, abnormally dry conditions were expanded based on the short-term dryness in portions of those states missing out on recent rains. Abnormally dry conditions were also expanded over much of eastern Oklahoma and east Texas as the area continues to dry out.
West
Much of the region was dry this week with only areas of western Montana, northern California, southwest Oregon, and northwest Washington recording above-normal precipitation. Coastal areas were generally below normal for temperatures and most of the rest of the West was 3-6 degrees above normal. Water conservation measures are already beginning, with the Klamath County commissioners declaring a drought on the Klamath Basin as inflows into Upper Klamath Lake were some of the lowest in decades. As current snow data came in for December through February, some improvements were made in those areas with good seasonal snow accumulations and where the other indicators supported it. In Montana, moderate drought was improved in the southwest and south central portions of the state while severe drought was pushed farther to the west in the eastern portion of the state. Wyoming had improvements to moderate, severe, and extreme drought over the northern portions of the state. The Taos region of New Mexico also had improvements to the extreme and exceptional drought based upon the good snows in the Sangre de Cristo Mountains. Severe drought was pushed farther west along the California and Nevada border. North central Nevada also had some improvement to the extreme drought over the region based on the current water year data while portions of the severe drought in northeast Oregon also were improved based upon the current water year.
Alaska, Hawaii, and Puerto Rico
There were no changes in Hawaii this week, but the state was in the news for the flooding rains and the failure of a dam on portions of Maui and Oahu. The governor of Hawaii has declared a state of emergency to quickly release funds to assist those impacted by the flooding rains. Up to 19 inches of rain was recorded on parts of Maui as of noon local time on March 9. In Alaska, the abnormally dry conditions were expanded to include most of the northern portions of the state due to poor snow numbers in the upper elevations. Puerto Rico stayed dry with portions of the eastern part of the island having a new area of abnormally dry conditions introduced.
Looking Ahead
Over the next 5-7 days, it is anticipated that precipitation totals will be greatest over the central Plains and Midwest, with the most precipitation expected over portions of Kansas and Missouri. An active pattern is anticipated, with the Southwest and California expected to see some good precipitation over the next several days. The Southeast is expected to stay dry again.
The 6-10 day outlooks show the greatest chances of below-normal temperature are for almost all areas west of the Mississippi River, with the highest probabilities over the High Plains. The best chances for above-normal temperatures are along the eastern seaboard and in the upper Midwest, Florida and northern Alaska. A change in patterns may be underway, with the best chances of above-normal precipitation over the Southeast and eastern United States. There is an above-normal chance of below-normal precipitation over the Southwest and northern Plains.
More Regional Reports
The result of the drought is very dry soil conditions

March Drought Outlook


Since we are entering fire season it is time to start showing the wildland fire potential outlook. These will update automatically shortly after the month changes.


NASS Reports.
There are a number of them. I am only reporting on the Executive Briefing.


Intermediate-Term Weather Forecast
Showing from left to right, Days 1- 5, 6 – 10, 8 – 14, and Weeks 3 – 4 You can click on these maps to have them enlarge. Also, the discussions that go with these forecast maps can be found here (first two weeks) and here (Weeks 3 and 4).
First Temperature
|
|
|
|


And then Precipitation
|
|
|


The Week 3-4 Discussion is always interesting.(this was updated on Friday)
Week 3-4 Forecast Discussion Valid Sat Mar 27 2021-Fri Apr 09 2021
This Weeks 3-4 Outlook is made amidst a backdrop of fading La Nina conditions in the equatorial Pacific, while the enhanced phase of the Madden-Julian Oscillation (MJO) is presently over the Western Hemisphere. Extratropical impacts from the former begin to fade during boreal spring, while the latter is not in a particularly favorable region to drive teleconnections of North American sensible weather. As a result, the subsequent outlook is based primarily on dynamical model guidance with secondary considerations given to long-term trends.
Agreement among dynamical model guidance is high regarding the forecast circulation, featuring broad anomalous 500-hPa ridging across the Central CONUS. There are some nuanced differences among the forecast ridge axis (CFS further east, JMA further west, with the ECMWF straddling the two), but the net result favors increased chances of warm and dry conditions for much of the Lower 48 states. Model guidance also features some degree of anomalous troughing over the far northeastern Pacific, Bering Sea, and the Davis Strait. Revisiting the large scale modes from the prior paragraph, the projection of the MJO onto 500-hPa heights is weak across the Pacific and North America. Furthermore, there is no sign of anomalous troughing over Central Canada or the Upper Mississippi Valley in the dynamical model suite despite this feature being typical of La Nina conditions during late March and early April.
The net result of the model guidance is a high confidence forecast that generally favors above-normal temperatures and below-median precipitation across the CONUS. Highest confidence for above-normal temperatures lies across the Southern Rockies (greater than 80%) tied to the forecast position of the anomalous 500-hPa ridge axis. Temperature probabilities decay heading toward both coasts, with lowest probabilities for above-normal temperatures (50 to 55%) across the Pacific Northwest due to potential proximity of Pacific troughing and East Coast (potential for backdoor cold fronts for the Northeast, while height departures are the lowest over the Southeast). Highest confidence for below-median precipitation exists over the Four Corners, again tied to the forecast anomalous ridge axis, and for much of the Gulf Coast states through Mid-Atlantic given limited moisture availability. Equal-chances are carved out over portions of the Pacific Northwest (potential for some Pacific moisture tied to Pacific troughing), the Southwest (climatologically arid), and Upper Mississippi Valley (models hinting at some shortwave energy over top of the ridge, and some hints of a moisture feed from the Southern Plains through the region).
Above-normal temperatures are favored across Alaska, with the exception of the Aleutians and Alaska Peninsula where equal chances are forecast. Highest confidence in above-normal temperatures for Alaska exists for the North Slope, tied to potential southerly flow from the Bering Sea and appreciable long-term trends in temperature. The aforementioned enhanced onshore flow would also support increased above-median precipitation chances for parts of western mainland Alaska. Below-median precipitation chances are increased across the Panhandle through the Kenai Peninsula which appears situated between the moisture feed to its northwest and another likely into British Columbia. Hawaii favors above-normal temperatures becoming equal chances from west-to-east, given decreasing sea surface temperature anomalies oriented similarly. Mixed signals among dynamical guidance result in equal chances for above- and below-median precipitation across the islands.
Let’s discuss oil and gas.
Short-Term Energy Outlook
 |
 |
 |
 |
 |
Last month I published the following:
I began by presenting some information from a report done for the State of Wyoming. You can find the full report here. It covers Wyoming and a number of other Western States. You will see what states are covered in subsequent exhibits. It does not include Texas.
First, we start with a little history and some forecasts which presumably were the EIA reference case at the time this report was prepared. A new EIA report came out on February 3, 2021 and we will discuss that also.


Now I want to add additional information from a consulting study performed for the American Petroleum Institute by a consulting firm called OnLocation.


and one more

Double Dip La Nina Continued
I want to attempt to present a paper that explains why we have more La Ninas than El Ninos. I think you can read the full paper here. I am not positive of that because I am registered with ResearchGate but they did not ask me to log in so I think you can access the full article but hopefully I will present enough for readers to understand the concept.
I have not made any progress on this since last week but I am leaving it in the article for those who may want to think about the issue and I will try to expand the discussion below next week.


The rest of the discussion is later on in the article. And consider this an introduction because some of my readers may be familiar with this but for me, it is uncharted territory. So I need to do a lot more research. But what caught my interest was the part of the discussion not shown here but in the slides that are presented later in this article which suggests that the Pacific Decadal Oscillation or PDO does not explain as much about weather cycles (what I call low-frequency weather cycles) as I have assumed and that there are other factors now that need to be included in the analysis. One of the two is the Pacific Meridional Model or PMM mentioned in the Abstract. If that is the case, and I can come across some other references to this it is very important – let me just say it that way.
I have moved the other slides I made to somewhere close to the end of this article. I will be coming back to this topic very soon. I am not sure yet if this theory if you want to call it that explains why we may have a two-year La Nina this time around. It is not clear that we will but some of the models suggest it. Not all La Nina’s are dry for the Southwest but most are. So if the ratio of two-year La Ninas to one-year La Ninas is increasing, that is very important. I could have held back all this information until was read to fully discuss it but that did not seem to be proper. Some of my readers may know more about this and can leave me messages in the comment section that follows every article I publish.
I also see the possible connection of what is discussed in this paper with the storm we just had. In the article I posted last night on the NOAA four-season forecast I provided some snapshots of the Equatorial Pacific which showed a lack of movement of the cool and warm anomalies. I showed four snapshots which basically covered three months but I could have gone back many more months and it would have looked similar. You can see that set of graphics here. The importance of that is this La Nina is not decaying rapidly. So it could last into next winter or fade for a short period of time and later regain La Nina Status. I am not making any predictions here but I am raising the question of has something fundamentally changed?
I am certainly familiar with the deliveries to Elephant Butte the major reservoir on the Rio Grande and I am familiar with the deliveries to the three beneficiaries of that project namely an irrigation district in New Mexico, a similar irritation district in El Paso County Texas, and Mexico. Shortly after the MegaNino of 1997 and the subsequent La Nina of 1998 deliveries declined to Elephant Butte Reservoir and to the three (there is actually a fourth in good years when there is surplus water available to Hudspeth County Tx under a Warren Act Contract). I concluded that this was a normal change of phase of the PDO but perhaps there is more to it. So that explains my interest in the topic and although I frame the issue in a New Mexico context it impacts essentially all of the U.S.


Just what is the Pacific Meridional Mode?
This may help a bit. It is a second reference to the issue and this time an NOAA article. BTW, the fish are never wrong. We create indices on observed fish behavior. If their behavior deviates from what our indices suggest their behavior should be, it is not because the fish are confused it is because our indices or models no longer are accurate.
This graphic also might help


4 | DISCUSSION AND SUMMARY
From the present study, it is necessary to discuss two possible factors responsible for modulating La Nina persistence. The first is the preceding El Nino amplitude. From a linear perspective, the discharging amount is proportional to the El Nino amplitude. With strong discharging, significant SSTA cooling could last more than 2 years. The preceding El Nino amplitude also affects the intensity of the interbasin SSTA gradient by influencing the adjustment time of the Indian and tropical Atlantic Oceans to the Pacific SSTA (Wu et al., 2019). More specifically, the delayed response of SST cooling over the Indian and tropical Atlantic Oceans, in comparison with the Pacific cooling, allows the easterly wind anomaly over the western Pacific to be dominated even after the La Nina decaying phase. This initiates a La Nina that tends to persist up to 2 years. However, the role of the Indian Ocean capacitor effect on western Pacific wind anomalies has been questioned by Chen et al. (2016). Using data analysis and numerical experiment, the authors claim that the Indian Ocean basin warming during mature El Nino wintertime events has little effect on the easterly anomalies in the equatorial western Pacific, and the local process over the western Pacific has more influence over the Indian Ocean capacitor effect. Further numerical experiments may provide quantitative insight in to the importance of these factors, which is beyond the scope of this study. The second factor is a recharging/discharging efficiency with respect to anomalous wind-stress/WSC relevant to SSTA patterns, which contributes to ENSO phase transition. This was the focus of this study. An EP-type El Nino preceding a La Nina leads to strong discharge by positive WSC (0 – 15N) that is widely spread over the Pacific basin, which induces a strong and long-lasting La Nina. When a La Nina develops through the mid-latitude connection (PMM or NPO), SSTA cooling and a tropical easterly wind anomaly expand to the North Pacific. In this case, an anomalous negative WSC is weak and, thus, the recharging efficiency by equatorial Rossby waves is low. Consequently, to understand La Nina persistence, it is reasonable to consider both the preceding El Nino amplitude and recharging/discharging efficiency by anomalous SST/wind-stress patterns as the La Nina evolves. In this study, we investigated how the evolution of single- and multi-year La Nina events differs from their onset phase by analysing both observational and climate model data sets. Our analyses showed that there was a significant difference in the evolution between the two types of La Nina events, even from their initial development associated with a mid-latitude connection. These differences are described as follows (Figure 10).
1. A weak CP-type (Nino-4 > Nino-3) El Nino tends to exist one year prior to a single-year La Nina event, whereas a strong EP-type (Nino-3 > Nino-4) El Nino tends to exist prior to a multi-year La Nina event.
2. For single-year La Nina events, negative WSC, associated with CP-type El Nino and confined to the western Pacific, induces weak discharge that leads to a weak La Nina. In contrast, a widely extended negative WSC of a multi-year La Nina in the Pacific basin causes efficient discharge, resulting in a strong La Nina.
3. From the decay of an El Nino to a La Nina developing period, SSTA cooling is initiated by anomalous easterly wind in the eastern Pacific for single-year La Nina. However, for multi-year La Nina events, SSTA cooling is triggered by a mid-latitudinal influence (i.e., PMM/NPO). Such a difference in initiation of a La Nina explains why the meridional width of multi-year La Nina events exceeds that of single-year La Nina events.
4. During a La Nina peak period, single-year La Nina events have an equatorially confined SST cooling structure; however, multi-year La Nina events have intensified SSTA cooling and meridionally expanded easterly wind anomalies. In addition, the overall structure of multi-year La Nina events is shifted westward. Comprehensively, the SST structure of multi-year La Nina events is similar to Mega-ENSO. Thus, the recharging process of a singleyear La Nina is strong due to equatorially confined SST cooling/strong WSC, whereas that of a multi-year La Nina is relatively weak due to meridionally expanded SST cooling/weak WSC.
5. During a La Nina decaying period, the SSTA cooling of a single-year La Nina disappears with strong recharging, resulting in the termination of the La Nina. For multi-year La Nina, the SSTA cooling persists with a weak recharge. Because of the insufficient recharge, the surface cooling in the equatorial Pacific persists until the following summer. Bjerknes feedback is then initiated, resulting in the development of a second La Nina in boreal winter (Chen et al. 2016).
6. The iteration of processes 3 through 5 for a multiyear La Nina may lead to the development of another La Nina in the subsequent winter.
In summary, by analysing the statistically significant differences in precursory signals between single- and multi-year La Nina events, we observed that a midlatitude connection associated with the PMM/NPO, such as the meridional expansion of anomalous SST and wind stress fields, is critical for La Nina persistence. This indicates that there is similar dynamics operating during mega-ENSO and multi-year La Nina events. These results have important implications for improved ENSO prediction and provide an appropriate alternative interpretation to the state-of-the-art climate models in predicting multiyear La Nina events.
International

This week fortunately we do have a map.

In the box are shown the major resources we use. We will not be using them all each week but the reader is welcome to refer to these resources.
Major Sources of Information Used in this Weekly Report
|
.


