Written by Sig Silber
Edited on January 9, 2021 at 4:20 p.m. EST to include a useful link.
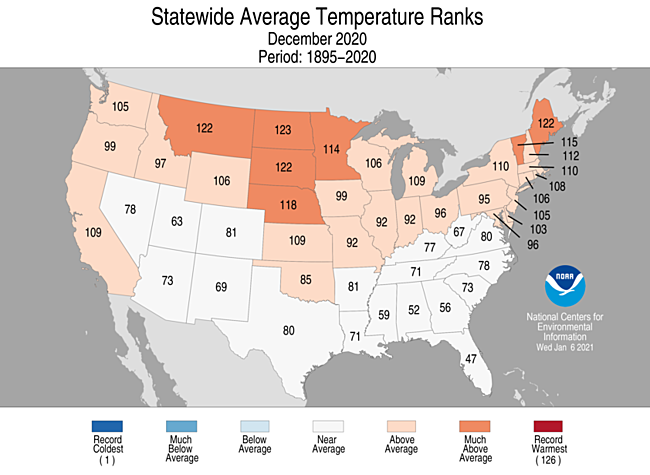
We have a NASS state by state report on December 2020 weather and agriculture progress. It is not as easy to read when the information is organized into tables, but it is easier to look at the situation in individual states. We feature the state rankings over the last 126 years with respect to temperature and precipitation recorded for December 2020. We have NASS reports on grain crushing, dairy products, broiler hatchery, and cotton consumption. We have a summary of the drought situation. There is a lot more in our report this week. And of course, this article contains the intermediate-term weather forecast.

No need to panic. It is not a horror show compared to the political situation. But you might want to read the discussion that is included with the Intermediate-Term Forecast. The discussion came out today and covers Weeks 3 and 4.
Please share this article – Go to the very top of the page, right-hand side, for social media buttons. Please feel free to send this article to anyone who you think might benefit from reading it.
Last week we looked at the state rankings for temperature and precipitation for November. Now we look at the three-month period of September – November


Sometimes it is useful to look at the climate divisions within states.

Severe Weather


Agriculture State Summaries
 |
 |
 |
 |
 |
 |
Let’s look at the current drought situation.

And the week to week change

And the three-month change

Here we look at four-time periods: one week, one month, six months, and a full year. (It will not have been updated when published but we will update it after NRCS publishes it. We could create it ourselves now but I prefer to let someone else do it and we have shown the one week and three months above.)

December Drought Outlook

And here is the discussion – the long version
Discussion for the Monthly Drought Outlook
Tools used in the U.S. Monthly Drought Outlook (MDO) included the Climate Prediction Center (CPC) updated temperature and precipitation outlooks for January, various short- and medium-range forecasts and models such as the 7-day quantitative precipitation forecast (QPF) totals from the Weather Prediction Center (WPC), the 6-10 day and 8-14 day CPC extended-range forecasts (ERFs), the Week 3-4 outlooks and tools from CPC, dynamical models at the monthly time scale, the 384-hour total precipitation forecasts from several runs of the GFS, and climatology for January, with the December 31 U.S. Drought Monitor used for current drought conditions. Recent precipitation deficits and surpluses were also considered. La Niña conditions are present in late December, and are likely (~95%) to continue through the Northern Hemisphere winter, and into spring 2021 (~50% during April-June).
During December, early season Pacific moisture brought rain and mountain snow across the Northwest, resulting in some modest improvements to drought conditions across Washington, Oregon, northern Idaho, and Montana. A late-month storm is ongoing and bringing additional precipitation to the region, forecast accumulations based on the WPC 7-day QPF are generally more than 3.0 inches liquid equivalent along the coast and at higher elevations. Beyond the near term storminess, a wetter pattern is favored for the Pacific Northwest and northern California from Week-1 to a month, which will bring additional relief during January. Therefore, one class drought improvement is the favored outcome. Although the updated monthly outlook calls for increased chances of above normal precipitation for a larger area of California and the Great Basin, widespread persistence is most likely on a monthly time scale. Persistence is likely for the worst drought conditions throughout the Southwest.
For the Western Region, forecast confidence is moderate for the Southwest, and moderate to high for the coastal areas and Pacific Northwest.
A narrow band of heavy precipitation during December brought some drought relief to southwest Kansas, while drought conditions persisted across the Dakotas. Elsewhere, little change to the drought depiction occurred over the previous four weeks. January is a dry time of year for the High Plains, with colder temperatures gradually causing soils and streams to freeze. Given its a dry time of year, persistence is most likely for much of the High Plains region.
Forecast confidence is moderate to high for the High Plains Region.
Earlier in December, widespread drought expansion and intensification occurred across Texas and parts of the lower Mississippi River basin. At the end of the month, however, widespread rainfall occurred across eastern Texas, Louisiana, and the western Gulf Coast, with amounts of more than 2 inches in some locations. Once this moisture absorbs into the soil and runs off into streams and rivers, it is expected to bring relief to the newly developed short term drought conditions. Improvement or removal of D1 (moderate drought) are indicated where recent rainfall totals exceeded 2 inches. Additional heavy rainfall is anticipated across the western Gulf Coast during Week-1 and a wetter pattern is favored for January. Therefore, drought improvement or removal is forecast for eastern Texas and the lower Mississippi Valley along with southeast Oklahoma. Persistence is likely farther to the west due in part to a drier climatology. The Southeast is expected to remain drought-free through the end of January due to recent wetness and increased chances of above normal precipitation during the next month. Given the ongoing La Niña conditions, drought development as indicated on the seasonal outlook may still occur by the end of March.
Forecast confidence is moderate for the Southern and Southeastern Regions.
A major winter storm brought widespread precipitation (0.5 to 1.5 inches, liquid equivalent) from northern Missouri and southern Iowa east to Illinois and Indiana during the final week of December. The updated January outlook favors above normal precipitation for the Midwest Region. Therefore, drought improvement or removal is indicated on this outlook for existing drought areas.
Forecast confidence is moderate for the Midwest Region.
During December, periodic storminess across the Northeast brought gradual drought relief to most areas. During late December, much of this region received more than 2 inches (liquid equivalent) of precipitation which resulted in a 1-category improvement to lingering drought areas in Pennsylvania, New York, southern New Hampshire, and Maine. Additional storminess is expected during early to mid-January and the updated monthly outlook favors above normal precipitation. Therefore, continued drought removal is likely.
Forecast confidence is high for the Northeast Region.
No drought is currently depicted or anticipated to develop across Alaska for January. January is the dry season for Puerto Rico and no wet signal is forecast. Therefore, drought persistence is likely for the small areas of drought. For Hawaii, La Niña conditions typically result in enhanced trade winds, which increase the potential for drought relief across the leeward sides of the islands. Dynamical model forecasts show the potential for drought relief across the Islands. Based on these factors and it is the rainy season, drought improvement or removal is forecast.
Forecast confidence is moderate for Hawaii and Puerto Rico, and high for Alaska.


Intermediate-Term Weather Forecast
Showing from left to right, Days 1- 5, 6 – 10, 8 – 14, and Weeks 3 – 4 You can click on these maps to have them enlarge. Also, the discussions that go with these forecast maps can be found here (first two weeks) and here (Weeks 3 and 4).
First Temperature
|
|
|
|


And then Precipitation
|
|
|


The Week 3-4 Discussion is always interesting.
Week 3-4 Forecast Discussion Valid Sat Jan 23 2021-Fri Feb 05 2021
Numerous complex climate-scale drivers are expected to be at play during late January and early February, which introduce a high degree of uncertainty to this Week 3-4 Outlook. The atmospheric response to ongoing La Nina conditions remains the largest contributor in terms of tropical teleconnections, although enhanced convection developing over the Indian Ocean as reflected on the RMM-based MJO index may also play a role in the evolution of the extratropical pattern. Specifically, enhanced Indian Ocean convection is associated with mid-level ridging and warming temperatures across the eastern CONUS, while La Nina conditions favor colder conditions across the north-central CONUS. Additionally, a sudden stratospheric warming (SSW) event was recently observed over the Arctic, resulting in a split of the Polar Vortex. Should this stratospheric event couple well with the troposphere, it may increase the potential for outbreaks of arctic air into the midlatitudes. Statistical guidance based on coupling of the stratosphere and troposphere indicate a connection with colder conditions across the eastern CONUS, which would oppose the tropical forcing. Additionally, should the negative phase of the North Atlantic Oscillation (NAO) persist, it would represent a background state favorable for blocking patterns. Current below-average snowpack conditions across central Canada may also present a limiting factor for arctic airmass development.
Given the exceedingly complex panoply of potential drivers, it is no surprise that there is considerable variability in the dynamical model 500-hPa height forecasts. Consistent with a canonical La Nina response, all of the model solutions depict robust ridging south of Alaska, with a downstream trough located somewhere over North America. The CFS places the trough over central Canada, while the ECMWF, JMA, Canadian, and GEFS retrograde the trough from its anticipated position over the eastern CONUS during Week-2 to western Canada or the Pacific Northwest. All of the tools build a weak ridge over the Southeast, and while most maintain a ridge-trough couplet (ridging over Greenland and the Davis Strait and troughing over the North Atlantic) consistent with a negative NAO structure, the CFS largely breaks this pattern down. Notably, none of the dynamical models indicate the presence of widespread arctic air over the CONUS, but it is unclear how well these systems model the coupling of the stratosphere and troposphere.
Given the lack of arctic air outbreaks, the dynamical models generally favor above-average temperatures over the CONUS, and below-average temperatures across eastern Alaska due to northerly flow with ridging to the west and troughing to the east. Statistical guidance based on the RMM-index, ENSO, and long term trends also presents a warm solution as both the warm trends and eastern CONUS ridging in response to the Indian Ocean convection counteract the potential for northern tier cold associated with La Nina conditions. Confidence in these outlooks is extremely low, however, due to uncertainty regarding the potential coupling of the troposphere to the SSW event, and a highly transient pattern during the outlook period that suggests the presence of cold air during Week-3 and a warm-up during Week-4. The Sub-X (Subseasonal experiment) multi-model ensemble also serves as a counterweight to the operational dynamical model guidance, depicting a colder solution for the eastern US. Therefore, the temperature outlook maintains a wide area of equal chances for above- or below-average temperatures extending from the Northwest to the eastern two-thirds of the CONUS. Above-average temperatures are slightly favored for the Southwest due to strong model agreement, and below-average temperatures are forecast for eastern Alaska due to a pattern favoring northerly flow.
The precipitation outlook is based on a consensus of dynamical and statistical model guidance, and is largely consistent with a canonical La Nina response. Dynamical model precipitation forecasts are mixed for the Pacific Northwest, with the JMA, Canadian, and GEFS favoring wetness while the ECMWF and CFS depict a potential for near or below-median precipitation. Therefore, equal chances for above- and below-median precipitation were maintained for the Pacific Northwest. Most of the guidance depicts a wet signal over the Northern Rockies and northern High Plains, with probabilities decreasing as climatology increases towards the upper Midwest. The ECMWF solution is quite dry for much of the eastern U.S., while the other models show a potential favored storm track anywhere from the lower Mississippi Valley (CFS) to the Great Lakes (JMA). The Canadian and GEFS favor a highly active pattern across much of the eastern third of the CONUS. Based on the autoblend of the dynamical and statistical model guidance, above-median precipitation is slightly favored for the mid-Mississippi Valley through the Great Lakes. Should cold air outbreaks occur during the period, abnormally warm water temperatures in the Great Lakes would favor periods of Lake-effect snows downstream. Across Alaska, northerly flow and dynamical model consensus support increased chances for below-median precipitation across the southern half of the state.
SST anomalies remain positive in the vicinity of Hawaii, resulting in elevated chances of above-normal temperatures. Dynamical model precipitation forecasts are mixed; therefore, equal chances for above- and below-median precipitation are maintained for Hawaii.
Agriculture Situation NASS Reports


International

This week we do not have a map.
In the box are shown the major resources we use. We will not be using them all each week but the reader is welcome to refer to these resources.
Major Sources of Information Used in this Weekly Report
|
.


