Written by Sig Silber
I am optimistic that this Southwest Drought will ease up within six months (as La Nina ends) but for now and into summer it is a true crisis for parts of the U.S. and needs to be approached that way. Nevertheless, the major crops are still looking good. Energy prices favor consumers rather than producers as temperatures have remained warmer than usual. Tonight we provide the NOAA ENSO Update Report, the State Temperature and Precipitation rankings for the prior three months August through September, Some updated information on the status of Colorado Basin Reservoirs, the Crop Progress Report, a brief International Report, and the Intermediate-term Weather Forecast.

Please share this article – Go to the very top of the page, right-hand side, for social media buttons. Please feel free to send this article to anyone who you think might benefit from reading it.
| Table of Contents |
- Special Topics for this Week (ENSO Update, State Rankings, Reservoir Conditions)
- Crop Progress
- Intermediate-Term Weather Forecast.
- Soil Conditions
- International
- Major Sources of Information
- Background Information
|
Special Topic for this Week –

The key here is the one month longer duration of La Nina. This shows up better in the next graphic.

You can see that the forecast on the left shows La Nina likely for MAM,2021 whereas the forecast on the right showed ENSO Neutral more likely for that same three-month period. The two forecasts do not use the same methodology. The forecast on the left is the first forecast of the month and is based on a survey of meteorologists. The forecast on the right was the second forecast in October and was based on computer models. I personally trust the models more than I trust the meteorologists but the meteorologist are of course looking at model results. The seasonal outlook tends to be based on the first forecast of the month so what we see on the left, most likely will be what is used for the Seasonal Outlook that will be issued this Thursday.
Some tropical events.


Hurricane Eta really covered a lot of ground.
Now let us take a look at the State Rankings with respect to Temperature and Precipitation. Remember the states are ranked with respect to the 126 years of what is considered very reliable data. The color-coding makes it easy to interpret the map.
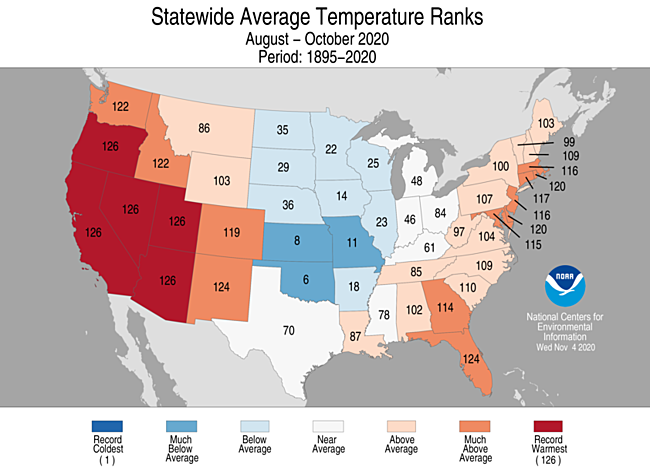
Five states set a record and twelve more were much above average. But three states were much below average with nine more below average. So it was a mixed picture to some extent.
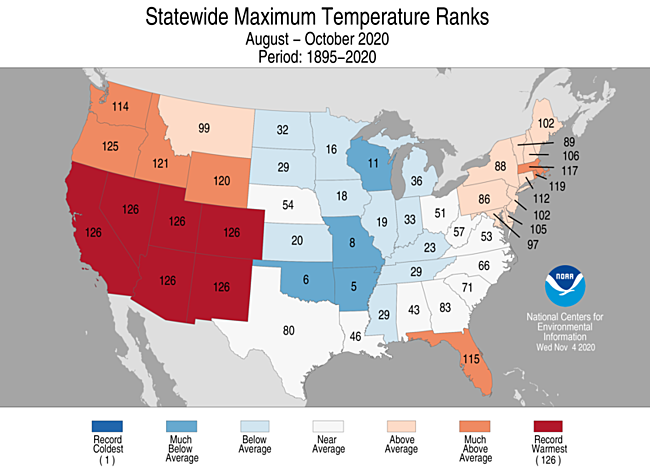
Here we look at maximum temperatures rather than the average over each day. Six states set a record. Seven more were much above average and four states were much below average.
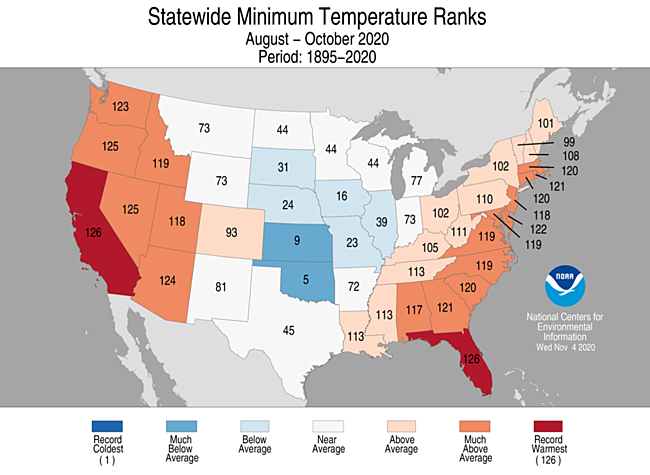
When you look at minimum temperatures, California shows up again as setting a record but It is joined by Florida. Florida tends to be humid so it does not cool off at night as easily as some other states.
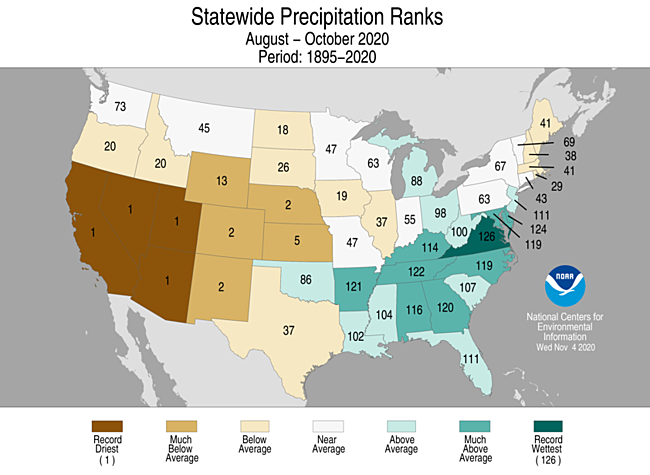
With respect to precipitation four states set records for being dry during the period ASO 2020. Three states were the second driest in their 126-year history. On the other hand, Virginia set a record for being wet.
Sometimes it is useful to look at climate divisions within states. This information is available for both temperature and precipitation but I find it of most interest for precipitation
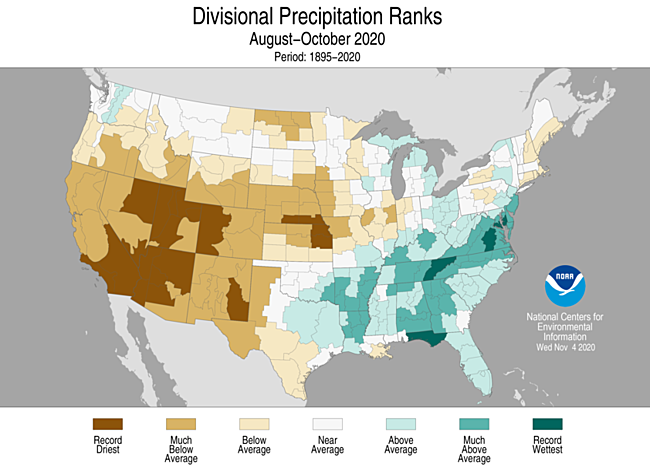
You can see the dry pattern this way a bit better than looking at it by states. You also see the wet pattern a bit better also.
Reservoir Status with a focus on the Colorado River.

We do not want to see the level in the brown shaded area.

It is difficult for me to find an updated graphic for Lake Mead so I was happy to find it. Again we do not like to see the water level in brown area.

It is not in great shape but not in the brown,

This one also is in the yellow area.

Here is another one in the brown area.

This one is in fine shape.
Here is the weekly U.S. Crop Progress Report. When we have an Executive Presentation, it provides a lot more information than the weekly Crop Production Report but the Crop Production Report usually includes one additional week of data so that is why we also report it.
Generally speaking, the weather did not cooperate that well with respect to fieldwork.

It was a fair week for fieldwork. Only Idaho and Delaware, Maryland and North Carolina were in the Yellow Category (3.4 days or less) meaning less than half a week of days suitable for fieldwork. Montana had only two days suitable for field work. But a lot of states were in the green category which still meant some days not suitable for harvesting.
Soil Moisture
Some improvement this week.
A different view is provided by the Drought Monitor. This is from last Thursday.

There is a lot of information available on drought. Where you see D4 Drought, that is pretty severe but it does not impact irrigated crops.
We have been paying attention to soils that are two dry but with the recent tropical storms we now need to also pay attention to soils that are too wet.
It is only five states that have soil surplus but if they are in harvest time that is a problem for them.

If it gets cold, there is not much snow cover for winter wheat.
Intermediate-Term Weather Forecast
We are including the forecast because of concern about freezing temperatures along the Northern Tier. That could be a problem.
Showing from left to right, Days 1- 5, 6 – 10, 8 – 14, and Weeks 3 – 4 You can click on these maps to have them enlarge. Also, the discussions that go with these forecast maps can be found here (first two weeks) and here (Weeks 3 and 4).
First Temperature
And then Precipitation
International

This week we have a map.

It is a mixed picture this week. It is a combination of dry where dry is not desired and wet where it is harvest time.
Major Sources of Information
In the box are shown the major resources we use. We will not be using them all each week but the reader is welcome to refer to these resources.
Major Sources of Information Used in this Weekly Report - The U.S. Drought Monitor (the full report can be accessed here)
- Selected graphics from our other Weather and Climate Reports are repeated in this report. These reports can be accessed by referencing the Directory here
- Selections from the Tuesday USD Weather and Crop Bulletin (the full report can be accessed here). Selections from the USDA Office of the Chief Economist can be found here. NASS Executive Briefings can be found here. A wide range of NASS Reports can be found here. USDA Foreign Agriculture Service Briefs can be found here. Other useful sources of information that I regularly utilize are the National Integrated Drought Information System (NIDIS) which can be accessed here and the USDA NRCS Weekly and Weather Climate Update which can be accessed here. A glossary of terms can be found here.
|
.


