Written by Sig Silber
Tonight we first take a look at the state rankings for October relative to temperature and precipitation and then we present the USDA/NASS Executive Briefing on crops plus the weekly U.S. Crop Progress and Condition Report. It all looks pretty good. The corn and soybeans forecasts are a bit down from the prior forecast but they still look good.

Please share this article – Go to the very top of the page, right-hand side, for social media buttons. Please feel free to send this article to anyone who you think might benefit from reading it.
First, we start with the October State Rankings with respect to Temperature and Precipitation. The weather for October is slotted in with respect to the 126 years of historical data.
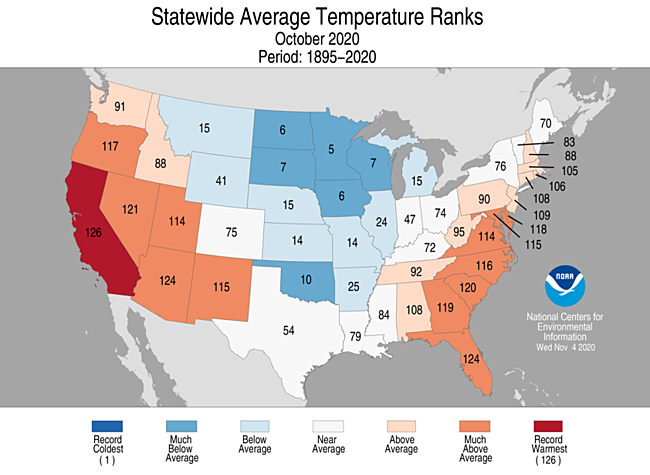
One new record in California. It had the warmest October in terms of the daily average temperature in the 126 years of record keeping. Lot’s of Orange much above average and also a lot if light blue and darker blue signifying below and much below average. So we had a lot of variety.

Again one new record in California. It is useful to look at the average temperature, the highs and the lows. That is why there are three graphics here.

One state set a record. But with respect to the lows it was Florida that set the record. Again there was a lot of variability in October with a lot of states being warm and many states being cool.
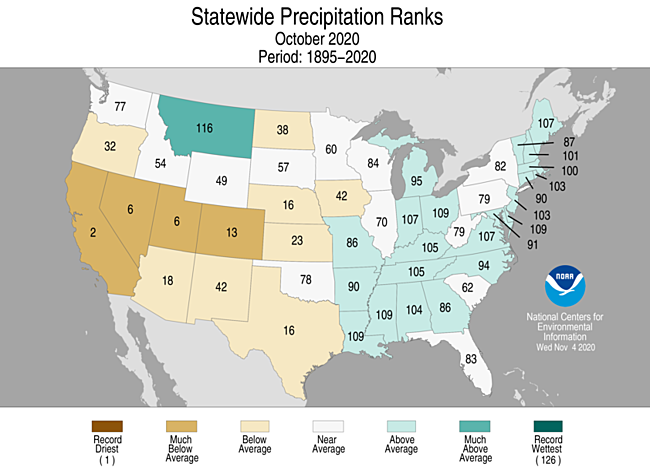
No records set but California had its second driest October in the 126 year record.
Sometimes it is useful to look at climate divisions
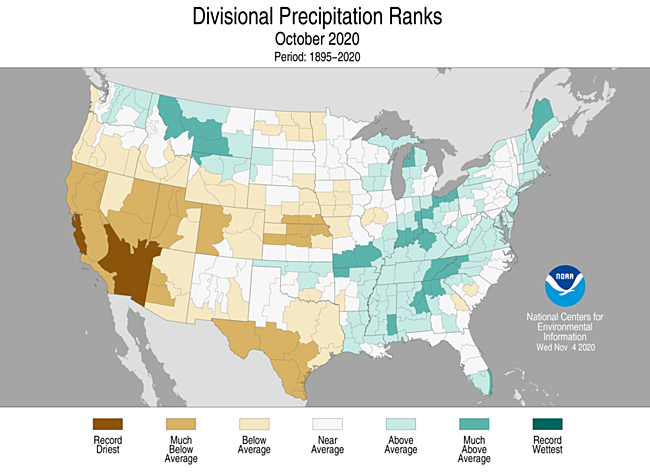
There were climate divisions in California and Arizona that had record dryness.
Here is the NASS Executive Briefing


This shows the data sources.

Corn harvesting has caught up with 2016

A little less than the prior estimate but the higher yield has led to a fairly large increase in production

It still looks like an upward trend but the trend may be leveling off.

This shows the change from the prior month. North Dakota had a big decline possibly weather-related.

Computer model analysis of yield based on satellite data.

They track corn better than COVID-19 is tracked.

It is not record corn production but it is up there.

The NASS estimate is the low estimate so the final might be a bit higher. We will see.

Soybeans have looked good from the start.

A decline from the prior estimate but still a big increase from last year.

The trend looks good but no record is likely to be set this year.

This shows the change in yield from year to year.

This is the computer modeling of yield based on satellite data.

Simply data on methodology

Notice there are two things shown here: the number of pods and the yield.

Not a record year but a lot better than last year.

But again, as with corn, the NASS forecast is below the spread of the various industry forecasts so there might be some improvement.

Cotton had a slow start but is looking better and better even though we have had some weather that might not have been ideal.

Cotton certainly has not been the happy story we have had with corn and soybeans but less cotton was planted and harvesting was down also but the yield increased a lot. It is a complicated situation.

It looks like record yield.

This shows where the yield changed from the prior month. It is a bit surprising given the tropical storm activity.

It is not a great year for cotton,

Here is information on some other crops. Other than potatoes they all are up over last year.

More reports to come. We will report on some of them.

Here is how to get these reports and talk to someone about them.
Here is the weekly U.S. Crop Progress Report. When we have an Executive Presentation, it provides a lot more information than the weekly Crop Production Report but the Crop Production Report usually includes one additional week of data so that is why we also report it.
 |
| The above is a very good summary of the situation. Below it is broken down in more detail state by state. |
 |
 |
| Crop | Progress | Condition | | Corn | Much better than 5-Year Ave. | NA | | Soybeans | Better than 5-Year Ave | NA | | Cotton | Now better than 5-Year Ave. | NA | | Sorghum | Better than 5-Year Ave | NA | | Peanuts | Slow | NA | | Winter Wheat | Better than 5-Year Ave | Just OK | | Sunflowers | Much better than last year and very much better than 5-Year Ave. | NA |
|
Generally speaking, the weather did not cooperate that well with respect to fieldwork.

It was a good week for fieldwork. Only Vermont was impaired by the weather.
Soil Moisture
I did not show the prior week but this is a bit drier. Actually the change from last week is shown on the graphic. At this point in is probably not a problem other than for winter wheat but it might impact conditions in the Spring.

If it gets cold, there is not much snow cover for winter wheat.
Intermediate-Term Weather Forecast
We are including the forecast because of concern about freezing temperatures along the Northern Tier. That could be a problem.
Showing from left to right, Days 1- 5, 6 – 10, 8 – 14, and Weeks 3 – 4 You can click on these maps to have them enlarge. Also, the discussions that go with these forecast maps can be found here (first two weeks) and here (Weeks 3 and 4).
First Temperature
And then Precipitation
International

This week we have a map.

It looks pretty good. Australia actually would have preferred less precipitation during harvest time in West Australia.
Major Sources of Information
In the box are shown the major resources we use. We will not be using them all each week but the reader is welcome to refer to these resources.
Major Sources of Information Used in this Weekly Report - The U.S. Drought Monitor (the full report can be accessed here)
- Selected graphics from our other Weather and Climate Reports are repeated in this report. These reports can be accessed by referencing the Directory here
- Selections from the Tuesday USD Weather and Crop Bulletin (the full report can be accessed here). Selections from the USDA Office of the Chief Economist can be found here. NASS Executive Briefings can be found here. A wide range of NASS Reports can be found here. USDA Foreign Agriculture Service Briefs can be found here. Other useful sources of information that I regularly utilize are the National Integrated Drought Information System (NIDIS) which can be accessed here and the USDA NRCS Weekly and Weather Climate Update which can be accessed here. A glossary of terms can be found here.
|
.


