Written by Sig Silber
Tonight we present the weekly U.S. Crop Progress and Condition Report which continues to look good. The snow along the Northern Tier could present a problem so that needs to be watched. We also take a look at the three-month temperature and precipitation rankings by state. We looked at September a couple of weeks ago and now we will look at July through September.

Please share this article – Go to the very top of the page, right-hand side, for social media buttons. Please feel free to send this article to anyone who you think might benefit from reading it.
Let’s first take a look at the state rankings for the three-month period July through September

Three states set a record and there are a whole bunch that were much above average. There were also some states that were below average. At this point, we have in most cases 126 years of data that are considered reliable. The ranking is where a state fits within its own 126 years of data. If this three-month period was the warmest ever it gets ranked 126. If it was the coldest ever it gets ranked 1. The color coding makes it easy to group them.

For maximum temperatures, five states set a record and a lot of states were much above average. But there were also a lot of states that were much below average. That is strange.

For minimum temperatures, three states set a record with a lot that were much above average. So it looks like for many states the minimums were high but the maximums were often not high. This is what climate scientists will happen with Climate Change. There are some good things about that but for many fruit trees and other plants it may be a problem as they need to have a certain number of chilling hours to have abundant flowering occuring at the right time. Will plants adapt or will differnent varieties grown that need fewer chilling hours?
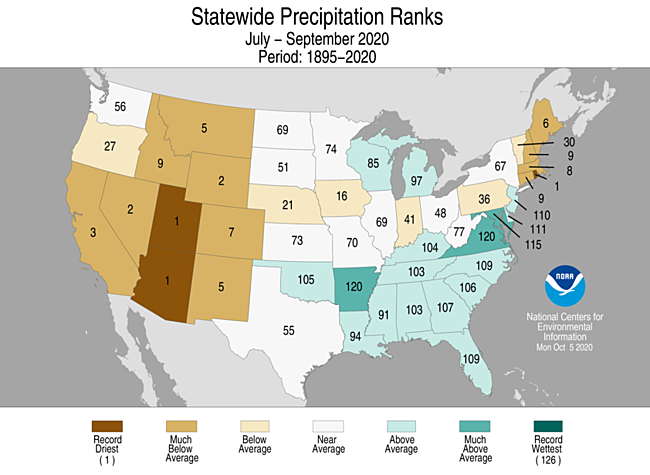
For precipitation, it is no surprise that two states set records and seven nearby states were much below average and five states in New England were also much below average. But there were also many states the were above average and three states were much above average.
It is available for both temperature and precipitation but I like to look at the data for precipitation by climate division.
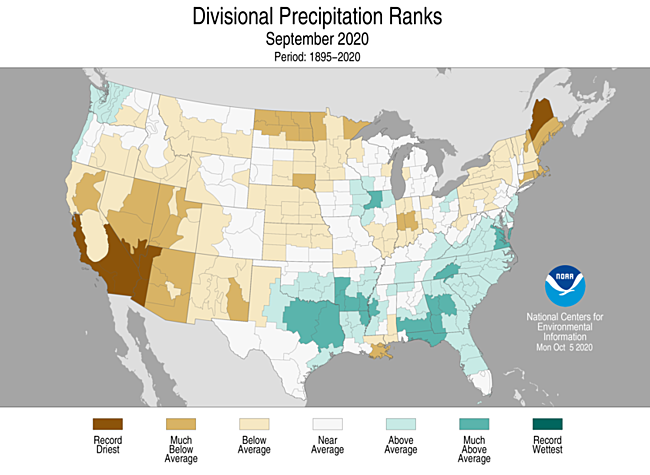
You get a better feel this way for where it was wet and where it was dry. The pattern in California is very interesting.
Soil Conditions in the U.S.
Let us first take a look at soil conditions
The percent short is still high but it is a big improvement over last week.
Here is the weekly U.S. Crop Progress Report.
Generally speaking, the weather cooperated with respect to fieldwork.

Not looking good in the Great Lakes Area.

Here is why and that snow is moving east.
Intermediate-Term Weather Forecast
We are including the forecast because of concern about freezing temperatures along the Northern Tier. That could be a problem but it looks like it is a couple of weeks out.
Showing from left to right, Days 1- 5, 6 – 10, 8 – 14 and Weeks 3 – 4 You can click on these maps to have them enlarge. Also, the discussions that go with these forecast maps can be found here (first two weeks) and here (Weeks 3 and 4).
First Temperature
And then Precipitation
International

And the map.

It looks pretty good. Winter Wheat areas in the Former Soviet Union are dealing with drought.
Major Sources of Information
In the box are shown the major resources we use. We will not be using them all each week but the reader is welcome to refer to these resources.
Major Sources of Information Used in this Weekly Report - The U.S. Drought Monitor (the full report can be accessed here)
- Selected graphics from our other Weather and Climate Reports are repeated in this report. These reports can be accessed by referencing the Directory here
- Selections from the Tuesday USD Weather and Crop Bulletin (the full report can be accessed here). Selections from the USDA Office of the Chief Economist can be found here. NASS Executive Briefings can be found here. A wide range of NASS Reports can be found here. USDA Foreign Agriculture Service Briefs can be found here. Other useful sources of information that I regularly utilize are the National Integrated Drought Information System (NIDIS) which can be accessed here and the USDA NRCS Weekly and Weather Climate Update which can be accessed here. A glossary of terms can be found here.
|


