Written by Sig Silber
Updated at 10:30 pm EDT October 23, 2020 to reflect the update of the Week 3-4 Forecast. It does not change our analysis.
Drought is inevitable because the indices used to define drought in most cases are defined in terms of deviation from normal. But when you change so dramatically from an almost absence of drought to the intense drought in the Southwest, one is reminded that weather is more than about what clothes to wear today. I am optimistic that this Southwest Drought will ease up within six months (as La Nina ends) but for now and into next summer it is a true crisis and needs to be approached that way. I have not been writing a full drought report for a while as I was bored by nothing much happening but it has crept up on us and no longer can be ignored. In arid and semiarid areas, it can take a few seasons for a significant drought to develop.

Please share this article – Go to the very top of the page, right-hand side, for social media buttons. Please feel free to send this article to anyone who you think might benefit from reading it.
| Table of Contents |
|
Special Topic for this Week – Description of the Western Drought.
Drought Severity Classification

Some background information on drought.
I want to use the Alaska Panhandle which gets a lot of rain as an example to make a number of points.


Looking at the Southwest.

I have more information on New Mexico than any other state and I am showing it as an example of the kind of things that are looked at.


But we expect some relief soon.

Looking at all of CONUS

Back to New Mexico

EDDI is another way of looking at things. It is similar but different than looking at precipitation and conditions on the ground. Here a calculation is made of the difference between what the atmosphere wants in the way of evaporation and the ground’s ability to provide that level of evaporation. The map above which shows a slightly different area (it covers a bit more than just New Mexico) reflects the work of drought monitor groups around the nation as they look at a wide range of information. The above is one tool but they look at many things. I participated in the meeting for New Mexico on Tuesday.

Current Drought Conditions for the U.S.
Now we take a look at Thursday’s U.S. Drought Monitor Report.
The U.S. Drought Monitor is a comprehensive way of understanding the drought situation for the U.S. It is issued every Thursday and reflects the conditions as of the prior Tuesday. Drought is defined as a moisture deficit bad enough to have social, environmental, or economic effects. Thus, more factors than recent precipitation are considered and more information on how it is done is found at the end of this report.
U.S. Affiliated Pacific Islands and the U.S. Virgin Islands.

And this shows the U.S. including Alaska, Puerto Rico, and Hawaii.
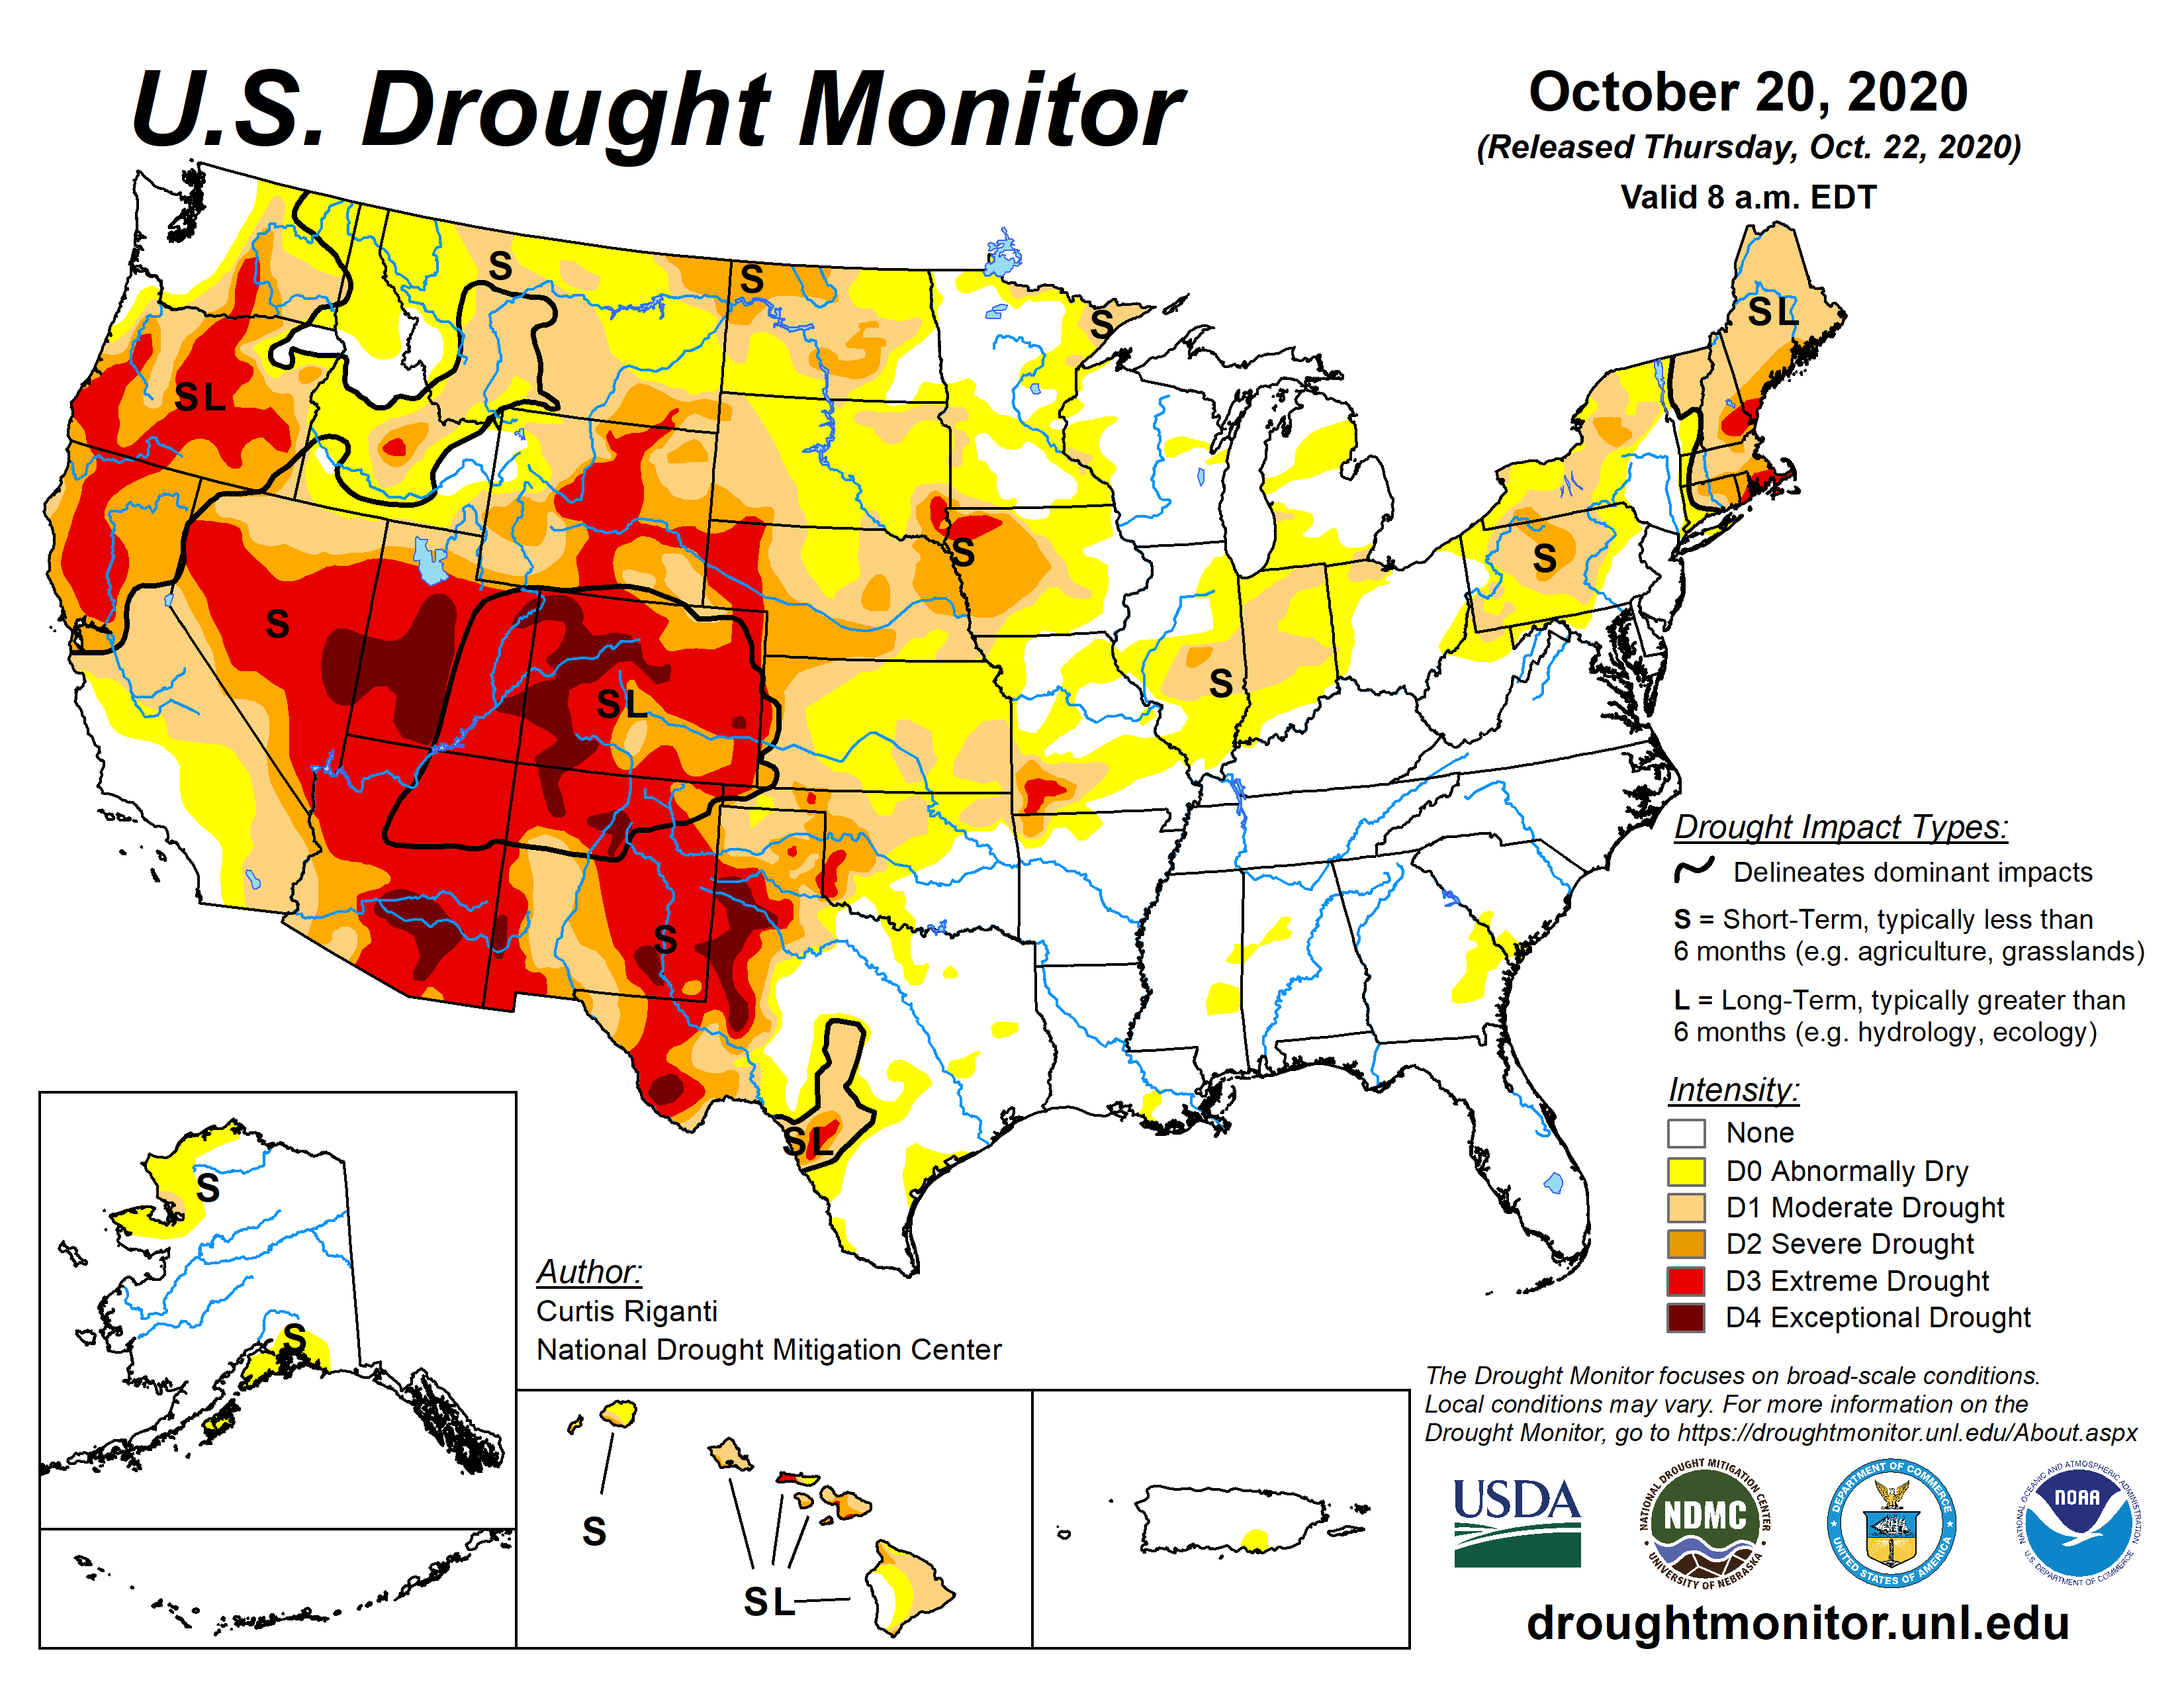
Below is the map for just CONUS.
 |
 |
 |
Some might find this animation of twelve weeks of change useful;

The graphic below shows the 24-week change in drought intensity. Yellow is bad. Green is good. I usually show the one-week change but I am trying to put the issue in perspective.
|

Now we show the 24-week change information by region. The yellow is where the level of drought has been raised. The green is where the level of drought has been lowered.
 |
Colorado shows up on this map and again on the map of the West. But Wyoming is shone here and it has gotten a lot drier. |
 |
| There are a few small areas that have had a four-category degradation but overall it is not that severe for most of the region. |
 |
Parts of the Northeast especially in New England have experienced degradation. |
 |
| You can see where the coast has improved but Western Texas and Oklahoma have dried out. |
 |
It is mostly improvement in this region. |
 |
| Here is where the problem is most serious. |
Here is the Discussion that was issued with the Drought Report. The Regional Headings should be able to be clicked on to obtain maps and statistics. But that may not be working. The maps above show the change for the past 24 weeks. This discussion just covers this week.
This Week’s Drought Summary
Over the past week, beneficial precipitation fell over the higher elevations of Washington and Oregon, in much of Montana (particularly the mountainous western half), in the Lower Missouri River and Ohio River valleys, and in New England, leading to improving conditions in parts of these regions. Meanwhile, the southeast United States (with the exception of the Florida Peninsula) was mostly dry. Dry weather also continued across much of the central and southern Great Plains this week, as well as most of the southwestern United States. With background dry conditions in many areas that did not receive rain, combined with high evaporative demand over much of the High Plains and western United States, widespread worsening of drought conditions occurred from the Great Plains to the Southwest.
Northeast
Precipitation exceeding 2 inches fell over most of New England this week, following a wet end to the previous week, thus improving short- and long-term precipitation deficits there. As a result, drought intensity and coverage lessened over much of New England. Starkly drier weather occurred in eastern Pennsylvania and West Virginia. Temperatures in the Mid-Atlantic were generally within 3 degrees of normal, while temperatures ranging from 3 to 6 degrees warmer than normal occurred in northern New England.
Southeast
Drought-free conditions continued for another week in the Southeast, although the weather was much drier this week outside of South Florida. A narrow swath of a half inch or more of rain fell from central North Carolina to the Mid-Atlantic, and rainfall amounts exceeding 2 inches fell in South Florida. Temperatures were generally near normal in the Appalachians and in Alabama, while temperatures in coastal sections of South Carolina, Georgia, and Florida ranged from 3 to 6 degrees warmer than normal for the week.
Midwest
Widespread precipitation also fell from southern Missouri through the Ohio River Valley this week amid cooler than normal temperatures. Temperatures ranged from 3 to 6 degrees cooler than normal in the Ohio River Valley and in Missouri. In the Upper Midwest, even cooler conditions prevailed, as anomalies from 6 to 12 degrees below normal were widespread in Wisconsin, Iowa, Minnesota, and the Michigan Upper Peninsula. The precipitation amounts in the southern part of the Midwest region ranged from half an inch to locally over 2 inches. Given the improvements to short-term precipitation deficits, some of the moderate drought that had been present from St. Louis eastward ceased. However, in parts of Illinois and Indiana that received less rainfall, conditions worsened, leading to the expansion of moderate drought in some areas, and the introduction of severe drought in central Illinois. Parts of southwest Missouri, where agricultural impacts have been widespread, also saw worsening drought conditions in locations that saw less rain this week.
South
Except for northwest Tennessee and adjacent northeast Arkansas, dry weather occurred in the South this week. Near-normal temperatures occurred in most of Oklahoma, northern Texas, Arkansas, Louisiana, Mississippi, and Tennessee, while temperatures ranging from 3 to 9 degrees warmer than normal took place in southern Texas. Drought conditions generally worsened in the region, in particular in northwest Arkansas, Oklahoma, and central and western Texas. In the southern high plains, the lack of precipitation this week occurred in a region that has had very high evaporative demand over the last few months, leading to further loss of soil moisture in areas where winter wheat is planted.
High Plains
Weather in the High Plains region was generally cooler than normal this week. Temperature anomalies ranged from normal to 6 degrees below normal in Kansas to 6 to 15 degrees cooler than normal in North Dakota. Areas of light to moderate precipitation were scattered about Nebraska, South Dakota, North Dakota, and northeast Wyoming, though amounts exceeding an inch were uncommon outside of the Black Hills. Degradation of drought conditions in the region was widespread this week south of Interstate 80, where dry weather combined with recent warm, dry, and windy conditions, leading to continued loss of near surface moisture.
West
In the West this week, widespread precipitation fell in some of the mountainous areas of western Washington and Oregon, Idaho, and Montana. In some locations in western Washington, western Oregon, and northwest Montana, the recent precipitation was enough to improve drought conditions, due to lessened precipitation deficits. To the south, however, widespread expansion of extreme and exceptional drought occurred in Utah, Arizona, Colorado, and New Mexico. To the west of the Rocky Mountains, temperatures were warmer than normal this week; readings of 9 degrees or more above normal were found in parts of California and Arizona. Meanwhile, central and eastern Montana were much colder than normal, as much of the eastern part of the state experienced temperatures 9 degrees (or more) colder than normal. Similar to much of the Great Plains, very high evaporative demand has gripped these states over the last several months and combined with the short- and long-term precipitation deficits to continue to worsen conditions. The wildfire danger has also continued across parts of the region as a result of these conditions, and portions of Arapahoe and Roosevelt National Forests in Colorado have been closed in response.
Alaska, Hawaii, and Puerto Rico
No changes were made to the drought depiction in Alaska this week. In Puerto Rico, abnormal dryness continued along the south-central coast, but drought-free conditions remained. In Hawaii, extreme and severe drought grew in coverage in southeast portions of Maui, where short-term precipitation deficits continued to mount. Moderate drought grew in coverage on the Big Island of Hawaii, where recent rainfall was low and streamflow returned to lower values.
Pacific Islands
The weather across the U.S.-Affiliated Pacific Islands (USAPI) during this USDM week (10/14/20-10/20/20) was influenced by multiple factors. The ongoing La Nina kept conditions dry across southern portions of the Federated States of Micronesia (FSM); a meteorological Inter-Tropical Convergence Zone (ITCZ) spread rain across Micronesia from the east; a monsoon trough poked into the western end of the region; and upper-level lows or troughs created divergence aloft over northern portions which enhanced showers generated by surface features. These features included surface troughs, circulations, and trade-wind surges/convergence. South of the equator, a surface trough or frontal boundary created instability as it moved across American Samoa.
Satellite-based estimates of 7-day precipitation (QPE) showed two bands of precipitation stretching eastward from Southeast Asia — one extended across Micronesia then past the Date Line between 5 and 10 degrees North latitude, reflecting the monsoon trough and ITCZ, and the other extended southeast across Indonesia towards the Samoan Islands and reflected the South Pacific Convergence Zone (SPCZ). The band across Micronesia consisted of areas of 2 to 4+ inches of rain enveloped by areas of 1 to 2 inches with drier patches within the band. The QPE depicted areas of 2+ inches of rain across the Samoan Islands and extending to the west and south.
The week was wet in the Republic of Palau. The Palau IAP recorded 6.15 inches of rain for the week and 17.00 inches for October through the 20th. The Koror COOP station reported 4.76 inches for the week and 12.20 inches for the month through October 19th. These values are above the weekly (2 inches) and monthly (8 inches) minimums needed to meet most water needs. D-Nothing continued at Palau.
It was also wet (above the 1-inch weekly minimum needed to meet most water needs) in the Marianas. Guam received 2.10 inches, Rota 1.42 inches, Saipan IAP 1.45 inches, and Saipan NPS station 1.26 inches. Only 0.77 inch was recorded at the Saipan ASOS station. Over 12 inches has been received so far in October at Guam (12.40) and Rota (12.26). Amounts on Saipan ranged from 3.34 inches at Saipan NPS and 4.40 inches at Saipan ASOS to 7.21 inches at Saipan IAP. With wet conditions for the last several weeks and last three months, D-Nothing continued at Guam, Rota, and Saipan.
In the FSM, D4-S (Exceptional Drought) continued at Kapingamarangi where only 0.17 inch of rain fell this week. The October 1-20 total of 0.63 inch compares to full Octobers as the fourth driest in the 31-year record. Based on data through the month so far, Kapingamarangi had the second driest September-October (1.49 inches), August-October (4.43 inches), and July-October (10.02 inches). The National Weather Service office in Pohnpei reports that two of the six community water tanks on Kapingamarangi still have water and severe agricultural impacts have occurred – there is no water in the coconuts and breadfruit continues to drop fruit prematurely, but a few banana trees are still producing meager fruit. In early October (on the 5th or 6th), the Federated States Ship Independence delivered 730 gallons of water to Kapingamarangi, which is about 3 gallons per person. Efforts to use the relief ship’s desalination unit to fill the empty catchments failed due to mechanical and salinity issues.
D-Nothing continued at the rest of the FSM stations. The week was dry (less than the 2-inch weekly minimum) at Lukonor (1.02 inches, with one day missing), Woleai (1.41 inches with 3 days missing), and Yap (1.08 inches with 2 days missing) and wet at the remaining stations, where weekly totals ranged from 2.06 inches at North Fanif (2 days missing) to 8.44 inches at Pohnpei. Most of the FSM stations were on track for a wet October. The exception (besides Kapingamarangi) was Yap which recorded 3.77 inches of rain so far this month.
In the Marshall Islands (RMI), no data is available for Utirik, so an analysis could not be made there. Jaluit was dry (below the 2-inch minimum) for the week (but just barely with 1.92 inches of rain) and the other stations were wet with weekly rainfall totals ranging from 3.63 inches at Wotje to 10.81 inches at Ailinglaplap. October monthly totals were above or near the monthly minimum (8 inches), so D-Nothing continued at most RMI stations. The exception was Wotje. With the last three weeks wet and the monthly total so far 10.67 inches, the status at Wotje was improved from D1-SL to D0-L. The D0-L reflected lingering long-term impacts to agriculture.
American Samoa was wet this week, with over 3 inches of rain recorded at Pago Pago (3.33 inches) and the automated station at Toa Ridge (3.35). With the last several weeks and months wet, D-Nothing continued at Tutuila.
Virgin Islands
The weather conditions across the U.S. Virgin Islands (USVI) during this USDM week (10/14/20-10/20/20) were influenced by a moist tropical wave with instability enhanced by a Tropical Upper Tropospheric Trough (TUTT). This combination generated rain across the islands, with locally heavy rain in places. A drier air mass with an upper-level ridge moved into the area as the week ended.
Radar-based estimates of rainfall for the 7 days ending at 12z on Tuesday showed rain across the U.S. Virgin Islands. Precipitation estimates ranged from half an inch across eastern St. Croix to over 2 inches on the western end of the island, and locally 3 or more inches on St. Thomas and St. John.
With wet conditions this week and for the month, D-Nothing continued on St. Croix, St. Thomas, and St. John.
Weekly precipitation totals on St. Croix ranged, on the low end, from 1.68 inches at CoCoRaHS station Christiansted 2.3 SSE, 2.20 inches at Rohlsen AP, 2.48 inches at Christiansted 1.6 E, and 2.57 at Christiansted 1.8 ESE, to 3.39 inches at Frederiksted 2.3 N, 3.59 inches at East Hill, and 4.92 inches at Frederiksted 0.5 N. Standardized Precipitation Index (SPI) values were neutral to wet at all time scales for Rohlsen AP and East Hill except at the D1 level at Rohlsen AP at the 12-month time scale.
On St. Thomas, weekly rainfall totals ranged from 0.83 inch at King AP and 1.62 inches at Charlotte Amalie 5.1 E, to over two inches at Charlotte Amalie 1.4 NE (2.05 inches) and Anna’s Retreat 2.5 ESE (2.64 inches). The SPI values at King AP were at D0 levels for the 6- and 12-month time scales, but neutral for the 1-, 3-, and 9-month time scales.
The week was consistently wet on St. John, with over 3 inches of rain recorded at the CoCoRaHS stations at Cruz Bay 0.8 NE (3.55 inches), Cruz Bay 1.6 E (4.15 inches), and Windswept Beach (4.24 inches). The SPI at Windswept Beach was neutral to wet at all time scales except D0 for the last 9 months.
Looking Ahead
A series of storm systems and cold fronts is forecast to affect the western two-thirds of the continental United States through Monday, October 26, bringing chances of welcome mountain snow to Colorado, precipitation locally exceeding a half inch to the northern tier of the continental United States, and heavier precipitation from central Oklahoma to the Great Lakes. By early next week, colder than normal temperatures are forecast to be entrenched across the western two-thirds of the continental United States, while above-normal temperatures occur in the east. From Tuesday, October 27 through the end of the month, colder than normal weather is favored from west of the Appalachian Mountains through most of the West, while warmer than normal weather is favored in the Southeast. The forecast also favors above-normal precipitation from southwest Colorado to the Great Lakes and East Coast, while below-normal precipitation is favored in the northern Great Plains, California, and the Pacific Northwest.
And shifting to the Alaska and CONUS Intermediate-Term Weather Forecast
 |
|
|
|


And then Precipitation
|
|
|


Week 3-4 Forecast Discussion Valid Sat Nov 07 2020-Fri Nov 20 2020
La Nina conditions are present, as below-normal SSTs persist over the equatorial east-central Pacific alongside a coherent atmospheric response with enhanced trade winds and westerly wind anomalies aloft. The MJO has also become more active, with the enhanced convective phase propagating eastward across the Maritime Continent during the past week. Dynamical models generally favor continued eastward propagation of the intraseasonal signal, where it would begin destructively interfering with the La Nina response. As the boreal autumn season progresses, these tropical signals have the potential to teleconnect well with the extratropical pattern. Therefore, the Week 3-4 outlook favors statistical guidance based on tropical-extratropical interactions, particularly the multiple linear regression tool based on the RMM indices, ONI, and long term trend.
Dynamical model guidance features a wide variation of 500-hPa height anomaly patterns during the Week 3-4 period. The CFS, ECMWF, and JMA all depict a trough in the vicinity of the Aleutians, but while the ECMWF has ridging downstream over much of the northern CONUS, the CFS and JMA both extend the trough to the vicinity of the Pacific Northwest and have a much more amplified ridge near the eastern US. These variations result in considerable differences in the model temperature and precipitation outlooks, with the CFS and JMA showing enhanced precipitation over the Pacific Northwest and widespread above-normal temperatures across the East, while the ECMWF is warmer across the West and generally drier. The MLR shows a blended MJO/ENSO influence, with troughing over the Great Lakes and ridging over the West favoring a colder and wetter solution for the Great Lakes and upper-Midwest. The outlook is based strongly on a weighted blend of the MLR, CFS, ECMWF and JMA, with 70 percent contributions from the MLR and ECMWF. However, the outlook favors the MLR solution across the northeastern quadrant of the CONUS due to the robust tropical signals.
The Week 3-4 temperature outlook features enhanced chances of above-median temperatures across Alaska, much of the western US, and the Appalacians and Eastern Seaboard south of Maine. The highest probabilities of above-median temperatures exist over northern Alaska and the western CONUS extending from southern Washington to western Texas. Despite the blended guidance favoring warmth across much of the CONUS, an area of equal chances for below- and above-median temperatures is indicated for the north-central CONUS through northern New England, with below-median temperatures favored for the upper-Midwest and northern Great Lakes region. This solution most closely resembles the MLR, although with less cold in deference to the warmer dynamical model forecasts.
Enhanced chances for above-median precipitation extend across parts of the Northern Tier, with the highest probabilities across central Montana and northern New England. Consistent with canonical La Nina conditions, below-median precipitation is favored for the southern tier of the CONUS. Equal-chances are maintained across the Great Lakes, southern New England, and the mid-Atlantic states, as well as the Pacific Northwest. While some guidance depicts considerable wetness over the Pacific Northwest, given the increasingly wet climatology, there is insufficient guidance to warrant higher probabilities at this time. Below-median precipitation is favored for most of Alaska, while onshore flow favors enhanced precipitation for the southern Alaska panhandle.
The outlook favors above-median temperatures for the Hawaiian Islands due to positive SST anomalies in the vicinity, and the SubX MME forecasts show increased probabilities for below-median precipitation.
Some may find the below way of looking at things useful and I hope these graphics are not too small to read. I did not make them so you could click on them individually but you can click on the whole graphic and it may enlarge. But I think you get the picture. It has been a rapid onset and demise. When you read these graphics, remember that the older graphics are not the drought conditions that existed then but the change from then until now.

Drought Forecasts
These two forecasts (Monthly and Season) are issued by the same agency but to obtain them you need to access two different links here and here.
Here is the Three-Month Forecast which was issued on October 15, 2020

Here is the Monthly Drought Outlook which was updated on September 30, 2020.

Floods


Wildfires are a problem


Current Wildfire Risk. This is a new model that updates daily by NOAA (but not automatically in this article) to show the short-term risk.

Click here to update. Red is high risk, blue is low risk. This graphic updates daily but you have to click on the link provided to get the updates More information can be found here.
This explains the model a bit.

The below graphics are monthly risk estimates for Wildland Fire Potential. They update monthly.

Looking out another month.


Major Sources of Information
In the box are shown the major resources we use. We will not be using them all each week but the reader is welcome to refer to these resources.
Major Sources of Information Used in this Weekly Report
|
Background Information
Drought Severity Classification


The sequence of drought occurrence and impacts for commonly accepted drought types. All droughts originate from a deficiency of precipitation or meteorological drought but other types of drought and impacts cascade from this deficiency. (Source: NDMC)
Source: National Drought Mitigation Center, University of Nebraska-Lincoln


