Written by Sig Silber
Tonight we present the NASS Executive Briefing on the major crops (and others as well but in less detail) and the weekly U.S. Crop Progress and Condition Report. We also present the September 2020 ranking of states with respect to precipitation and temperature relative to their 126-year history. It continues to look like the U.S. will have a successful crop year.

Please share this article – Go to the very top of the page, right-hand side, for social media buttons. Please feel free to send this article to anyone who you think might benefit from reading it.

Notice the two inserts on the left side: one shows winds the other shows precipitation. On the right, it shows where cotton and sugarcane are grown. We may see the impact in this week’s Crop Production Report or it may not show until next week. I do not know that much about sugarcane other than it rains a lot in Florida where it grows so I do not suppose that rain is a problem for sugarcane but wind might be. Heavy rain is not good for the cotton harvest.

Perhaps I should have shown this first. They keep coming. The origin is the warm waters of the Western Caribbean. It is not that large a storm but it was powerful. You can see the eye.
Let’s take a look at the state rankings
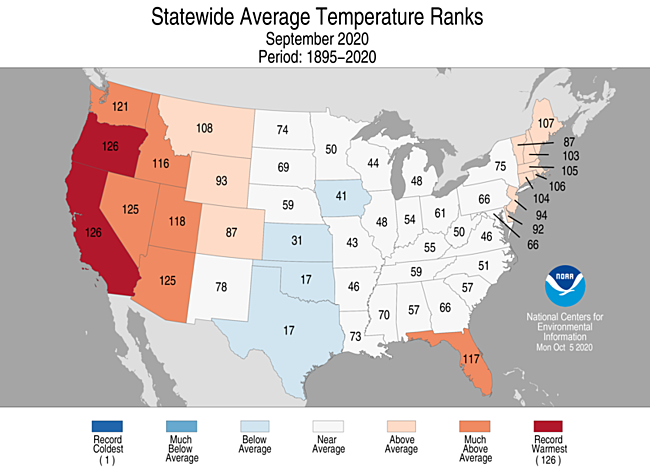
Two states set a record and six states were much above average.
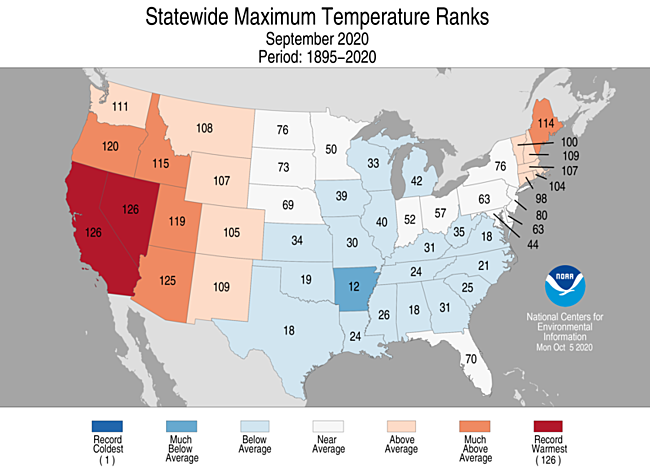
It is interesting that when considering maximum rather than average temperatures, Florida no longer set a record but was more or less average.
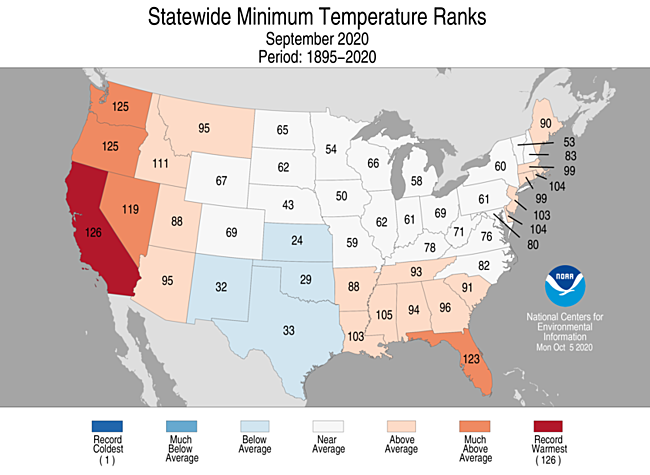
When looking at minimum temperatures, Florida was in the much above average category so it seems they may not have cooled off at night but did not get exceptionally hot during the day which can be attributed to high humidity.
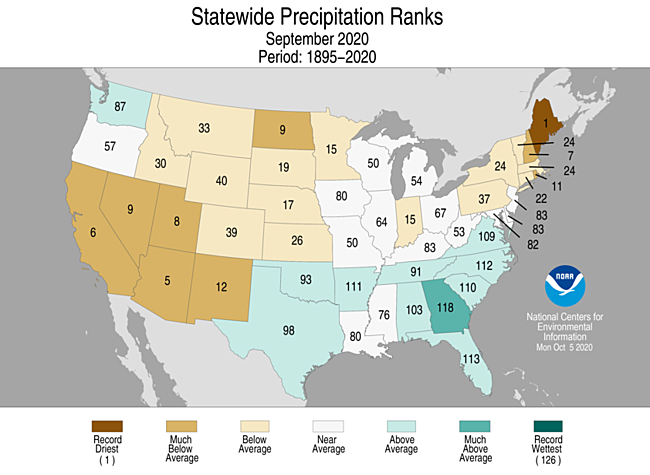
We see five much below average states in the Southwest but also North Dakota and New Hampshire and Maine set a record for dryness. We also see a number of above-average and one much above average state. So there was a regional pattern with respect to precipitation.
Sometimes it is useful to look at climate divisions
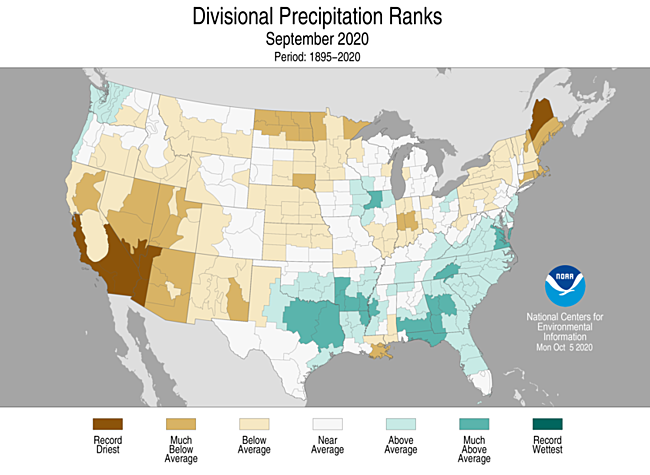
You can see that there was some variation within Maine and it was Southern California and Western Arizona which set records for dryness.
I thought this would be a good place to report on California reservoirs.

There are quite a few below average. They are sort of in the same part of the state.
Let’s look at some other states

Five states below average. Not sure the level considered average for New Mexico is realistic. But New Mexico is in trouble.
Here is the NASS Executive Briefing.


It is hard to read but it shows the sample sizes. I am not real impressed with the number of samples.

Corn harvesting is in the middle of the pack re recent years. But the weekly Crop Progress Report shows that there was a big increase in the percent harvested this past week. Notice the Executive Briefing shows data through October 4 but the weekly crop report adds one more week to the data. But it does not show the history as the Executive Briefing does. That is why I publish the Executive Briefing followed by the Weekly Crop Progress Report.

A slight decline from the prior estimate but still a large increase over last year. Most of this is due to improved yield compared to last year.

The difference between planted and harvested includes crops abandoned but it is mostly crops that are not harvested but are grazed by animals. I am surprised that the difference was not larger in 2019.

It looks like a rising trend of yield.

This shows the change in yield estimate from the prior month. I do not see a pattern here.

Satellite assisted yield analysis.

Shows the percent mature in the October survey and later in the November survey.

Important to notice the vertical bars show one thing and the red dots something else. The bars are higher than 2019 and so are the red dots.

Total production has been more or less stable. 2019 was a bit down.

The NASS forecast seems to be towards the low end so there may be some room for improvement but notice the trend in the forecasts August, September, October has been downward.

The soybean harvest (red line) is closer to the better years than the other years. What you see is related to what is called the 5-Year Average in the Crop Progress Report which I will present later in this article.

A slight negative adjustment from the prior estimate but a 20% improvement year over year is impressive. It is half more acres planted and half yield improvement

Only 2018 saw a large difference between Planted and Harvested.

looks like an uptrend. But one can see periods of similar yields and a period of dramatic increase in yields.

Change in yield from the prior month.

yield modeled using satellite imagery.

Not sure why they present this graphic.

The NASS forecast is in the middle. It is interesting how subsequent forecasts seem to decline.

Percent harvested is dropping off. We will check that out in the Weekly Crop Progress Report. We have been concerned about the impact of tropical events on the cotton crop.

The yield is good but the acres planted is way down and the acres harvested is slow. This may be an evolving story.

Curve fitting is always interesting. It looks like an increasing trend but there has not been much change since 2004.

This shows the month to month change in yield by state.

Fairly stable except for two bad years.

Rice is better than last year. We will revisit that in the Weekly Crop Progress Report. It can get tricky. It seems that the amount of rice is way up but the percent harvested is a little less than the same time last year.

These all look good except tobacco. Sunflowers are really showing an increase.

Pecans will not be in short supply.

There is a long-term decline in Citrus.

We will cover some of these and certainly the November 10 Crop Production Executive Briefing. We will probably also cover the October 30 Agricultural Prices.

To get additional information.
Here is the weekly U.S. Crop Progress Report.
Generally speaking, the weather cooperated with respect to fieldwork.

Only one state had weather that negatively impacted fieldwork.
International

And the map.

Argentina, Brazil and Mexico could use more rain.
Major Sources of Information
In the box are shown the major resources we use. We will not be using them all each week but the reader is welcome to refer to these resources.
Major Sources of Information Used in this Weekly Report - The U.S. Drought Monitor (the full report can be accessed here)
- Selected graphics from our other Weather and Climate Reports are repeated in this report. These reports can be accessed by referencing the Directory here
- Selections from the Tuesday USD Weather and Crop Bulletin (the full report can be accessed here). Selections from the USDA Office of the Chief Economist can be found here. NASS Executive Briefings can be found here. A wide range of NASS Reports can be found here. USDA Foreign Agriculture Service Briefs can be found here. Other useful sources of information that I regularly utilize are the National Integrated Drought Information System (NIDIS) which can be accessed here and the USDA NRCS Weekly and Weather Climate Update which can be accessed here. A glossary of terms can be found here.
|


