Written by Sig Silber
HEADLINES (Updated 4:15 pm EDT) –
– Tropical Storm Beta will continue to cause flooding and life-threatening storm surge for portions of Texas and Louisiana
– Large swells caused by Teddy could cause life-threatening surf and rip current conditions along the East Coast
– Another frosty morning is possible in the Central Appalachians as below normal temperatures continue in the East and westward into the Southern Plains

This article provides continuous updates for a variety of Weather and Weather-Related Threats as well as a general weather forecast. These are “Live” maps that continually update. Please pay attention to the Mesoscale Events maps — Mesoscale Events are potentially life-threatening situations.
Please share this article – Go to the very top of the page, right-hand side for social media buttons. Also, feel free to send this email to anyone you feel will benefit from it.
For those interested in longer-term forecasts, we just published the new NOAA Seasonal Outlook and it can be accessed here.
Readers can scan through this article or jump to where they want to go via the links to the right. To get back to the Directory, hit the back arrow at the top of the URL bar on your screen. But in many cases, one of my Editors has graciously inserted a Return to Directory link to click so that is even easier. This is so high tech that I hardly believe it. |
|
CONUS Focal Points
Short Range Focal Points
Short Range Forecast Discussion NWS Weather Prediction Center College Park MD – 353 PM EDT Mon Sep 21 2020
Valid 00Z Tue Sep 22 2020 – 00Z Thu Sep 24 2020
…Tropical Storm Beta will continue to cause flooding and life-threatening storm surge for portions of Texas and Louisiana.…
…Large swells caused by Teddy could cause life-threatening surf and rip current conditions along the East Coast…
…Another frosty morning is possible in the Central Appalachians as below normal temperatures continue in the East and westward into the Southern Plains.…
Tropical Storm Beta is continuing its slow trek initially northwestward, and is expected to make landfall along the middle Texas coast tonight. Tropical Storm Warnings are in effect for portions of the Texas and Louisiana coasts where winds could be tropical storm force. Additionally, life-threatening storm surge near times of high tide is a danger through Tuesday. Long duration flooding rains will be a threat particularly due to Beta’s slow movement. Flash, urban, and minor river flooding is likely from the middle Texas coast into southeastern Louisiana, and Moderate Risks of flash flooding are in place through Tuesday. Some locally heavy rain is possible northward into eastern Oklahoma and northeastern Texas. Beta should move slowly eastward through Wednesday, and heavy rainfall is expected to spread across much of the Lower Mississippi Valley.
Hurricane Teddy moving northward through the Atlantic Ocean is forecast to transition to a potent post-tropical cyclone and move across the Canadian maritimes around midweek. In the U.S., the main impacts of Teddy will be the potential for large swells along the East Coast, which will likely cause life-threatening surf and rip current conditions. Eastern Maine could get some rain from Teddy’s western edge, and gusty winds can be expected.
Elsewhere, a frontal system approaching the Pacific Northwest should bring rain to the Northwest Tuesday night into Wednesday. A round of light rain and thunderstorms is possible in the Upper Midwest Wednesday as a front passes through, and isolated showers and thunderstorms are possible in the Four Corners region mainly Tuesday afternoon, some of which could be dry thunderstorms, creating a fire danger threat. The rest of the country should be generally dry.
High pressure dominating the eastern U.S. will lead to continued cool temperatures Tuesday morning–frost is possible once again for portions of the Central Appalachians, and a few record lows are in jeopardy in the East. Cool weather is also forecast westward into the Southern Plains under the influence of rain and cloudiness from Beta. Meanwhile, the north-central U.S. in particular can expect above normal temperatures, with some locations approaching 90 degrees on Tuesday.
We try to keep this up to date but if is not you can find the updated version here.
When you click on this image it takes you to the SPC Fire Warning Page and you get a set of maps for Days 1, 2, 3 – 8, etc. You can then click on those for more detailed information. The map is a bit blurry as I tried to make it a bit larger than the map provided by NOAA but should be able to see where the current wildfire risks are. But if you click on this map, you will get to see three maps that show the risk for different time periods.

Thunderstorm Risk

This should play out something like shown in this 60 Hour Forecast Animation
Here is a national animation of weather fronts and precipitation forecasts with four 6-hour projections of the conditions that will apply covering the next 24 hours and a second day of two 12-hour projections the second of which is the forecast for 48 hours out and to the extent it applies for 12 hours, this animation is intended to provide coverage out to 60 hours. Beyond 60 hours, additional maps are available at links provided below. The explanation for the coding used in these maps, i.e. the full legend, can be found here although it includes some symbols that are no longer shown in the graphic because they are implemented by color-coding.

The two maps below break it down by day and may be easier to read.
Now, the Day One and Two CONUS Forecasts: These Maps Update Daily.
Day One CONUS Forecast | Day Two CONUS Forecast |
|
|
These graphics update and can be clicked on to enlarge. You can see where the weather will be | |
 | |


During the winter much of our weather originates in the Pacific. That is why we pay attention to the near-term history of storms arriving.
Temperature


A version that shows a 20 hour animation and some other views can be found here OR SIMPLY CLICK ON THE IMAGE.

– Return to Directory
Day 3 – 7 Hazards
Hazards:
– Heavy rain across portions of the Lower Mississippi Valley, the Tennessee Valley, the Northern Great Basin, the Mid-Atlantic, the Southern Appalachians, the Southeast, the Pacific Northwest, and
the Ohio Valley, Thu-Sat, Sep 24-Sep 26.– Heavy rain across portions of the Southeast, the Mid-Atlantic, and the Southern Appalachians, Mon, Sep 28.
– Heavy rain across portions of the Great Lakes, the Mid-Atlantic, the Northeast, and the Central Appalachians, Sun-Mon, Sep 27-Sep 28.
– Flooding possible across portions of the Lower Mississippi Valley and the Southern Plains.
– Flooding occurring or imminent across portions of the Southeast.
– Flooding likely across portions of the Southeast.
– Much above normal temperatures across portions of California and the Pacific Northwest, Sun-Mon, Sep 27-Sep 28.
– Much above normal temperatures across portions of the Central Plains, the Northern Plains, the Central Rockies, the Middle Mississippi Valley, the Upper Mississippi Valley, and the Southern Plains, Thu-Fri, Sep 24-Sep 25.
– Much above normal temperatures across portions of the Central Plains and the Northern Plains, Thu, Sep 24.
– Heavy precipitation across portions of the Alaska Panhandle and mainland Alaska, Fri-Sat, Sep 25-Sep 26.
Detailed Summary:
The medium range period (Thursday, Sept 24 – Monday, Sept 28) features a jet stream pattern that becomes increasingly amplified heading into the weekend and early next week. To start the period, remnants of Tropical Storm Beta look to pass over the Southeast late week causing heavy rainfall to envelope the region. Much of the region highlighted to be at risk, especially the southern Appalachians, could witness areas of flash, urban, and river flooding due to potentially excessive rainfall rates occurring across areas of overly saturated soils. Farther west, an upper level trough tracking into British Columbia will direct a swath of Pacific moisture at the Pacific Northwest. The Olympics and Cascades in particular can expect the heaviest rainfall totals due to prolonged upslope flow. While the dousing of heavy rain is sorely needed over the drought-stricken and wildfire plagued Pacific Northwest, burn scarred areas that witness heavy rainfall rates could be subject to localized flooding and debris flows. In the northern Plains and Midwest, abnormally warm conditions are expected as high temperatures looks to range between 10-20 degrees above normal. The heat is only expected to last a couple days at most before a more seasonally cool air-mass arrives this weekend and into next week.
It is the latter half of the forecast period (this weekend into next Monday) where the jet stream pattern from the north Pacific to the eastern Canadian maritime becomes increasingly amplified. Latest ensemble guidance shows an intense subtropical high near California on Saturday arching north towards the Pacific Northwest on Sunday, then reaching southwest Canada by next Monday. This results in a dip in the jet stream pattern over the eastern U.S., forcing a cooler regime to develop in the Mississippi Valley and a wetter pattern along the East Coast by days 6-7. Temperatures are not cold enough to result in a much below normal temperature area at this time, but there is a signal for heavy rain over portions of the Northeast and the central/southern Appalachians.
Meanwhile, under the expanding dome of high pressure aloft, temperatures are forecast to reach much above normal levels along the West Coast. Much above normal temps could expand more into the Pacific Northwest and Desert Southwest in future forecasts. In addition, strengthening high pressure over the Great Basin and Intermountain West may lead to increased wildfire risk due to dry conditions, low humidity levels, and the potential for high wind gusts. Southern California could contend with a Santa Ana wind event late this weekend into early next week should recent trends in model guidance persist.
There is no let up in the active weather pattern across southern Alaska to start the medium range period as another potent storm system crosses the Gulf of Alaska and heads for the Upper Panhandle Friday into Saturday. A stream of atmospheric moisture will head for the southern Gulf Coast and the Upper Panhandle, leading to the development of heavy valley/coastal rain and mountain snow. There is a chance for more heavy rainfall in the Panhandle to close out the weekend and into early next week, but latest ensemble model trends suggest the ridge over the western U.S. may crest into the Panhandle by days 6-7. Combined with increased model spread in 500mb heights over the Gulf of Alaska, confidence in precipitation forecasts in the latter half of the period is low for the time being. Temperatures do not appear to reach hazardous levels but expect a warmer regime across the eastern two-thirds of the mainland while the western third and Aleutians witness below average temperatures.
(This is updated only during the week) Note the first list is weather highlights, this list is hazards. Not sure there is that much of a difference but they come from two different parts of NOAA. The Day 3 – 7 Hazards List does not update on weekends. But it is still useful as it remains valid for the period of time it covers. Of course, all forecasts are subject to change. Later we show a map of the hazards. Perhaps we should show them together.
Click here for the latest complete Day 3 -7 Hazards forecast which updates only on weekdays. It includes the full discussion which I do not update in this article but only present the highlights.
– Return to Directory
Ski Snow Reports
New Feature – Ski Reports. (We may be a tad premature but not by much). It is difficult to find reports that auto-update on-screen (and they are very long) but these links will get you to them – If you have additional suggestions make them in the comments section after every GEI Article and we may add those links. We will try to not have too much overlap as that can add to the confusion.

We will update the above map weekly but more frequent updates can be obtained here.
Snow Forecasts.
Day 1

Day 2
Additional snow information can be found here and here.
During the summer we might add some drought information in this section.
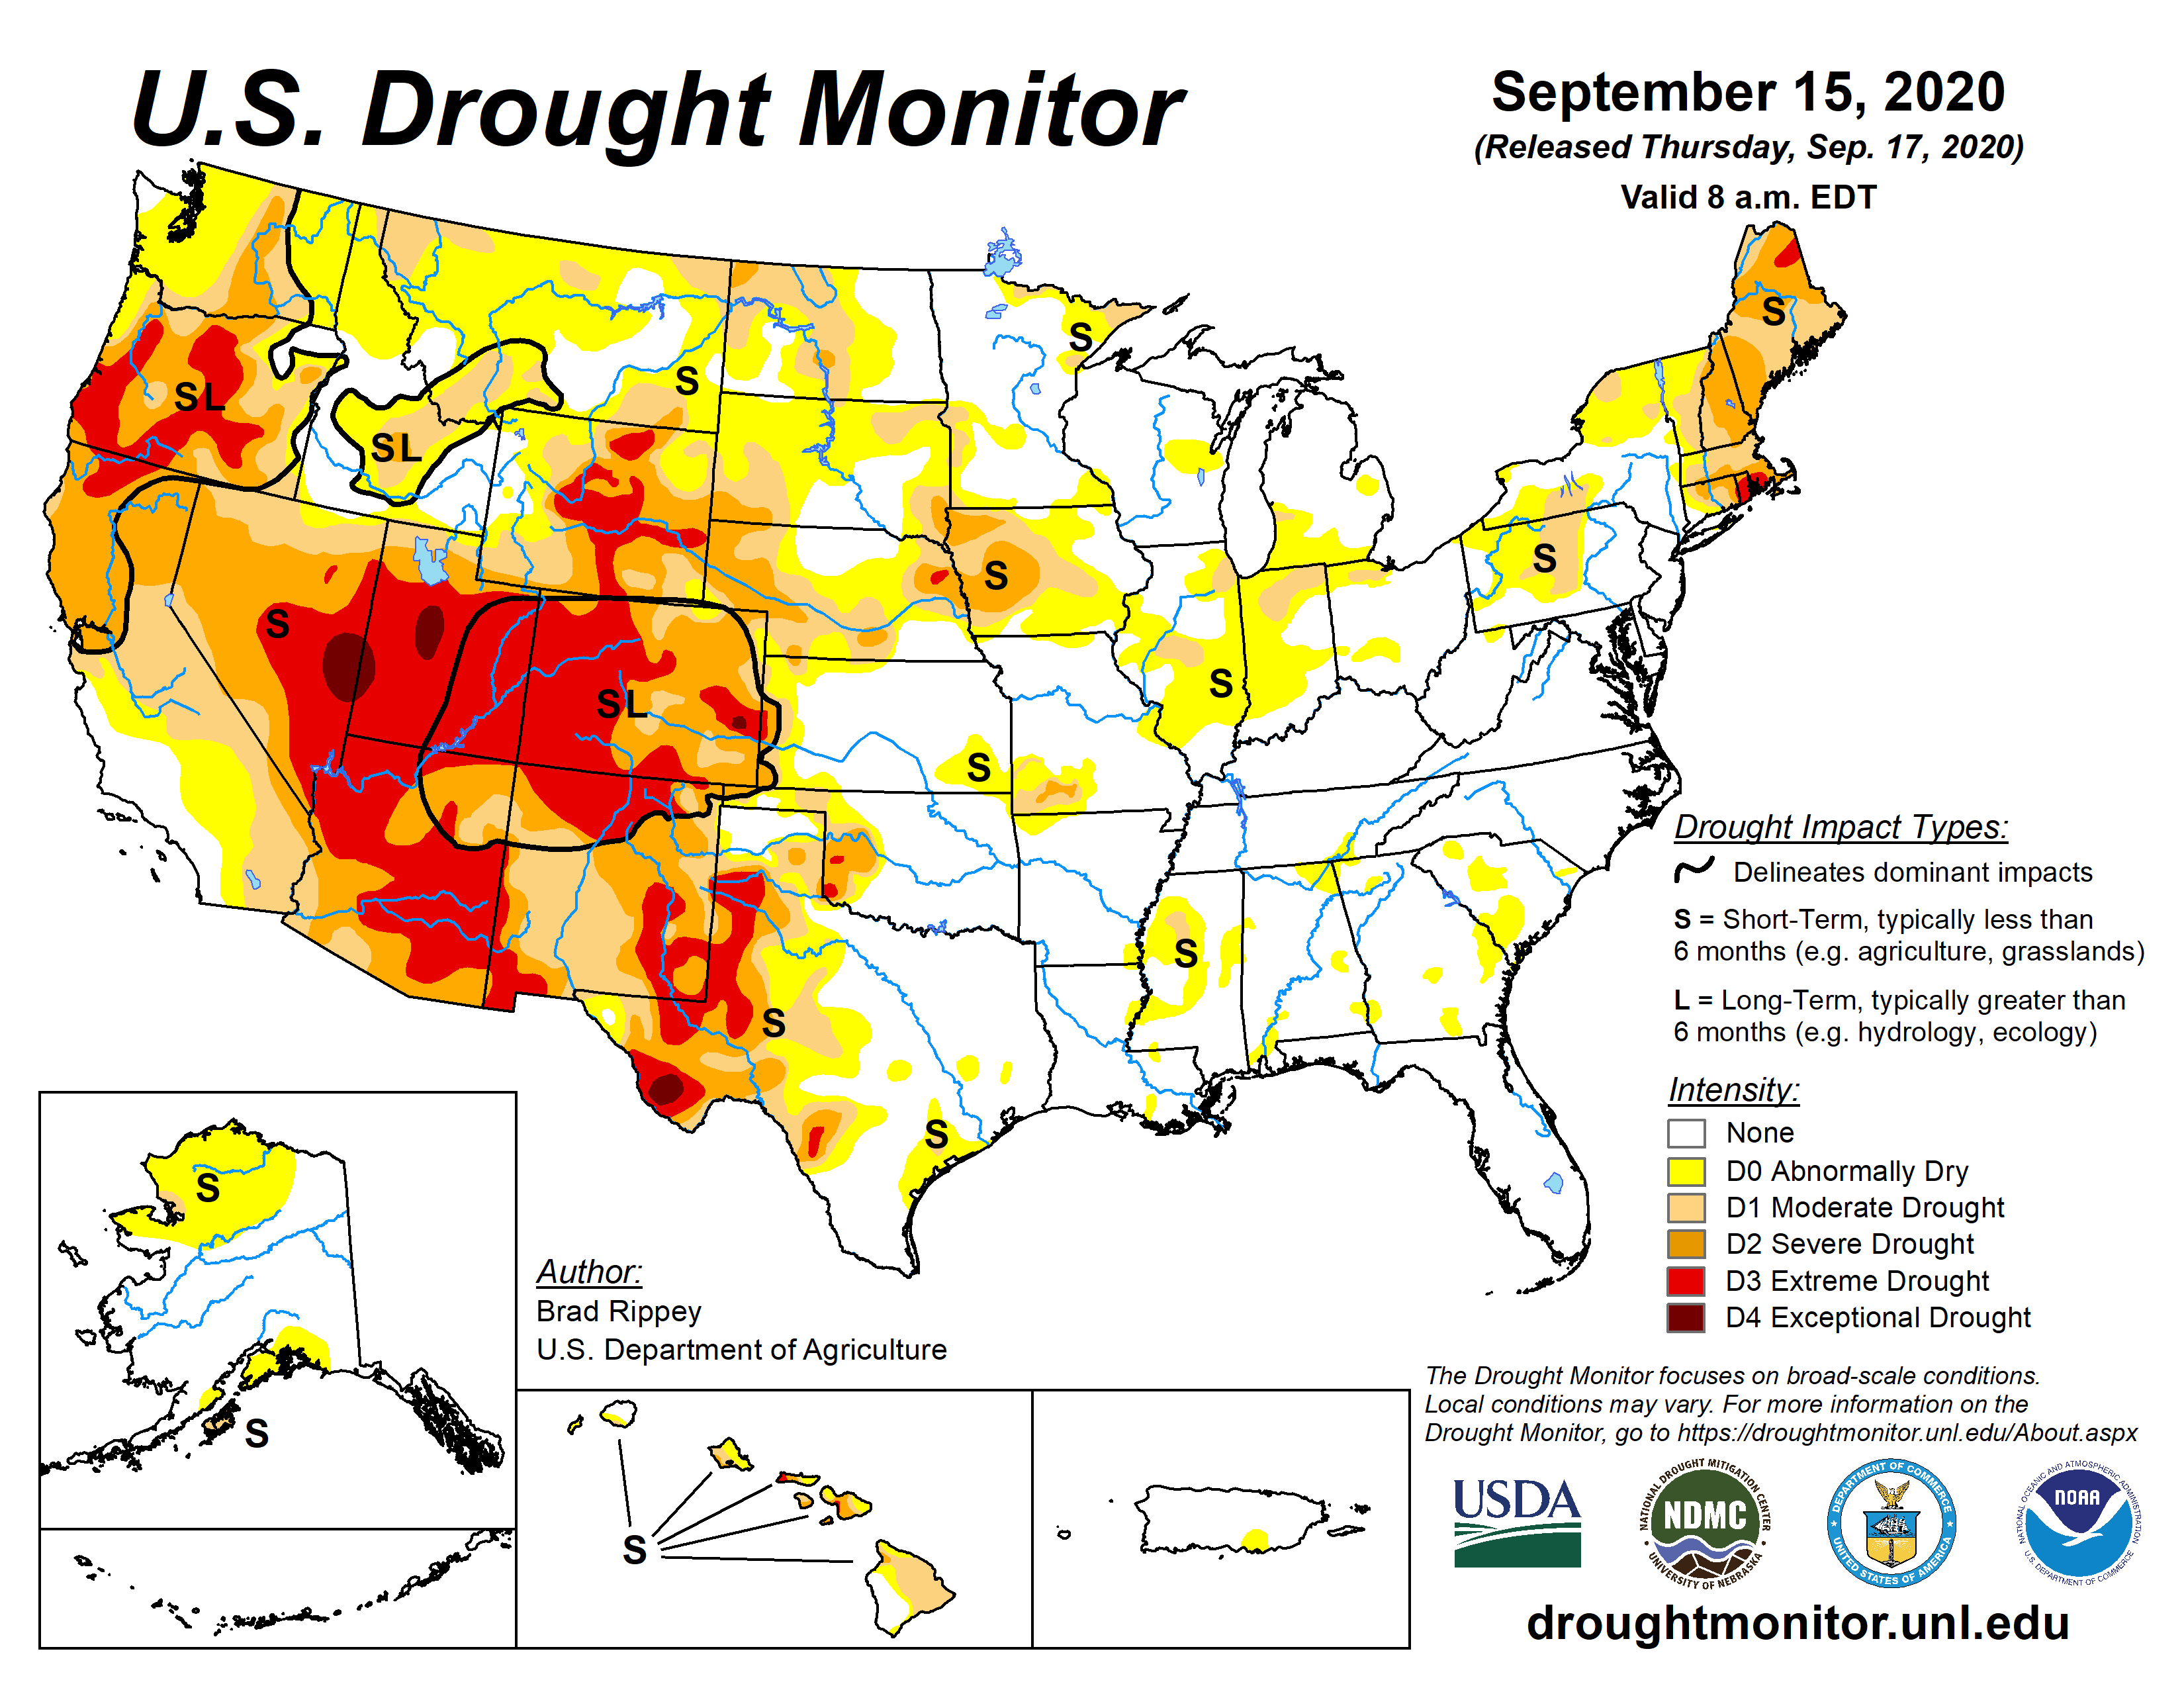

New Seasonal Outlook Issued August 20, 2020


– Return to Directory
Tropical Events
I am replacing the large with three small maps but you can click on them to get larger versions. Even though they are small maps you should be able to tell if there is activity and If I see activity I will make the map where there is activity full size and when available add other related maps.
| the Central Pacific. | the Eastern Pacific | the Atlantic and the Gulf of Mexico |
 |  |  |
Atlantic and Gulf of Mexico


![[Key Messages]](https://www.nhc.noaa.gov/storm_graphics/AT22/refresh/AL222020_key_messages+png/025745_key_messages_sm.png)

![[Key Messages]](https://www.nhc.noaa.gov/storm_graphics/AT20/refresh/AL202020_key_messages+png/025743_key_messages_sm.png)

And the Eastern Pacific
Updates on individual named storms can be obtained here.
And the Western Pacific


Weekly Tropical Forecast

– Return to Directory
Intermediate-Term Weather Forecast
And shifting to the Alaska and CONUS Intermediate-Term Weather Forecast showing from left to right, Days 1- 5, 6 – 10, 8 – 14 and Weeks 3 – 4 You can click on these maps to have them enlarge, there are larger versions in the Addendum (More Weather the link is shown at the end of this section, and there are larger versions of these maps in the Addendum. Also, the discussions that go with these forecast maps can be found here (first two weeks) and here (Weeks 3 and 4).
First Temperature
|
|
|
|


And then Precipitation
|
|
|


For those interested in more detail, there are additional weather maps and information in the MORE WEATHER Addendum. The link to the Addendum is here. |
– Return to Directory
Mesoscale Events
The following map shows where mesoscale events are occurring or forecast. If you do not see any areas highlight on this map than there are no mesoscale events taking place or forecast. A mesoscale event is a very serious situation for a very small area and detailed information is provided for these events when they occur or are forecast. If a mesoscale event is shown, click on the map and more detail on the event will be shown.

Two different parts of the NWS issue this map and they are not always in agreement although they are pretty close. They (Norman Oklahoma and College Park Maryland) issue the alerts when they realize the need, so it is best to look on both maps and click one or both if you see areas highlighted.

This next map showing where “Headlines” have been issued for convection (and an animation of the recent movement of storms) should update and you should be able to click on to get additional details but if it does not update when you click on it, click here.
There is a slight difference between convection and thunderstorms. The below map shows where “Headlines” have been issued for Thunderstorms. You should be able to click on the map to get additional details but if it does not update, you can click here.

The map below shows the current wildfire risk which becomes more significant as we move into Summer. When you click on this image it takes you to the SPC Fire Warning Page and you get a set of maps for Days 1, 2, 3 – 8, etc. You can then click on those for more detailed information. The map is a bit blurry as I tried to make it a bit larger than the map provided by NOAA but should be able to see where the current wildfire risks are. But if you click on this map, you will get to see three maps that show the risk for different time periods.
– Return to Directory
Now the Day 3 – 7 Hazards Outlook Maps

The orange and red outlined areas are what is most concerning of the forecasted Day 3 – 7 Hazards. This graphic does not update during the weekend. There is a discussion that goes with this graphic and you can access that discussion here.
The following is provided to help the reader relate the maps to how NWS will describe an area of the U.S.

– Return to Directory
Now to our More Detailed Weather Report
This graphic is about Atmospheric Rivers i.e. thick concentrated movements of water moisture. More explanation on Atmospheric Rivers can be found by clicking here or if you want more theoretical information by clicking here. The idea is that we have now concluded that moisture often moves via narrow but deep channels in the atmosphere (especially when the source of the moisture is over water) rather than being very spread out. This raises the potential for extreme precipitation events.


500 MB Mid-Atmosphere View
The map below is the mid-atmosphere 3-Day chart rather than the surface highs and lows and weather features. In some cases, it provides a clearer less confusing picture as it shows only the major pressure gradients. This graphic auto-updates so when you look at it you will see NOAA’s latest thinking. The speed at which these troughs and ridges travel across the nation will determine the timing of weather impacts. This graphic auto-updates I think every six hours and it changes a lot. Thinking about clockwise movements around High-Pressure Systems and counterclockwise movements around Low-Pressure Systems provides a lot of information.


| Day 3 Above, 6 Below | Day 4 Above,7 Below | Day 5 Above. |
|  |  |
 |  |  |
Here are the precipitation forecasts. First the cumulative for Days 1 – 3

Then cumulative for Days 1 – 5

Then cumulative for Days 1 – 7

Now we look at the forecast for the Maximum Temperature three days out.
Looking ahead to next week.

– Return to Directory
Additional Tools to Obtain Watches and Warnings
| Current watches, warnings, and advisories issued by the agencies of the National Weather Service. Hazards should show up in the various maps but the below links will take you to all outstanding watches and warnings in each category which may include some categories not covered in the various maps or difficult to find. So if there is a category of interest, click on the appropriate link below. |
|
Below you will see a number of different maps that are updated in real-time, making this a “live” report. If a part of one or more of the maps shows an area that is highlighted, you can click on it and get the full current report. By having the reader click on these active situations rather than having GEI do so, you will not miss any events in which you might have an interest and which we had not noticed and the page will not get cluttered with warnings, etc that have since expired.
Our focus here is events that are likely to last in the range of six hours but there can be longer or shorter events that are addressed by the Storm Prediction Center which is the main source of the information in this article. Long-term major events like a Hurricane are more likely to be in a separate article. But that may not always be the case. Since in general, all the links on this page transfer you into the NOAA system, in order to get back into this article you need to either close the tab to which you were transferred or click back on the tab that has this article.
| Live Warning Maps which If Severe Weather is Shown can be Clicked on to get more detail about these events. If there is a current warning shown on the map, click on the map for additional information related to the event. | These maps are updated as risks are identified. |
| This is the current graphic showing any mesoscale discussions (MD’s) which are in effect over the contiguous United States. Please read the description of the purpose of our MD’s for further information. Details on all valid MD’s may be found on our Current Mesoscale Discussions page. |  |
| Convective Outlooks | |
|---|---|
| This is today’s forecast for organized severe thunderstorms over the contiguous United States. Please read the description of the risk categories for further information. You may find the latest Day 1 Outlook available as well as all Outlooks issued today online. | Today’s Outlook |
 | |
| This is tomorrow’s forecast for organized severe thunderstorms over the contiguous United States. Please read the description of the risk categories for further information. The latest Day 2 Outlook is available as well as all Outlooks that have been issued today. | Tomorrow’s Outlook |
 | |
| This is the day after tomorrow’s (day 3) forecast for organized severe thunderstorms over the contiguous United States. Please read the description of the risk categories for further information. The latest Day 3 Outlook is available as well as all Outlooks that have been issued today. | Day 3 Outlook |
 | |
| This is the day 4-8 forecast for organized severe thunderstorms over the contiguous United States. The latest Day 4-8 Outlook is available as well as all Outlooks that have been issued today. Note: A severe weather area depicted in the Day 4-8 period indicates a 30% or higher probability for severe thunderstorms (e.g. a 30% chance that a severe thunderstorm will occur within 25 miles of any point). | Day 4-8 Outlook |
 | |
| The Thunderstorm Outlooks depict the probability of thunderstorms across the contiguous United States in 4 or 8 hour time periods. The probabilistic forecast directly expresses the best estimate of a thunderstorm occurring within 12 miles of a point. The three probabilistic forecast thresholds are 10, 40, and 70 percent. | Thunderstorm Outlook |
 | |
| Fire Weather Outlooks | |
| This is today’s forecast for organized wildfires over the contiguous United States. Please read the description of the risk categories for further information about this product. | Today’s Outlook |
| |
| This is tomorrow’s forecast for organized wildfires over the contiguous United States. Please read the description of the risk categories for further information about this product. | Tomorrow’s Outlook |
 | |
| This is day 3-8 forecast for organized wildfires over the contiguous United States. Please read the description of the risk categories for further information about this product. | Day 3-8 Outlook |
 | |


