Written by Sig Silber
Here is the May 21, 2020, NOAA 15-month forecast for CONUS and Alaska including the Early Outlook for June 2020 and forecasts out through August 2021. It covers a period that begins one month later than the forecast last month and extends one month longer. At first glance it just seems like another seasonal outlook from NOAA where they hardly changed anything. But there is more here than meets the eye. Monday night we will see if JAMSTEC agrees. I provided some hints on that tonight and also some hints from the Australian Agency, the BOM. It looks like the first two seasons of the NOAA forecast are pretty solid. Unfortunately for the U.S. West and the Southern Plains, they are also pretty dry.

At this point do not pay much attention to the Season three and four forecasts from NOAA and the Season three forecast from JAMSTEC that I will publish Monday Night as there are too many questions about the state of ENSO going forward.
I tried hard to find any significant differences between this forecast and the one issued a month ago. But other than some minor changes in the forecast for Alaska, it was challenging. The Early Outlook for the immediate next month has nothing to compare it against and it is influenced by short-term factors perhaps in this case the MJO so that is different than the three-month forecast and the forecasts for the next three seasons. I had to look for slight differences in timing from one month to the next. So the conclusion is that for the moment, the view looking ahead by NOAA is stable at least for Summer and probably also for Fall.
Please share this article – Go to the very top of the page, right-hand side for social media buttons. Please feel free to share this report with anyone you feel will find it useful.
A. Focus on the NOAA Update
A note about terminology; the deviations from climatology/normal are color-coded but also labeled “A” for more than (above) normal and “B” for less than (below) normal. The area designated EC means Equal Chances of being more or less than normal. In my comments For the shorter-term maps, NOAA uses “N” instead of “EC” as they believe they can be more definitive with respect to shorter timeframes. So the words “warm”, “cool”, “wet”, “dry” should be generally interpreted as being relative to climatology/normal for that location and time of year.
First, we will take a look at the NOAA Early Outlook for June, 2020. It is called the Early Outlook because it will be updated at the end of May. Only the June Outlook will be updated at that time.
Temperature

Precipitation

We have nothing to compare these maps with as NOAA does not provide in their Update a forecast for each of the subsequent two months separate from their three-month forecast. Thus I do not have forecast maps for June from the previous NOAA Report to compare against. And the current month is not over so we can not really compare the forecast for next month against the actual for this month. It is probably best to just try to understand what NOAA is trying to convey about June*. For Temperature, it is mostly warm for Alaska and the Alaskan Panhandle and for most of CONUS except for a large Central Area that is EC. With respect to precipitation, southwest Alaska is wet but the western parts of Washington and Oregon are dry: that combination being a bit unusual. The Southeast is wet as is most of the Great Plains and some of the states west of the Great Lakes.
* compared to normal/climatology for the indicated time of the year.
Visual Consistency Testing.
It is useful to see how the month forecast fits with the set of shorter forecasts that we have. The first map covers mostly May so only two of the three maps are really useful for this purpose. The third map extends the coverage through the first 19 days of June. The Seasonal Outlook was issued late this month since the third Thursday fell on May 21, 2020 the latest it can be Nineteen days of shorter forecasts is not a perfect basis for doing this visual consistency testing but it is what we have to work with and there are only thirty days in June. It may tell us how the last eleven days of the month should differ from the first nineteen days for the full-month forecast to be accurate.
First Temperature
 |  |  |
| The new monthly forecast is to the right. Does it appear to be reflective of the parts of the month for which we have forecasts? → |
| ↑ ← The full month forecast fits fairly well with the 8 to 14 Day and Week 3 – 4 forecast which together covers nineteen days of June at the time we published. We will revisit the forecast at the end of May when the June forecast is updated. |

And then Precipitation
 |  |  |
| The new monthly forecast is to the right. Does it appear to be reflective of the parts of the month for which we have forecasts? → |
| ↑The full month forecast fits fairly well with the 8 to 14 Day and Week 3 – 4 forecast which together covers nineteen days of June at the time we published. We will revisit this forecast at the end of May when the June forecast is updated. ← |
Now we consider the three-month Outlook.
Notice that the three-month periods are abbreviated e.g. June/July/August is shown as JJA. You will see such abbreviations often in this report.
Prior Temperature Outlook for JJA 2020

New Temperature Outlook for JJA 2020

Now Precipitation.
Prior forecast for JJA 2020

New Precipitation Outlook for JJA 2020

Now let us focus on the long-term situation.
First Temperature
Prior 14 Month Temperature Outlook: JJA 2020 – MJJ 2021

New 14 Month Temperature Outlook: JAA 2020 – JJA 2021

To compare maps from one release to another, one needs to remember that the new release drops one three-month period and adds a later one. So to make the comparisons one has to shift the new maps to the right one position and that makes the map on the right drop down to become the left-most map in the next level. I do not have a computer software tool for doing that for you so you have to do it mentally. When I do the comparison, I print the two sets of maps and put them side by side and number the same three-month maps 1, 2, 3,…..,11 in both sets of maps to make it easier for me to easily compare the same three-month period in the new with the previous forecast. One uses the same procedure to compare the precipitation maps. Based on this procedure, I conclude that:
Now Precipitation
Prior 14 Month Precipitation Outlook: JJA 2020 – MJJ 2021

New 14 Month Precipitation Outlook: JAS 2020 – JJA 2021

If you want larger versions of each map (temperature and precipitation) you can find them here. And then each of those maps can be clicked on to further enlarge them.
Sometimes it is useful to compare the three-month outlook to the forecast for the first of the three months. It shows how much the pattern changes over the three-month period.

One can mentally subtract the First-Month Outlook from the Three-month Outlook and create the Outlook for the last two months in the three-month period.
*The concept is that the probabilities of a deviation from climatology in the First Month and the combined Month Two and Three forecast that one derives must average out to the probabilities shown in the three-month maps.
Below is the NOAA Discussion (slightly reorganized) released by NOAA on April 16, 2020. Headings that are “Initial Cap” only rather than all caps were added by the Author of this Update Report for clarity. Also, we have organized the sequence of the sections of NOAA Discussion to first present the Atmospheric and Oceanic Conditions and then the Initial Month (May), the new NOAA Summary for MJJ, and finally the remainder of the 15-Month Forecast.
CURRENT ATMOSPHERIC AND OCEANIC CONDITIONS
Oceanic and atmospheric observations across the equatorial Pacific indicate ENSO-neutral conditions persisted into May. The observed weekly SSTs, centered on May 13, feature average or slightly negative anomalies from 160-100 degrees W with positive anomalies west of the Date Line. Positive subsurface temperature anomalies (averaged across 180-100 degrees W) continued to decrease with an eastward expansion of below-average subsurface temperatures. Upper-ocean heat anomalies have declined rapidly since earlier this spring. From April 17 to May 16, easterly low-level wind anomalies were present east of the Date Line with westerly upper-level anomalies along and south of the equator. Outgoing longwave radiation (OLR) anomalies, during this same time period, featured suppressed convection across the equatorial central and eastern Pacific.
PROGNOSTIC DISCUSSION OF SST FORECASTS
The CPC SST Consolidation for the Nino 3.4 region indicates a steady decline into negative anomalies to -0.5 degrees C by JAS with negative anomalies peaking during the fall season. The SST constructed analog and Markov model indicate a persistence of ENSO-neutral conditions through the summer and fall. The CPC/IRI consensus forecast favors a continuation of ENSO-neutral conditions (with about a 65 percent chance) during the Northern Hemisphere summer with chances decreasing through the fall (to 45-50 percent).
30-DAY OUTLOOK DISCUSSION FOR JUNE 2020
The June 2020 temperature and precipitation outlooks are based primarily on dynamical model guidance, statistical tools, and current soil moisture conditions. ENSO-neutral conditions are currently present across the Tropical Pacific, and the consensus forecast indicates that ENSO-neutral conditions are likely to remain in place throughout the month of June and into the next several seasons. SSTs have cooled across most of the equatorial Tropical Pacific during the last several weeks and are near or below average over the eastern equatorial Pacific. The Madden-Julian Oscillation or MJO has recently become active with convection centered over the Indian Ocean. Dynamical model forecasts, including the NCEP CFSv2, indicate that the MJO is expected to remain active and propagate across the Maritime Continent into the western Pacific Ocean, potentially influencing the climate over North America in three to four weeks from the present time. Statistical tools show that the active MJO in the current phase will potentially enhance the chances of below normal temperatures across much of the eastern CONUS and above normal temperatures for parts of the western CONUS in early June. The transient MJO impact will potentially influence June monthly average temperatures and increase the uncertainty in the June outlook. Absent a signal from ENSO, the June temperature outlook is somewhat impacted by decadal time scale temperature trends, moderated by shorter timescale climate impacts, including soil moisture feedbacks. If the MJO or related atmospheric Kelvin wave propagates eastward over the Western Hemisphere during early June, this would provide a favorable large scale environment for tropical cyclone development across the northwest Caribbean and southern Gulf of Mexico and may impact precipitation for parts of the southeastern CONUS.
Temperature
The June temperature outlook calls for enhanced probabilities for above normal temperatures for all of Alaska with probabilities exceeding 50 percent for southwestern areas of the state, where nearby sea surface temperatures are above average. The week 3-4 temperature outlook indicates likely above normal average temperatures for the first half of June for Alaska, and dynamical model forecasts from the CFS as well as the NMME support above normal temperatures for the month. Above normal temperatures are also likely for the month of June for the western CONUS, primarily to the west of the continental divide, supported by dynamical model forecasts from the CFS and NMME, and similar in extent to predicted likely above normal temperatures in the first half of June by the CPC week 3-4 outlook. Probabilities exceed 50 percent for much of the Great Basin and Southwest regions, where the signal due to decadal temperature trends is greater. Uncertainty increases across much of the central and eastern CONUS, due in part to the influence of shorter timescale climate signals such as the MJO. A large area of equal chances of below, near or above normal temperatures is indicated for the month of June from the Northern and Central Plains across the Upper and Central Mississippi Valleys, where there is greater ensemble spread among individual models of the NMME. Temperatures for the month of June may also be moderated across this area by current positive soil moisture anomalies and an above normal precipitation forecast. Probabilities of above normal temperatures increase for the Gulf Coast states as well as the Eastern Seaboard and Northeast regions, supported by dynamical model forecasts including the CFS and NMME models. Models consistently show a high probability of above normal temperatures for the southern Florida Peninsula where the probability of above normal temperatures exceeds 50 percent. Above normal temperatures for the Northeast region are also supported by larger positive decadal temperature trends for this region.
Precipitation
The June precipitation outlook calls for enhanced probabilities of below normal precipitation for western areas of the states of Wasington and Oregon, supported by dynamical model forecasts including NMME probability forecasts, where seasonal climate signals indicate a broader area of likely below normal precipitation. However, dynamical models indicate uncertainty is greater in the individual month of June. Probabilities of above normal precipitation are enhanced over a large area of the eastern CONUS stretching from eastern areas of the Great Plains across the Central and Lower Mississippi Valleys and the Southeast region to the southern Atlantic coast, supported by probability forecasts from the NMME. Dynamical models , including the CFS, indicate an active Gulf of Mexico in June. Skill in precipitation forecasts is limited but a clear signal is apparent in dynamical models for a large area of the eastern CONUS. Models are less consistent for the Northeast region June precipitation forecast where equal chances of below, near and above normal precipitation is indicated. Dynamical model forecasts from the NMME indicate much of the precipitation signal over Alaska is along the southern coast, where probabilities of above normal precipitation are increased.
SUMMARY OF THE OUTLOOK FOR NON-TECHNICAL USERS (Focus on June/July/August)
The June-July-August (JJA) 2020 temperature outlook favors above-normal temperatures across the West, Gulf Coast States, and along the East Coast. The largest probabilities (above 70 percent) of above normal temperatures are centered over the Four Corners region. Equal chances of below-, near-, or above-normal temperatures are forecast from the upper to middle Mississippi Valley along with parts of the northern to central Great Plains. The JJA precipitation outlook features increased chances of above normal precipitation for much of the eastern and central U.S., while below-normal precipitation is more likely across the Pacific Northwest, northern Great Basin, and much of the Rockies. Above-normal temperatures are favored throughout Alaska during JJA with increased chances of above-normal precipitation forecast for the Aleutians and most of mainland Alaska.
During the late summer and early fall season, increased chances of above normal temperatures expand to include the entirety of the continental U.S. (CONUS) with the largest probabilities remaining over the Southwest. Meanwhile, chances of above-normal precipitation remain elevated across the Midwest, Southeast, and mid-Atlantic through August-September-October. By December-January-February 2020-2021, equal chances were introduced to the northern to central Great Plains and Midwest. Increased chances of above normal precipitation shift from the Southeast to the northern areas of the CONUS during October-November-December, while chances of below normal precipitation expand across the southern tier of the CONUS.
Equal chances (EC) are forecast in areas where the likelihood of seasonal mean temperatures or seasonal accumulated precipitation amounts are expected to be similar to climatological probabilities.
BASIS AND SUMMARY OF THE CURRENT LONG-LEAD OUTLOOKS
PROGNOSTIC TOOLS USED FOR U.S. TEMPERATURE AND PRECIPITATION OUTLOOKS
Tools used for the seasonal outlooks included dynamical model guidance such as the North American Multi-Model Ensemble (NMME) and the Calibration, Bridging, and Merging (CBaM) version of the NMME. Current soil moisture conditions played a role in the JJA temperature outlook, primarily across the Great Plains and Four Corners region. The consolidation tool, which includes NMME input and various statistical tools, was used especially at later leads. The likelihood that either ENSO-neutral or La Nina prevails later this summer through the fall season played a role in both temperature and precipitation outlooks. During the 2021 warm season decadal trends were relied upon.
PROGNOSTIC DISCUSSION OF OUTLOOKS – JJA 2020 TO JJA 2021
TEMPERATURE
Above-normal temperatures are favored for much of the CONUS and Alaska during JJA with the largest probabilities forecast across the West and Northeast, based on excellent agreement among tools including a strong decadal signal. Probabilities of above normal temperatures were increased across the Four Corners region from the previous outlook due to a notable trend in the latest model guidance, consistent with an increasing signal for below normal precipitation, and ongoing low soil moisture conditions. Conversely, high soil moisture was one of the factors for equal chances of below-, near-, or above-normal temperatures forecast across parts of the central U.S. this summer. Beginning in JAS, coverage with increased chances of above normal temperatures expanded as the effect of anomalous soil moisture wanes and decadal trends support a larger coverage of above normal temperatures. From ASO 2020 through NDJ 2020-2021, changes from the previous outlook were to slightly increase (decrease) probabilities of above normal temperatures across the Southwest (Pacific Northwest to northern Rockies). These minor changes were based on the latest consensus among dynamical and statistical tools. An expected lack of sea ice elevates chances for above normal temperatures across northern Alaska during the fall season. The temperature outlook at the longer lead times is based largely on trends .
PRECIPITATION
The precipitation outlooks are based primarily on the latest dynamical model guidance, through OND, along with long-term trends . Compared to the previous outlook for JJA, a slight tilt in the odds of below normal precipitation was expanded south to include the Four Corners region. Consistent with the NMME and consolidation tool, probabilities above 40 percent for above normal precipitation were shifted south to the Gulf Coast States and the Southeast. A large coverage of modest probabilities for above or below normal precipitation are forecast across the CONUS due to inherent uncertainty in convective rainfall during the summer. Elevated probabilities of above normal precipitation were slightly increased across mainland Alaska, in part due to the June outlook. Elevated chances of above normal precipitation across the Southeast and mid-Atlantic were maintained longer through the fall, compared to previous outlooks. The most notable trend in the latest dynamical model guidance, during the late fall and next winter was an expansion of a dry signal throughout the southern tier. Although no changes were made to the precipitation outlook beyond DJF 2020-2021, the future evolution of ENSO conditions will have to be closely monitored in subsequent outlooks.
At the longer leads, MJJ through JAS 2021, the tilt in the odds towards above normal precipitation across parts of the central and eastern U.S. is consistent with long-term trends . Also, the favored area for below-median precipitation across parts of the Southwest during the spring 2021 is related to trends
New Seasonal Drought Forecast (It is not set up to auto-update but you can always find the new forecast here)

Latest Seasonal Assessment – As the dry season starts in late May and June for the western contiguous U.S. and based on precipitation and temperature forecasts and outlooks at most time ranges, the most likely outcome is for current drought to persist and for potential new drought development in currently anomalous dry areas in the Pacific Northwest, the Northern Intermountain Region, parts of central California and the Central Great Basin. This is associated with well below normal precipitation since the beginning of the Water Year (Oct 1, 2019) and the expectation of warm, dry conditions in Jun-Jul-Aug (JJA). Drought removal or improvement is favored for parts of the Central and Southern High Plains, with the expectation of a favorably wet JJA climatology and all range forecasts and outlooks. For the areas of drought near the Gulf Coast, nearly all official precipitation outlooks from one week to one season in advance favor at least a one-category improvement in drought conditions, resulting in drought removal for most areas. Elsewhere across the Lower 48 states, no broad-scale areas of drought are expected to develop. In Hawaii, with the rainy season ending and outlooks at all time ranges favoring warm and dry conditions, either new drought development or persistence of existing drought is favored in most of the leeward areas. The only exception is the west side (Kona slopes region) of the Big Island, which has its wet season during the summer. There is no drought at the current time in Alaska, and there are no convincing indications to the contrary for the June-August season. Drought in the southern Puerto Rico is likely to persist for June-August.
ENSO Considerations
Here is what NOAA released last Thursday which is the official time for them to make that release.
ENSO Update

Here is what NOAA released at the time from IRI/CPC

Then just five days later on May 19, IRI/CPC released their second forecast which is the automated forecast from the computer models.

This is quite different.
Here they are side by side.

Also available but not usually so is what is called the plume of forecasts.

NOAA has their own proprietary model which they rarely use.

And here is the JAMSTEC evaluation
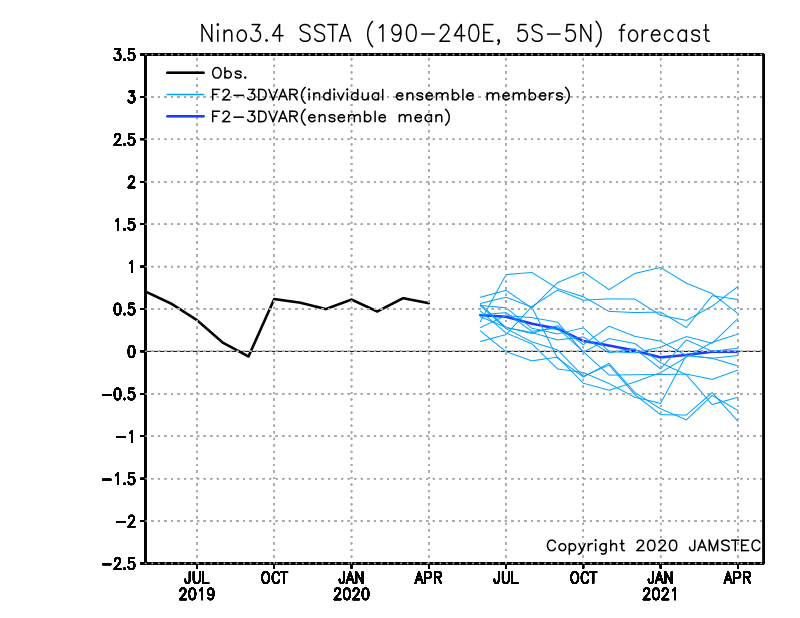
Here is the short JAMSTEC discussion. We will discuss it a bit more on Sunday. For our purposes tonight I have only highlighted the comments that apply to Alaska and CONUS.
May 14, 2020 Prediction issued on May 1, 2020
ENSO forecast:
Observation shows that almost all of the tropical Pacific Ocean is warmer-than-normal at present. The SINTEX-F predicts that the tropical Pacific will return to a neutral-state from summer.
Indian Ocean forecast:
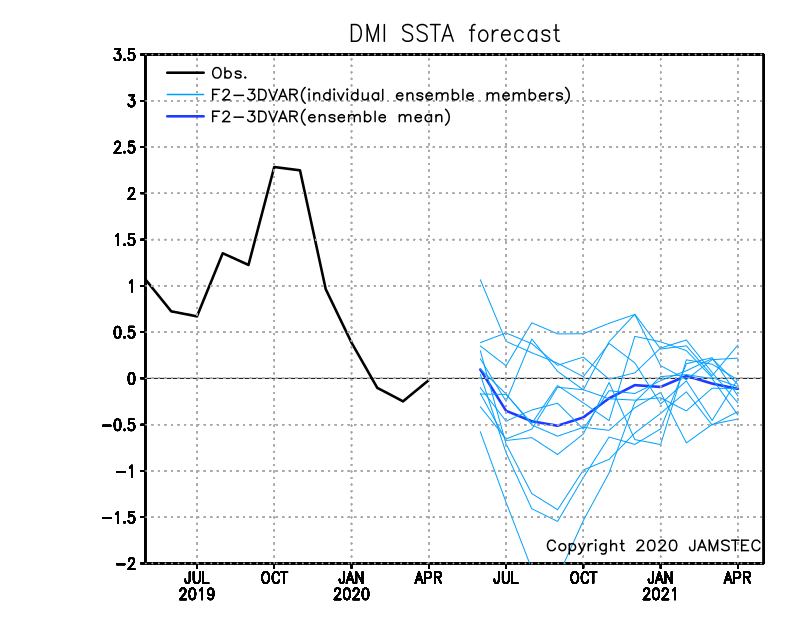
Observation shows that the tropical Indian Ocean is warmer-than-normal at present. The model predicts the evolution of a moderately negative Indian Ocean Dipole from boreal summer.
The strong negative Indian Ocean Subtropical Dipole still persists. The model predicts that it will disappear from austral winter.
Regional forecast:
On a seasonal scale, the SINTEX-F predicts that most part of the globe will experience a warmer-than-normal condition in boreal summer and autumn.
As regards to the seasonally averaged rainfall in boreal summer, a drier-than-normal condition is predicted for central part of U.S.A., California, northern part of the South American Continent, and West Africa. In contrast, most part of Southeast Asia, Philippines, Indonesia, India, eastern China, and the Korean Peninsula will experience a wetter-than-normal condition. In boreal autumn, a wetter-than-normal condition is predicted for northwestern coastal area of Canada, most part of the South American Continent, Philippines, and Indonesia. In contrast, northwestern part of southern Africa, southern part of West Africa, India, some parts of the Southeast Asia, southern China will experience a drier-than-normal condition.
The model predicts most part of Japan will experience warmer and wetter-than-normal condition in summer and autumn as a seasonal average.
And the JAMSTEC perspective on the IOD.
And the perspective from Australia

May 12, 2020
Negative Indian Ocean Dipole possible in 2020, tropical Pacific likely to cool
Both the El Niño–Southern Oscillation (ENSO) and Indian Ocean Dipole (IOD) are currently neutral. However, all models surveyed suggest the possibility of a negative IOD developing in the Indian Ocean from the middle of the southern hemisphere winter. Some model outlooks also suggest a La Niña-like state in the tropical Pacific Ocean is possible later in the southern hemisphere winter or spring.
While all models show that a negative IOD is more likely than not, individual models show a broad spread of likely scenarios covering both the neutral IOD and negative IOD range. Additionally, accuracy of IOD forecasts made during autumn have lower accuracy than at other times of year, but accuracy improves in winter. A negative IOD typically brings above average winter–spring rainfall to southern Australia.
Key indicators of ENSO, such as the Southern Oscillation Index (SOI), trade winds, cloudiness near the Date Line, and sea surface temperatures in the tropical Pacific Ocean, all persist at levels consistent with neutral ENSO. However, sea surface temperatures in parts of the tropical Pacific Ocean have dropped by around half a degree in the past fortnight. Additionally, sub-surface temperatures in the tropical Pacific Ocean continue to decrease, indicating further potential for cooling at the surface in the coming months under the right conditions.
Most climate models surveyed by the Bureau indicate that ENSO is likely to stay neutral through the southern hemisphere winter. However, in early-to-mid spring, three of the eight models reach or exceed La Niña levels. Like IOD predictions, ENSO predictions made during autumn tend to have lower accuracy than predictions made at other times of the year. This means that current ENSO forecasts should be used with some caution.
While the Bureau’s ENSO Outlook is currently at INACTIVE level, criteria will be assessed regularly for elevation to La Niña WATCH.
The Southern Annular Mode (SAM) is currently neutral and forecast to remain neutral for the coming three weeks. As the southern hemisphere winter approaches, SAM may start to be able to influence southern Australian rainfall.

B. Conclusion
There were only some fairly minor changes to the three-month forecast.
Perhaps the Fall Forecast is reliable but beyond that there are enough questions about ENSO to throw the for Seasons Three and Four into the circular file.


